In land development, managing multiple plots is difficult due to scattered paperwork, unclear boundaries and limited visualization. Plot allocation and ownership tracking become challenging without structured digital maps. MAPOG solves this by representing each plot as a polygon on the colony base map linked to details like plot number and ownership, allowing planners and developers to manage data efficiently, maintain boundaries, and update projects.
Key Concept of the map
Each plot, represented as a polygon linked to structured attribute data. It defines the exact boundary, while associated fields store plot details. Further, combining spatial boundaries with descriptive information creates structured datasets that enables easy visualization and management of plots within the colony base map.
Step-by-step method for map
Step 1: Create the map
Go to MAPOG, click ‘Create new map’. Choose map template as ‘Category’, add title, description and click ‘Create’.
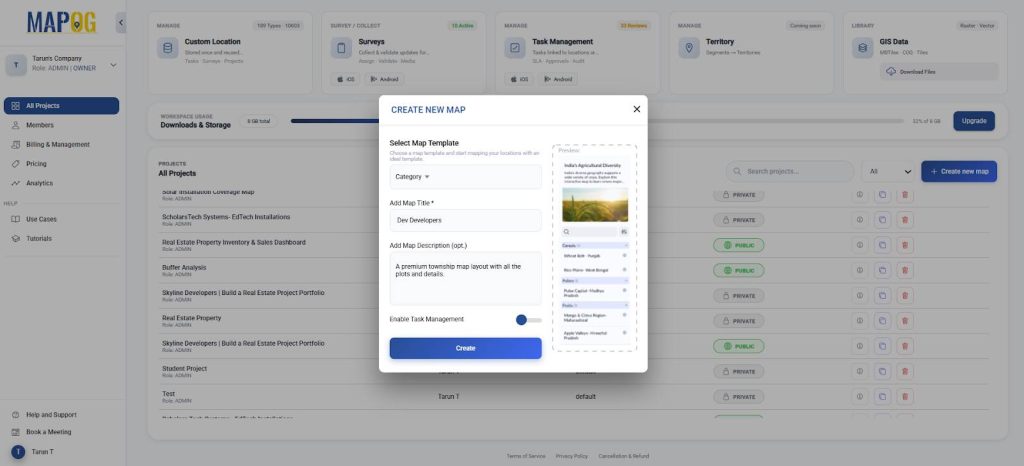
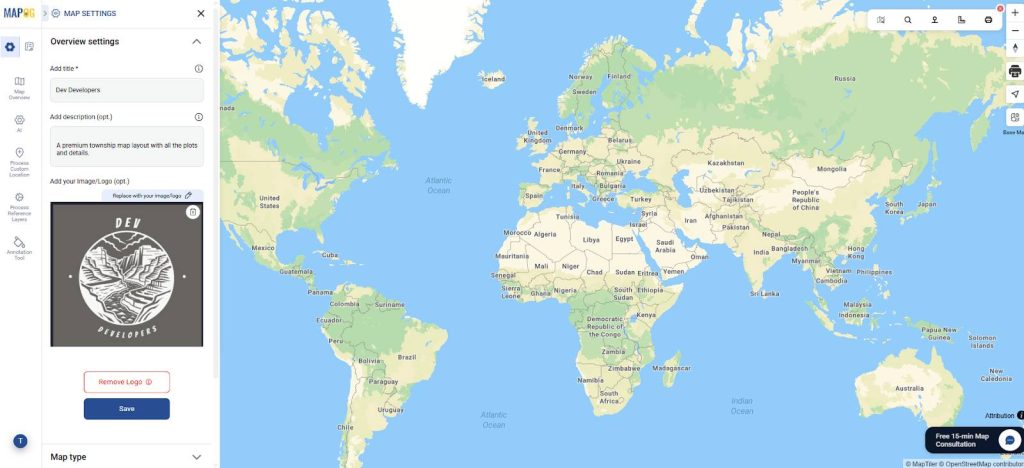
Further, in map settings, using replace option, add company logo and save.
Step 2: Geo-referencing
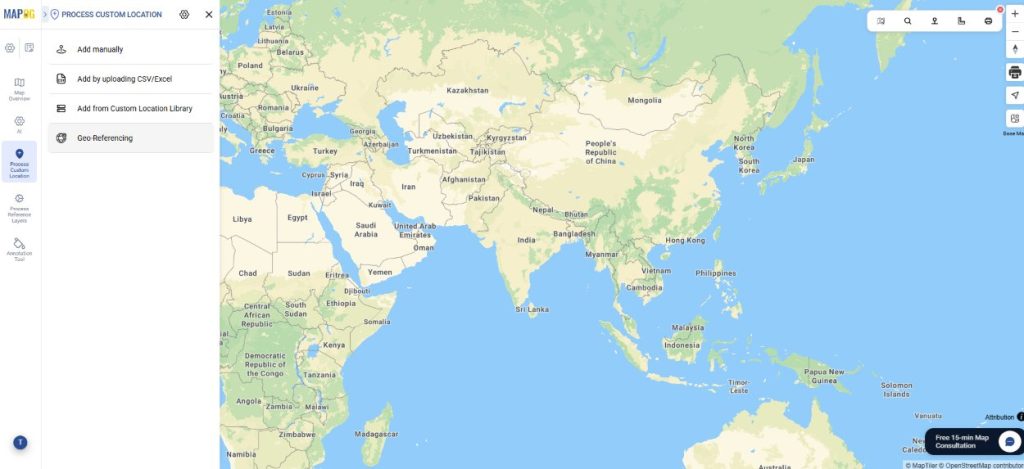
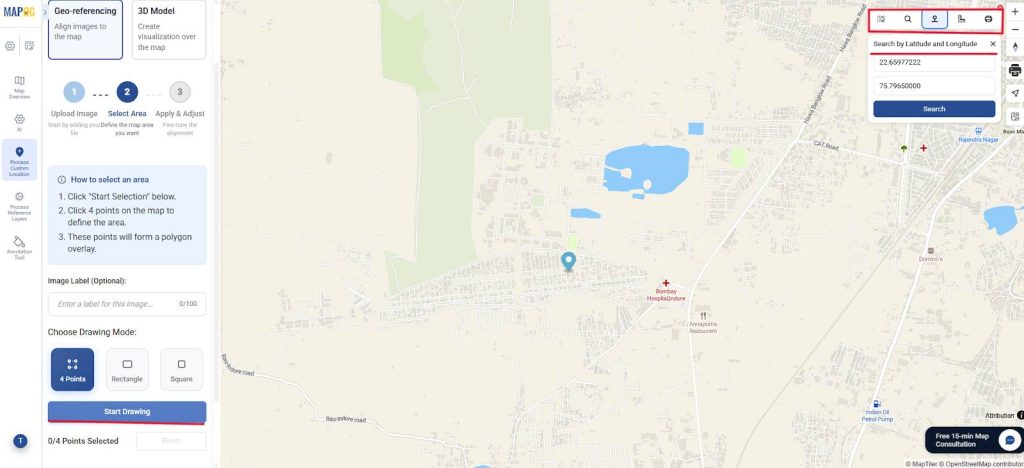
Afterward, upload layout image to basemap for plotting with advanced clarity and presentation, go to ‘Process custom location’ and select “Geo-Referencing”.
Further, upload the layout of your area in PNG/JPG format, press Next.
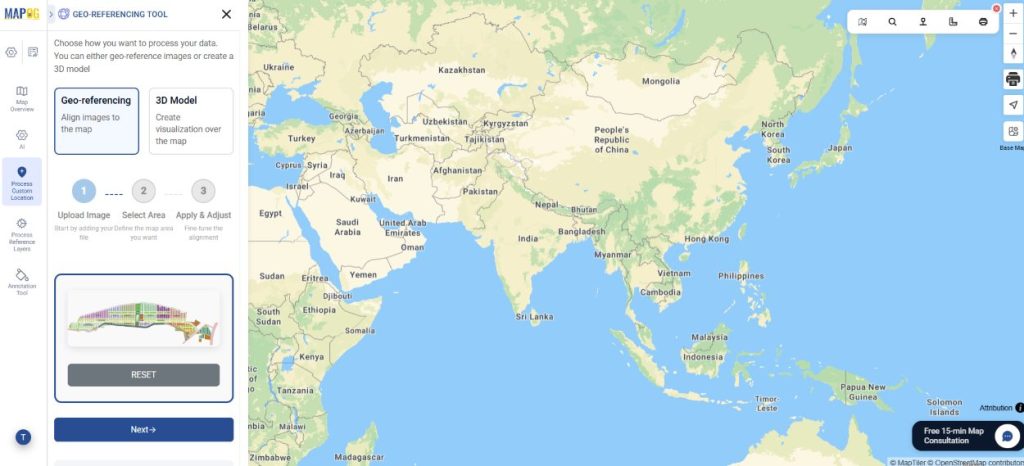
Navigate search by address/coordinates using the toolbar. Once your location is on the basemap, Using drawing mode, select area. Choose from 4 points, square or rectangle. click ‘Start Drawing’.
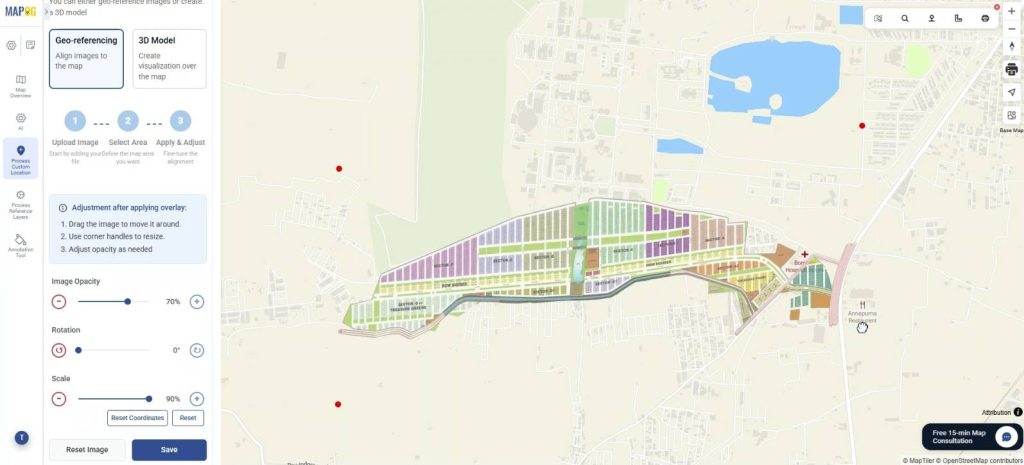
Afterward, click on Next and the layout will be projected onto your basemap. Adjust the projection on the base map to align by using buildings, roads as reference. You can use tools like rotation, scale and image opacity to adjust the layout. When satisfied, save it.
Step 3: Custom location attributes
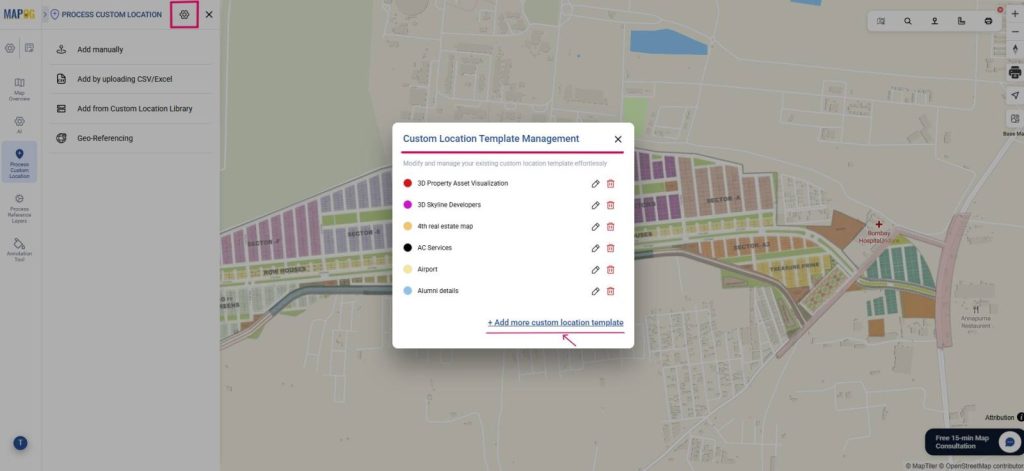
Now, go to process custom location settings, to create your custom location template in order to add all the different types of attributes, with respect to the plots. Click ‘+Add more custom location template’.
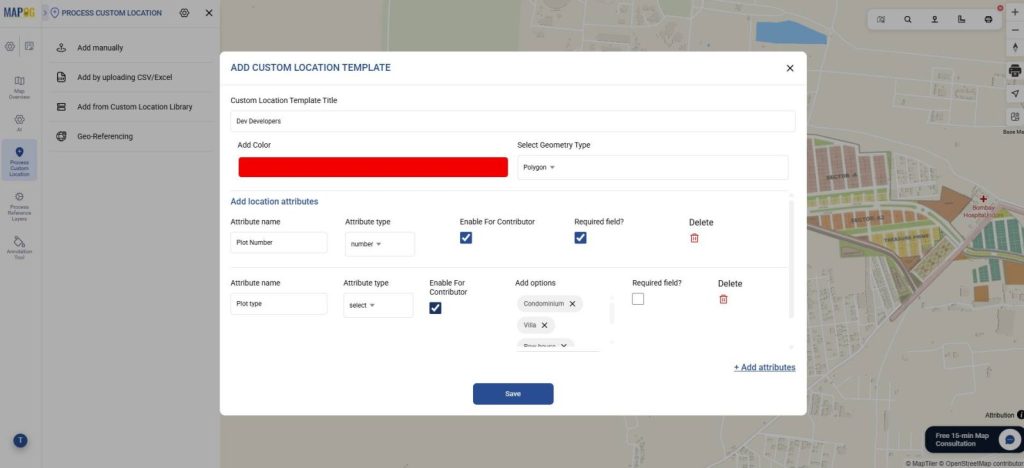
Further, add title, color, select geometry as polygon to depict the boundaries of the plot. Then add all your attributes such as plot number, type, availability, etc. with attribute type such as select, multiselect & save them. Select enable for contributor, so contributor can view or update attribute from anywhere.
Step 4: Add locations on map
Further, add your plots manually as individual polygons. Go to process custom location and select ‘Add manually’.
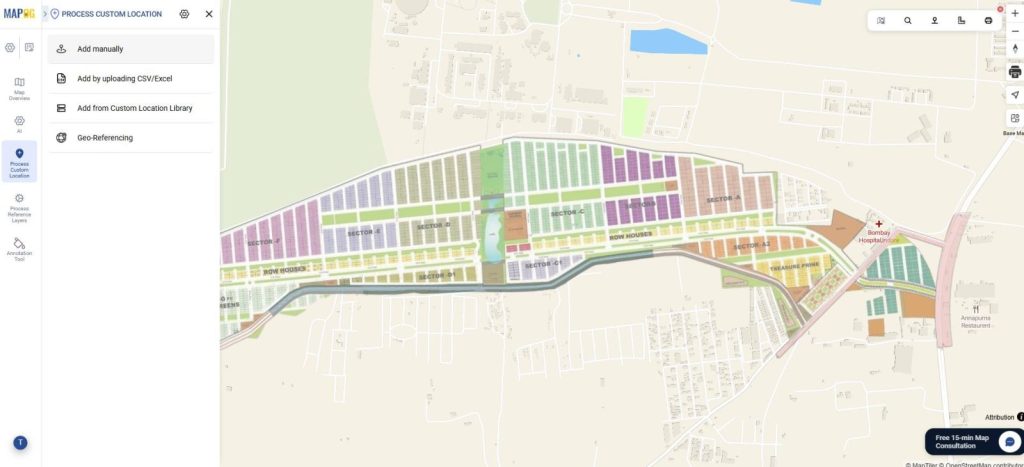
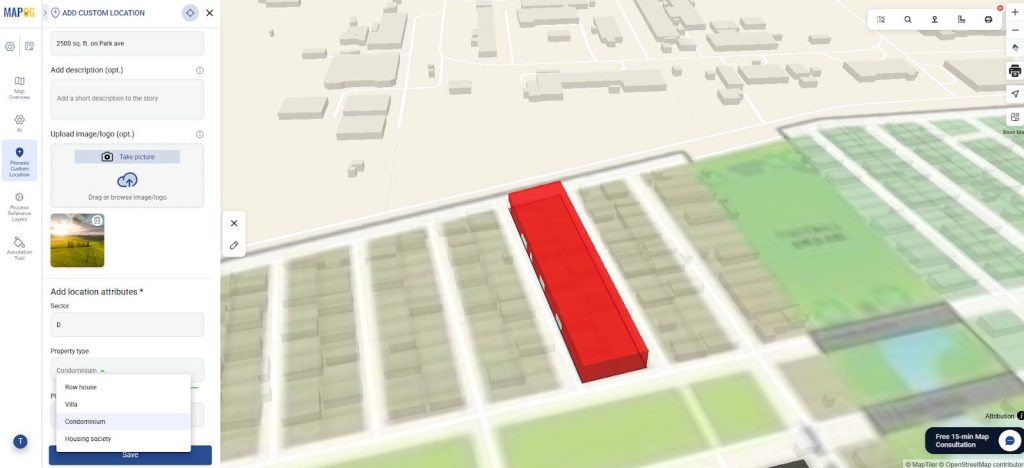
Afterward, select your custom template from the dropdown and your location attributes will appear.
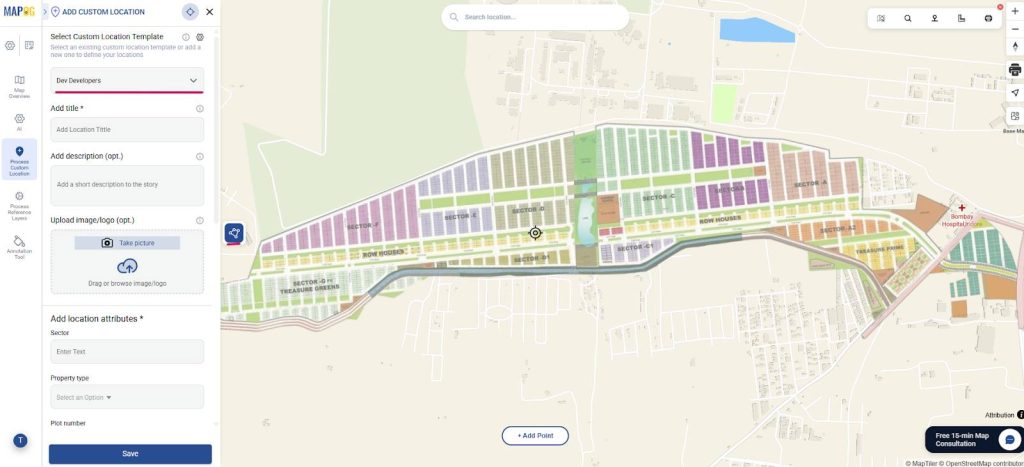
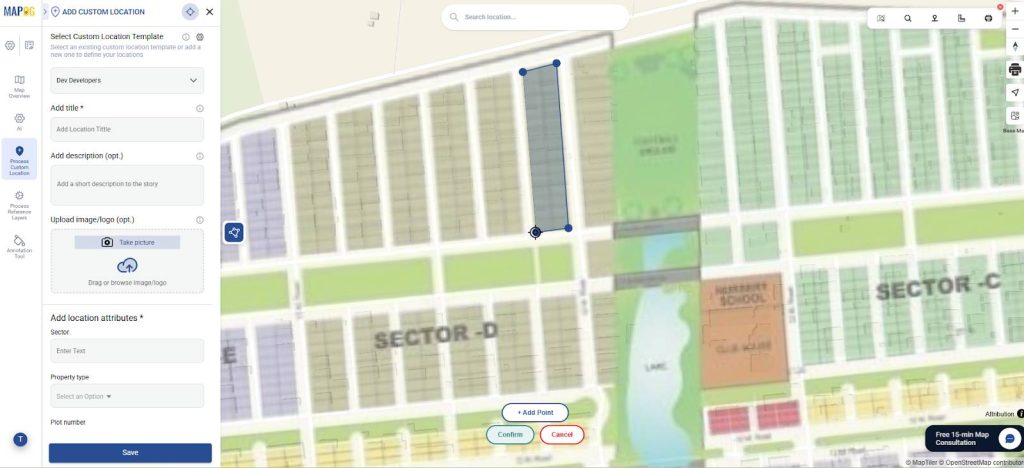
Then, make a polygon for demarcating your plot. Click on the draw polygon option, select add point. Using the cursor to move and zoom in the layout, click it when you get the desired point and confirm to save the plot.
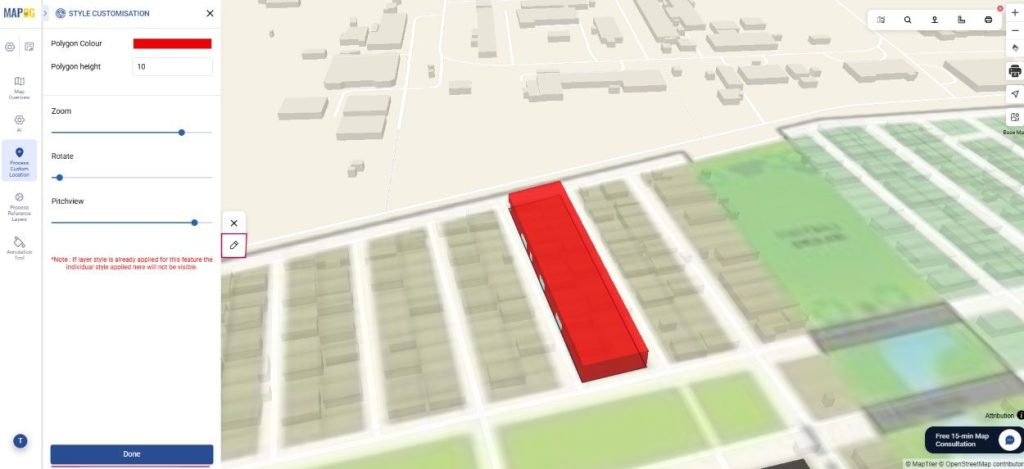
Now, click on the pencil icon to edit the polygon. Here, choose a color, height and also, zoom, rotate or set the layout to pitch view for better visualization. Click done.
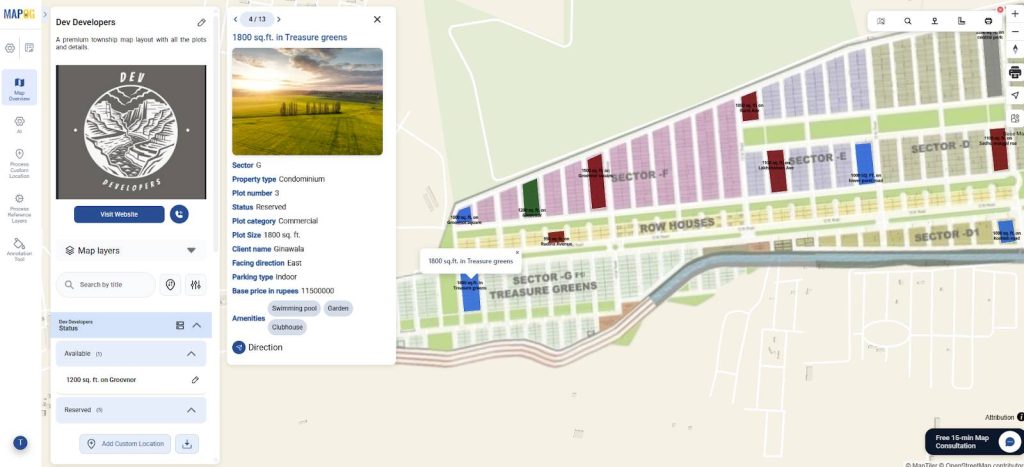
Now, add all location attributes like title, images, etc. Finally, click save and your polygon plot structure location appears on the map. Repeat the same process for all the required plots.
Step 5: Group By, Filter and Sort locations on map
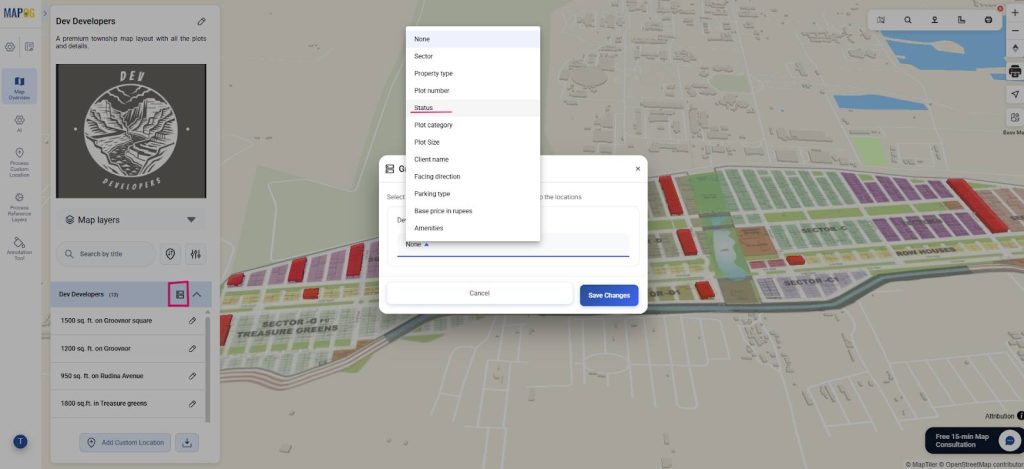
Next, organize your custom locations using “Group by Attributes”. Select the attribute that you want your data to be clustered into like Status. Therefore, data will be grouped based on status like available or sold.
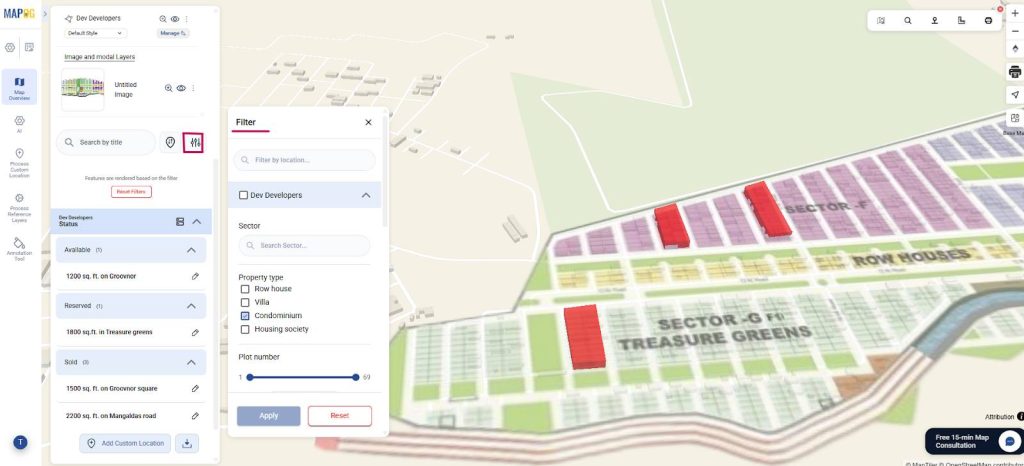
Using the Filter option, view locations selectively based on requirements. Go to Filter and you will view the properties you personally select on the map.
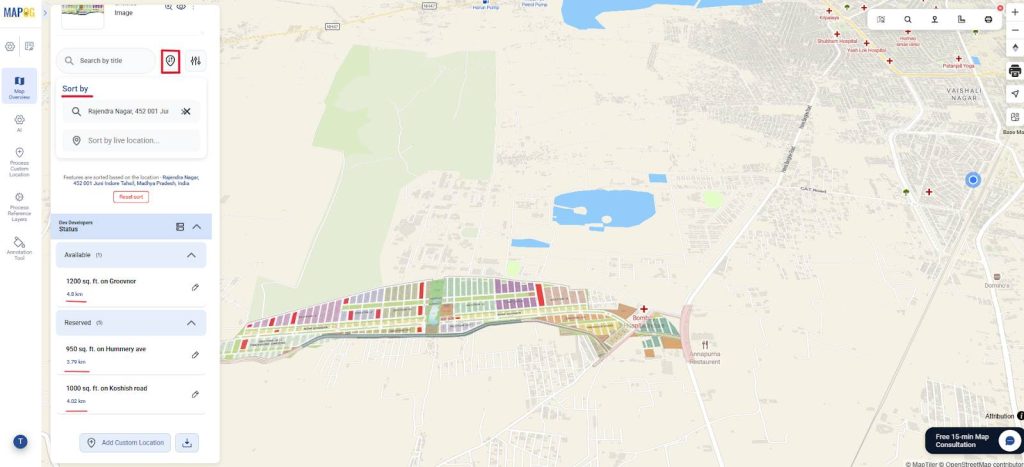
Finally, use ‘Sort by’ and view locations by live distance or by certain location. Type any location and plots are arranged as per proximity to the searched location and the distance from the property will be visible.
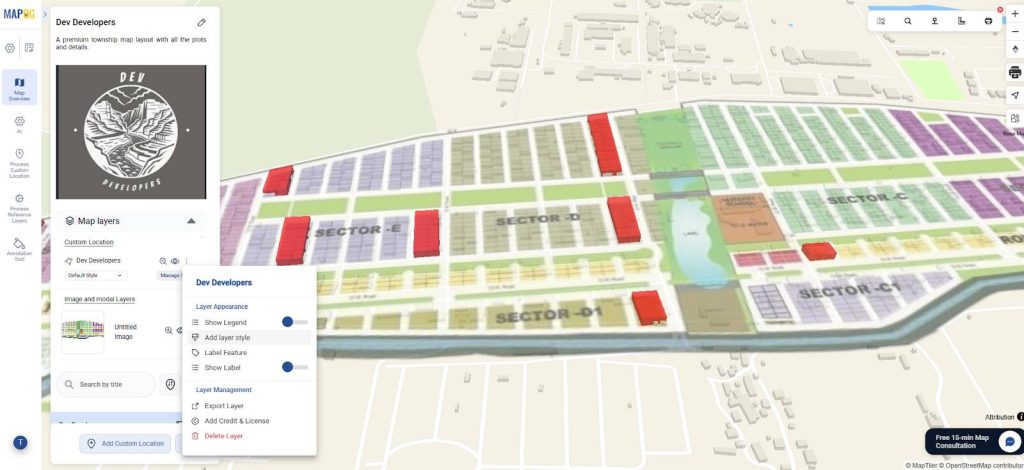
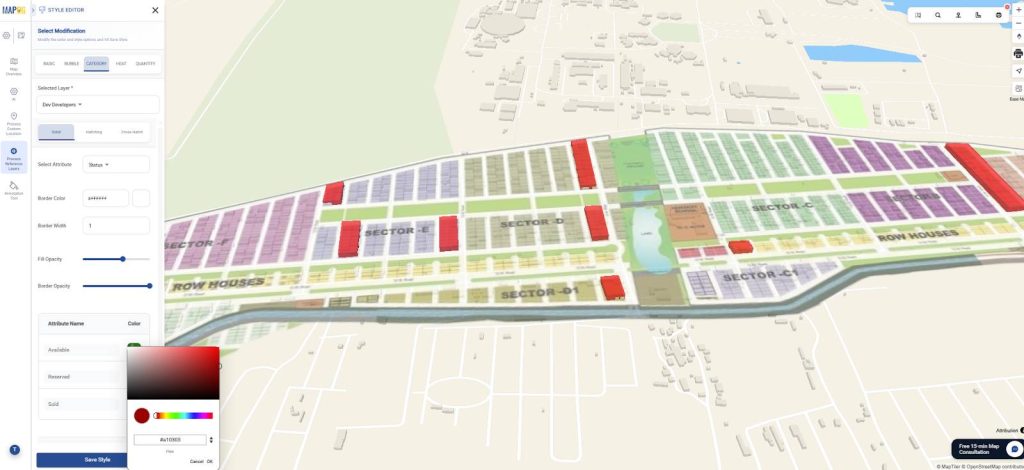
Step 6: Style your plots
Now, to change colours according to category, go to add layer style.
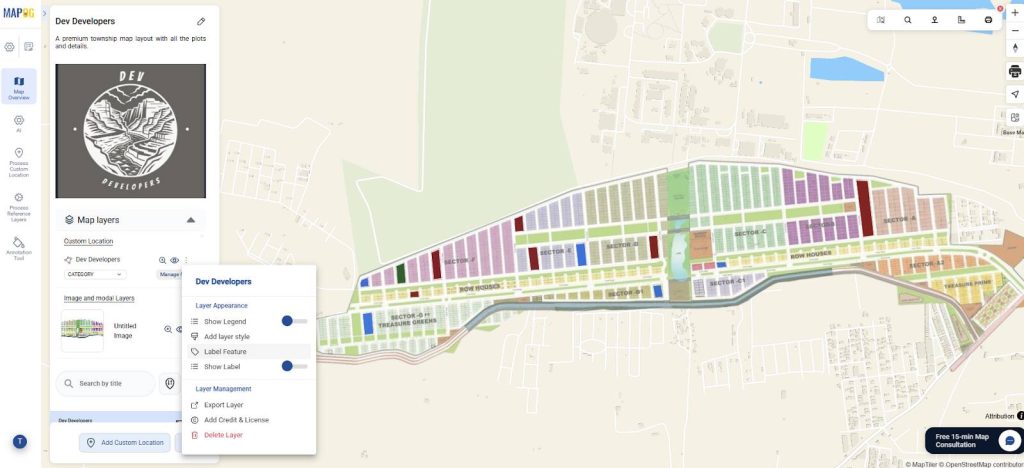
In category style, you can choose suitable attributes, assign a different colour to each and save.
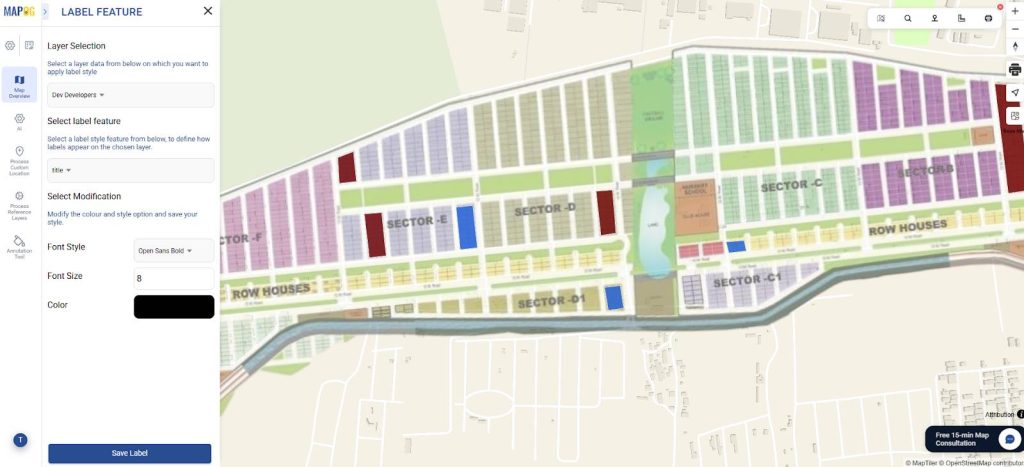
Step 7: Add label feature
Add labels to each plot for instantly identifying them. Go to Label Feature.
Select your preferred attribute, font and size, color and click on save label.
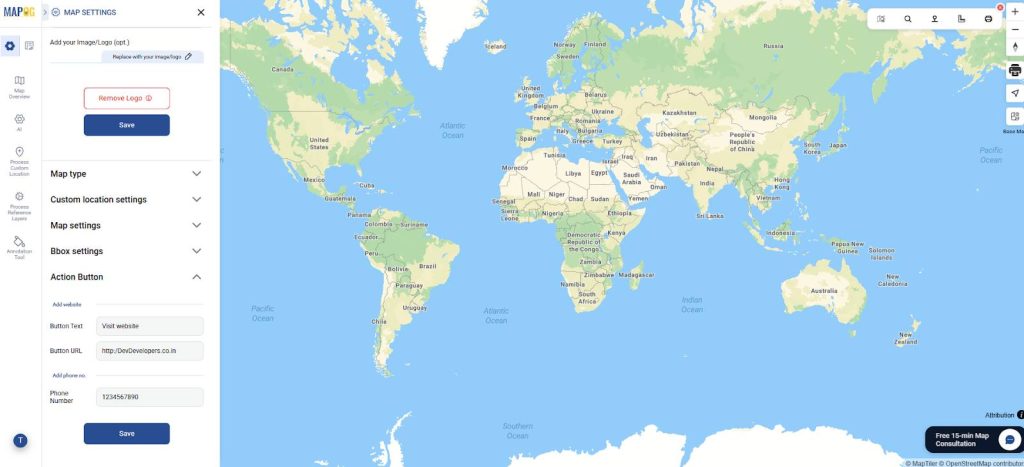
Step 9: Call to action button
To add this button for easy contact by viewers, go to map settings and action button. Here, fill in the text, website URL and phone number, then save. It will show the website link and phone number instantly.
Step 9: Preview & Share
Finally, click on ‘Preview and share’. You can choose map type as private/public.
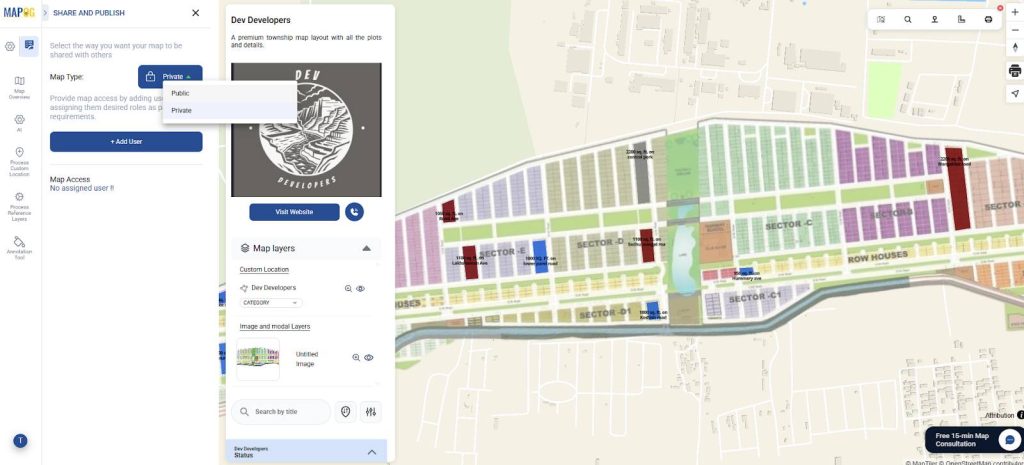
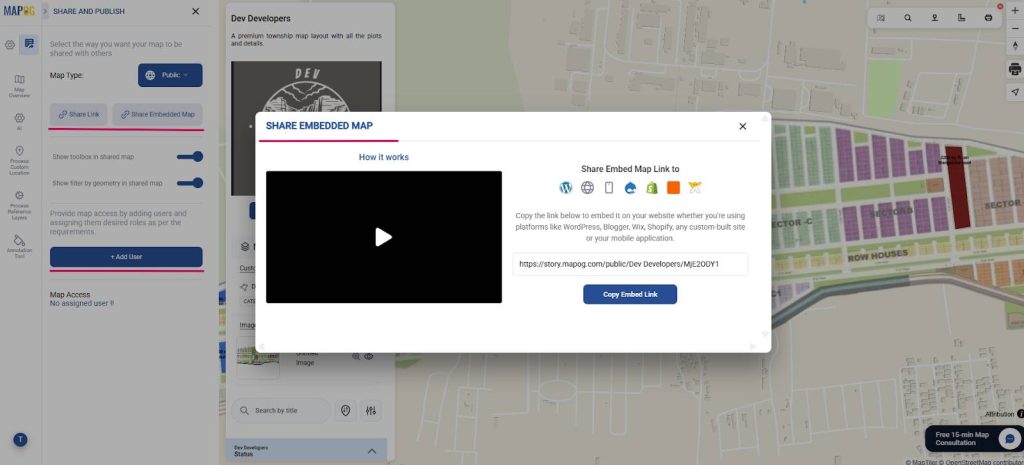
To share the map, you can share map link or embed map link to share it across platforms. Optionally, add users to the map for collaboration purposes.
Industrial Benefits
From an industry perspective, it improves efficiency, accuracy and data organization in land development. Digitally mapped plots allow planners, surveyors and developers to quickly access plot-level information, reduce errors and simplify land management. It also supports better planning in real estate, municipal planning, infrastructure development and agriculture.
Conclusion
Mapping a colony base map with polygon plots transforms raw layouts into organized data. Each plot includes area and land use, supporting accurate planning, efficient management, improved coordination across residential, municipal, infrastructure, and agricultural projects.