In today’s real estate tech landscape, clarity and precision in data visualization are essential for smarter property decisions. Simply listing properties isn’t enough-you need a way to slice, sort, and understand them instantly. That’s where Interactive filters come in. By Filter Properties for Insights based on price range, property type, and availability status, maps become powerful visual tools that reveal real insights.
With MAPOG, developers can layer filters onto a property map to compare options, identify trends, and highlight the listings that matter most to buyers. This focused visualisation enables faster decision-making, cleaner user experiences, and more efficient property discovery-ensuring every search feels intuitive, dynamic, and data-driven.
Key Concepts
Visualizing real estate properties isn’t just about displaying markers on a map-it’s about helping users navigate vast datasets with clarity and purpose. By applying filters such as price range, property type, and availability status, developers allow users to instantly narrow down results and explore relevant listings. Interactive filtering transforms raw property data into clear, meaningful insights.
MAPOG lets developers upload datasets, define custom filter fields, and auto-render dynamic map layers that update in real time as filters change. This approach enables users to compare affordability zones, understand market distribution by property type, and track active vs. sold units. With filter-driven visualization , real estate platforms can improve user engagement, streamline search experiences, and support data-backed decisions for buyers, investors, and agents. Whether building a property portal, sales dashboard, or location intelligence tool, smart filtering ensures every map view reveals exactly what users need-instantly and intuitively.
Steps to Filter Properties for Insights
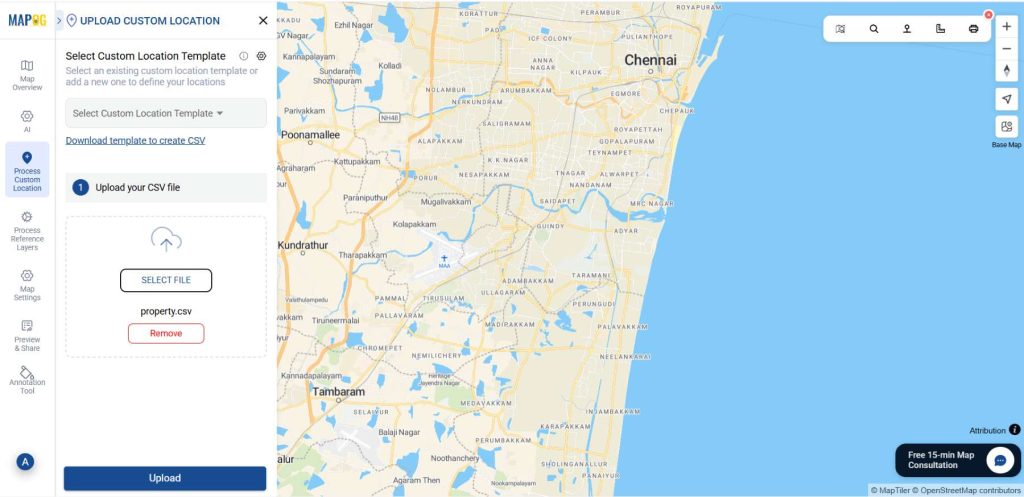
1. Upload property data:
First log into MAPOG & create a map. After that go to Process custom location and select Add by Uploading CSV/Excel. Then select the desired CSV file with attached details.
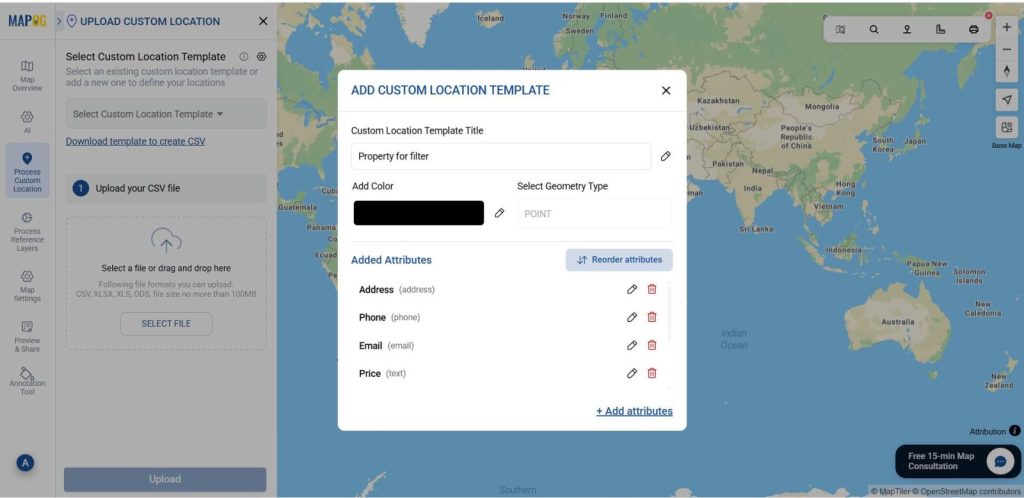
2. Add customer location template:
Then choose Select Custom Location Template and set the location type as “Property for Filter.” Add attributes like address, photos, and other attributes. Then, match your Excel columns. In the field type settings, set Latitude for the first column and Longitude for the second column, then submit.
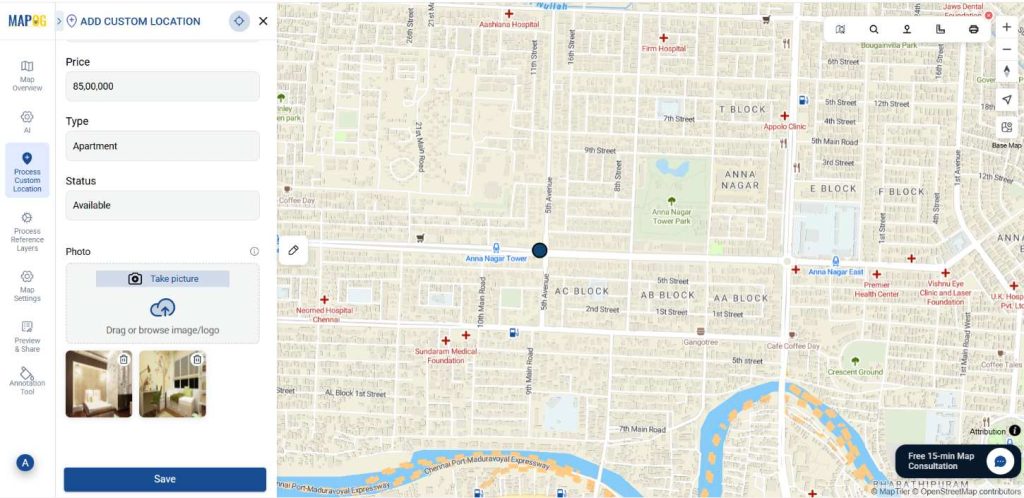
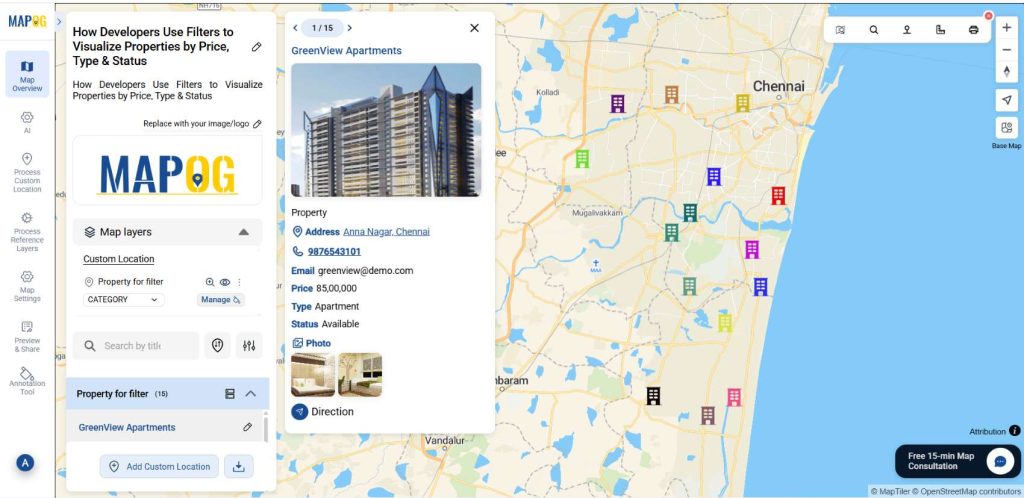
Go to Edit customer point details, then give a suitable image for your point and fill other required attributes then click save.
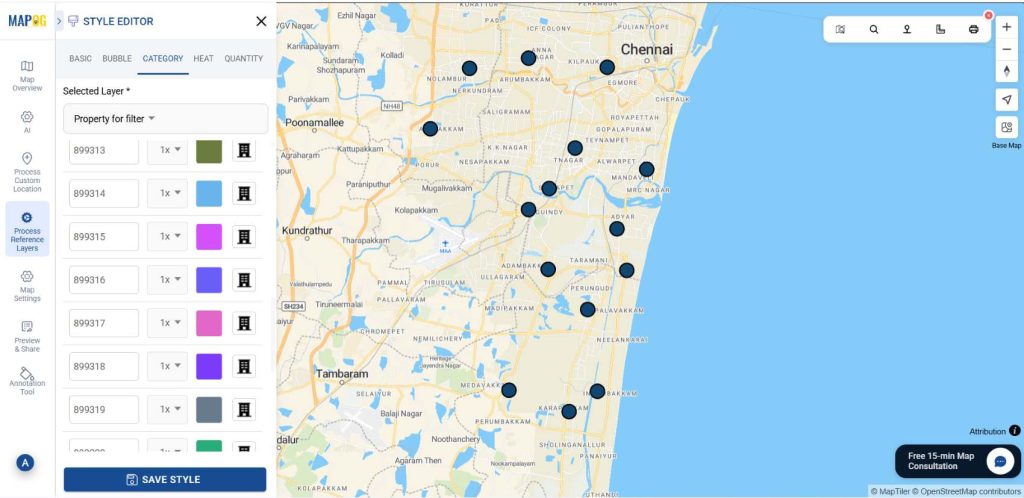
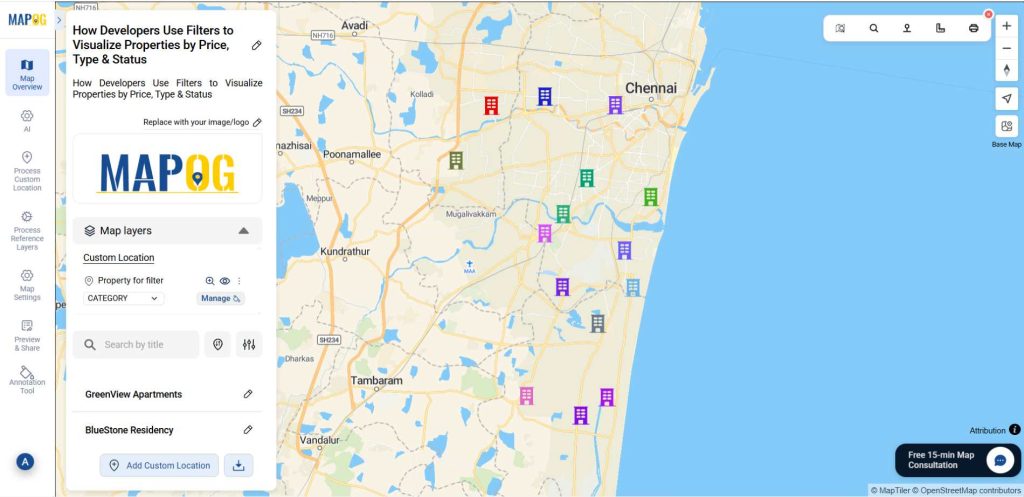
3. Change category:
After uploaded, go to Add Layer Style and select category option, there you can change the point icons.
4. Filter by filter option:
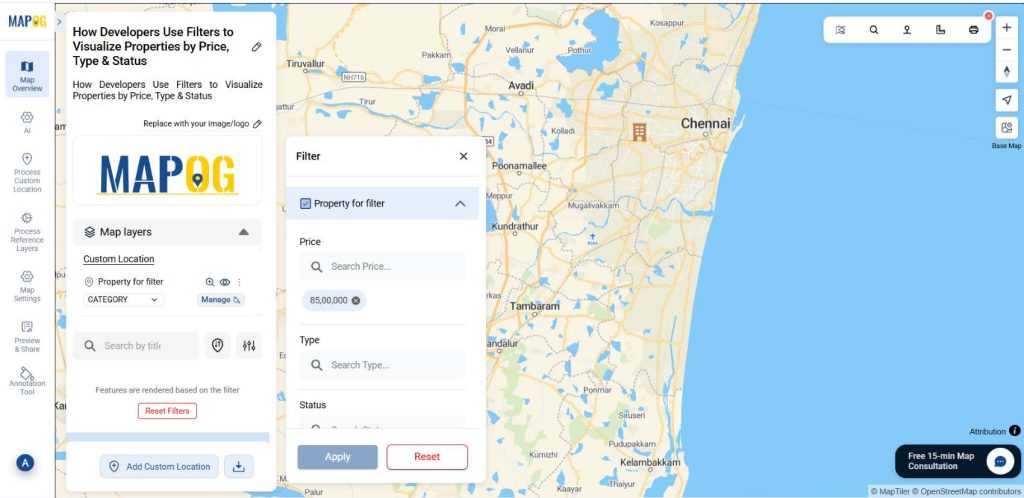
Now go to the filter option, there you can find options such as price, type and status. Then select the layer which you want to filter, then type the price and apply.
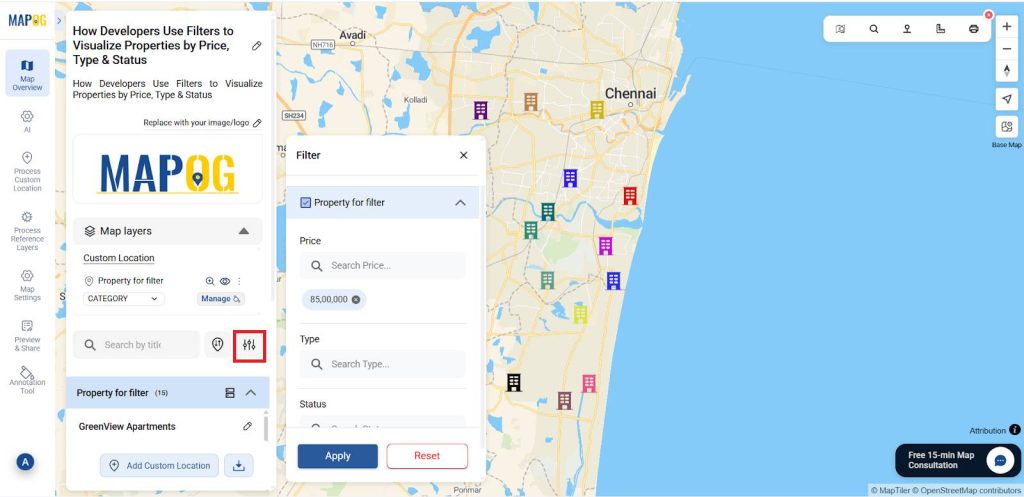
Now all the properties come under the expected price.
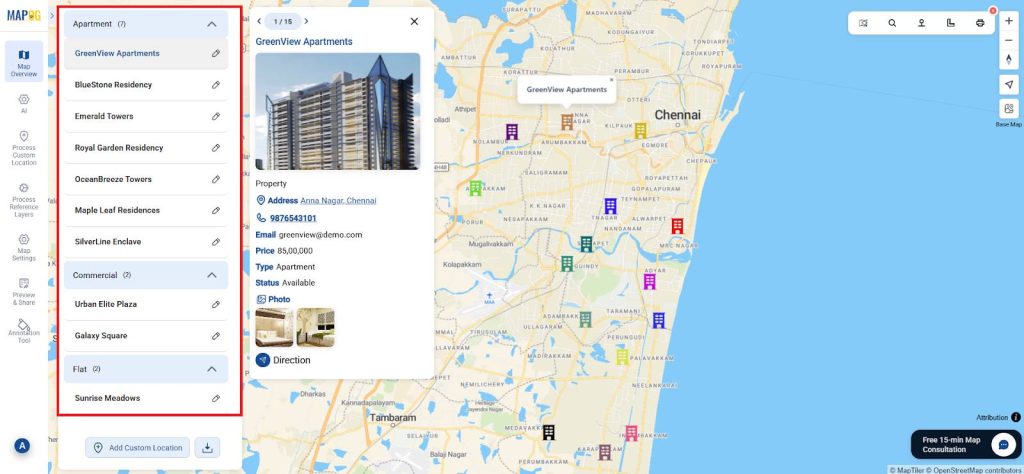
5. Filter by Group By Attributes option:
Then open group by attributes option. After that, In the property for filter select the option which you want to filter.
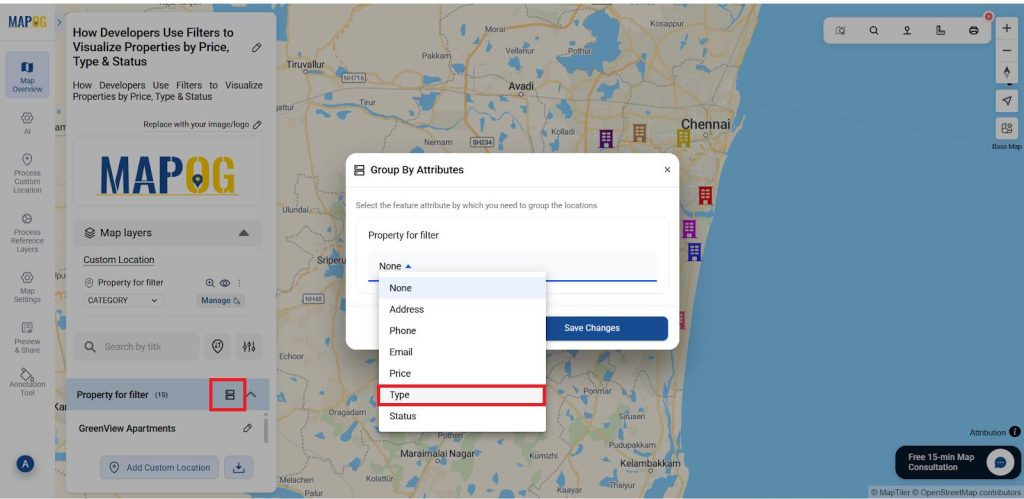
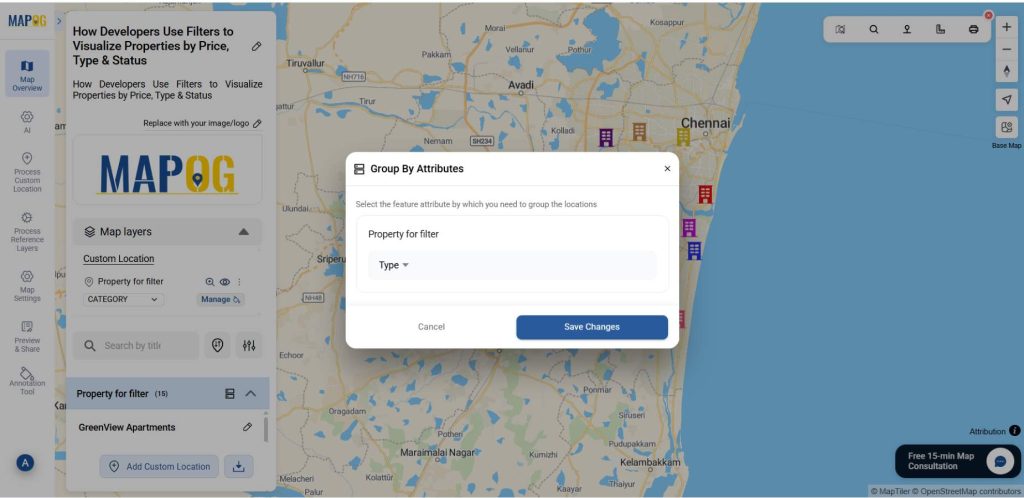
Then, give safe changes, now you can see the properties filtered into apartment, commercial, flat, house and villa.
Applications of Filter Properties for Insights
- Real Estate Platforms: Allow users to instantly narrow down properties based on budget, category, and availability. Additionally, filters make navigation faster and more personalized.
- Property Developers: Analyze market demand by comparing property types and price segments across locations. Furthermore, these insights help refine project planning.
- Brokerage Firms: Quickly highlight active, sold, or upcoming listings to streamline client presentations. As a result, clients understand market activity more clearly.
- Housing Portals: Enhance user experience with dynamic filtering that makes search faster and more intuitive. In turn, this boosts engagement and user satisfaction.
- Investment Teams: Identify high-value investment zones by filtering properties with strong price-performance indicators. Consequently, teams can make smarter, data-backed investment decisions.
Conclusion:
Filtering properties by price, type, and status becomes effortless and insightful with MAPOG. By transforming complex real estate datasets into interactive map views, developers can help users instantly narrow listings, compare market segments, and understand property trends at a glance. Moreover, this data-driven visualisation ensures a smoother search experience, smarter decision-making, and stronger user engagement. With MAPOG’s dynamic filtering tools, every property map becomes a powerful guide-turning raw data into clear, actionable real estate intelligence.
Here are topics related to this topic: