Turning your trip plan into something visual, organized, and interactive is no longer complicated. Instead of juggling notes, screenshots, and lists, a smart travel map helps your journey unfold day by day on a single canvas. With MAPOG and its powerful Annotation features, trip planning is not only simplified but also made visually engaging. As a result, destinations, routes, and memories stay connected—and clearly visible—from start to finish.
Understanding the Key Concept: Turning Your Trip Plan into a Visual Story
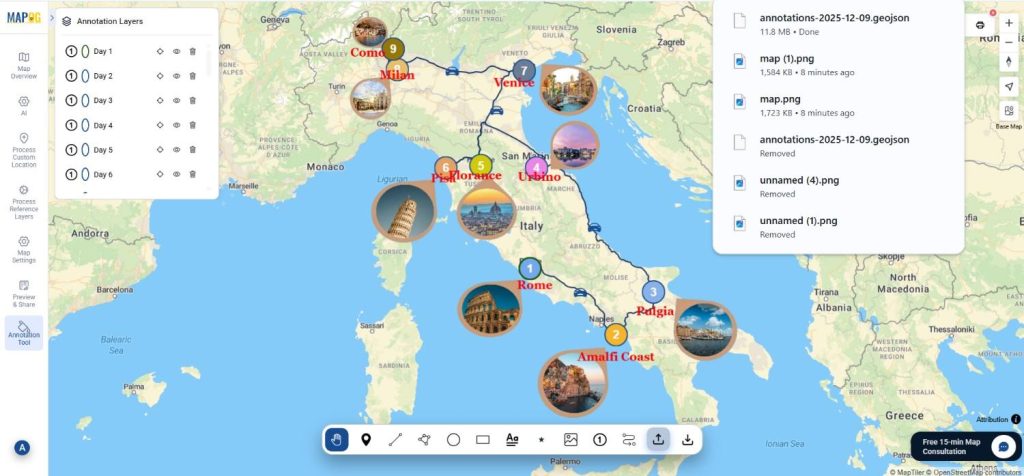
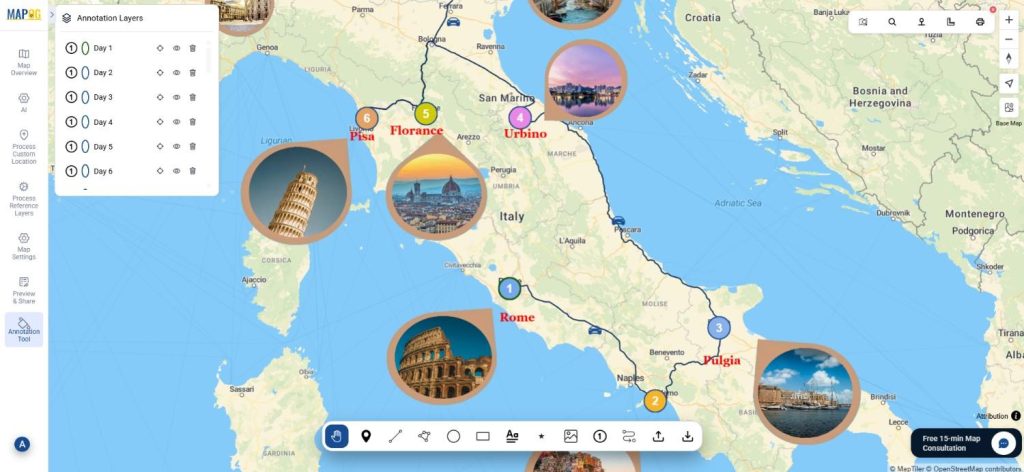
Turning Your Trip Plan into a smart travel map means transforming ideas into mapped experiences. For example, a 9-day Italy road trip can show daily stops, driving routes, and photos layered directly on the map. Consequently, planning becomes clearer, while sharing becomes effortless. MAPOG supports this approach by combining annotations, routes, images, and labels within one interactive interface.
Step-by-Step Process to Turning Your Trip Plan into a Smart Travel Map
Step 1: Project Setup for Turning Your Trip Plan
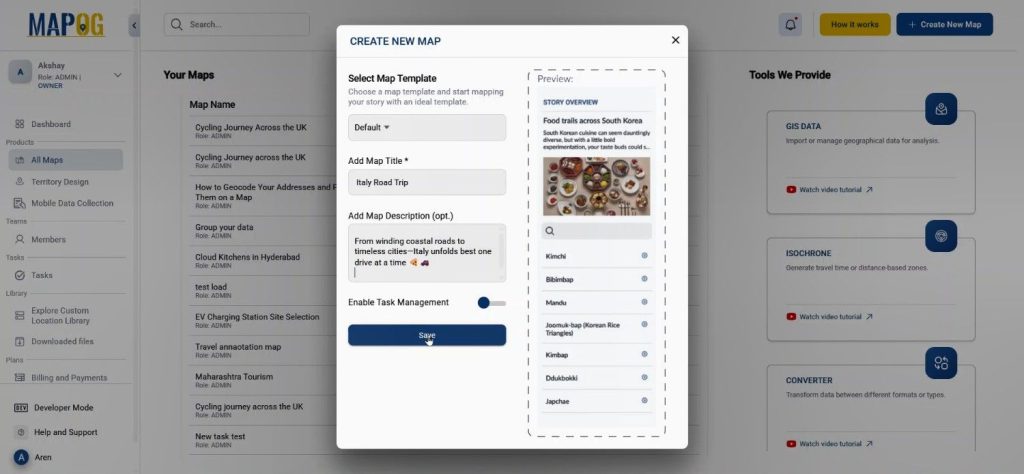
After visiting MAPOG, you create a new project by setting a title, description, and cover image before saving it. This initial setup ensures Turning Your Trip Plan starts with context and clarity.
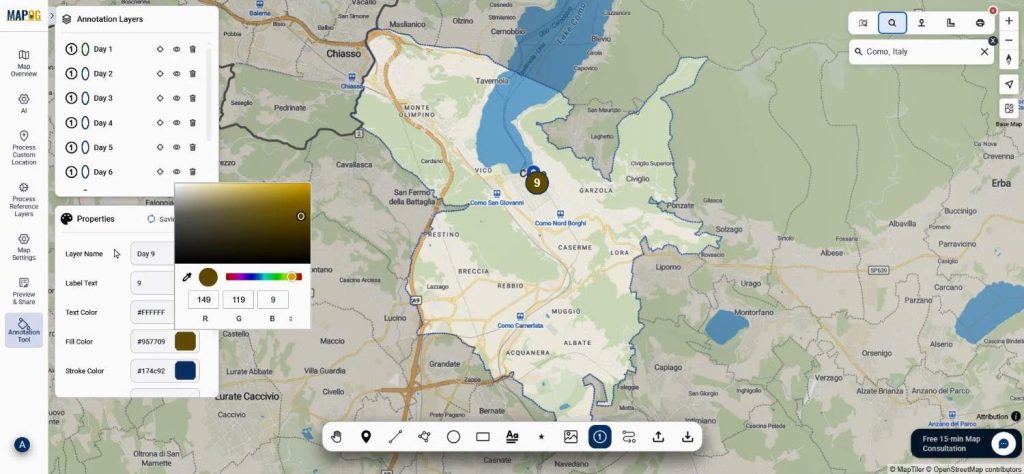
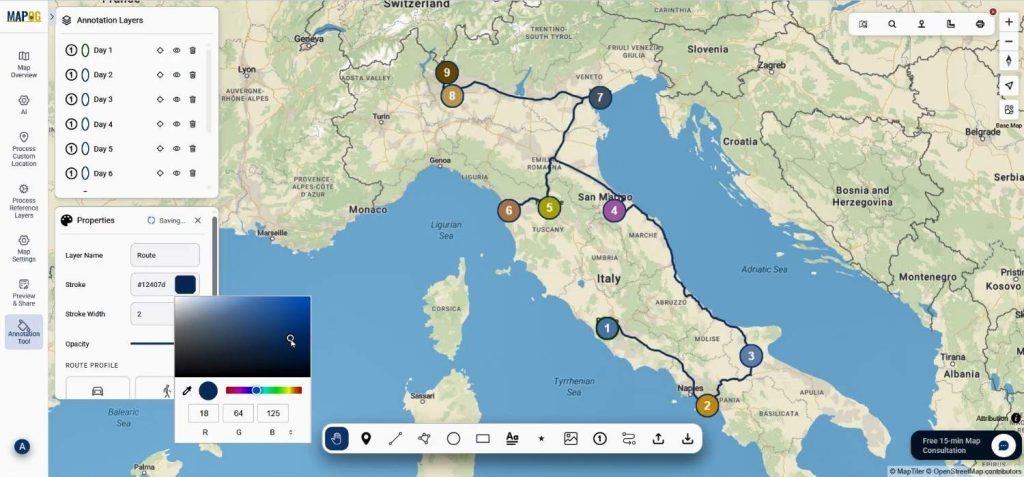
Step 2: Plotting Locations with Annotations
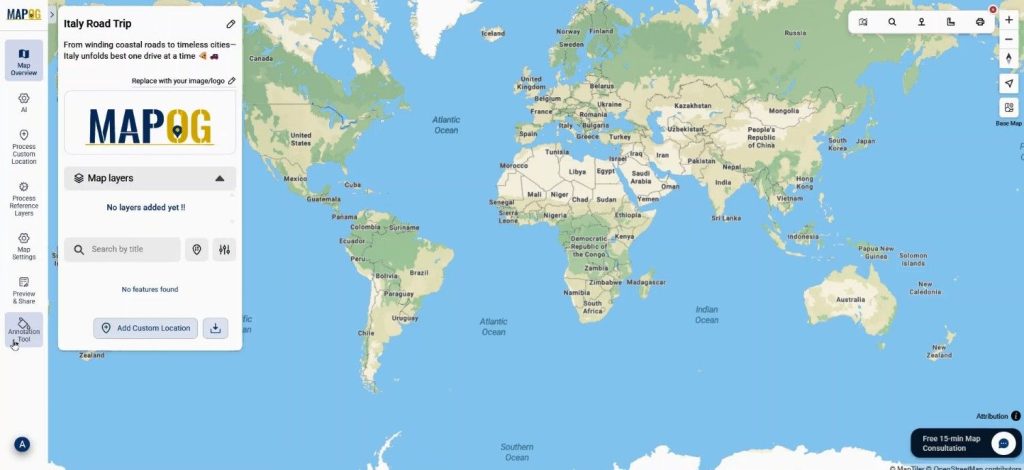
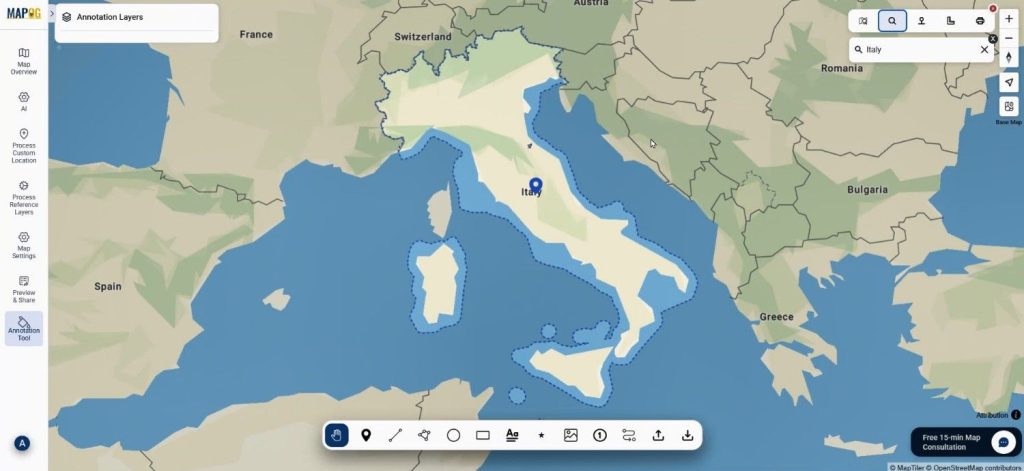
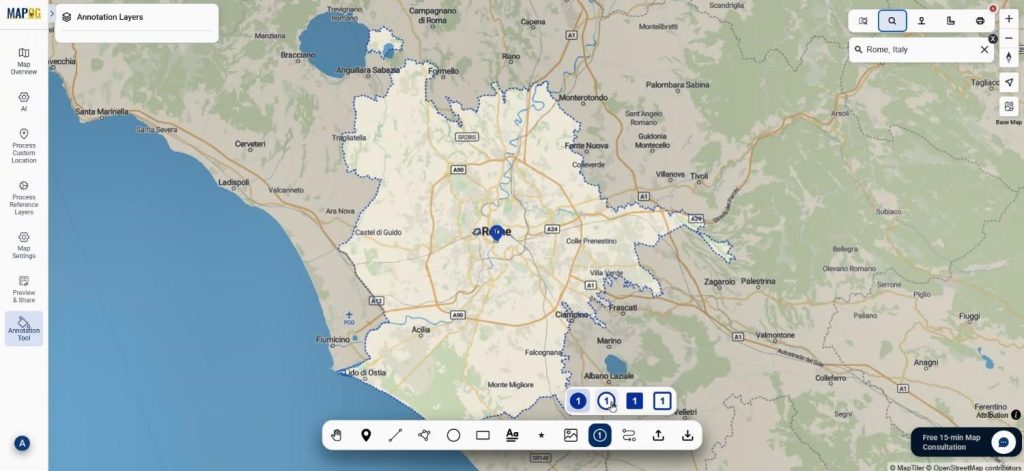
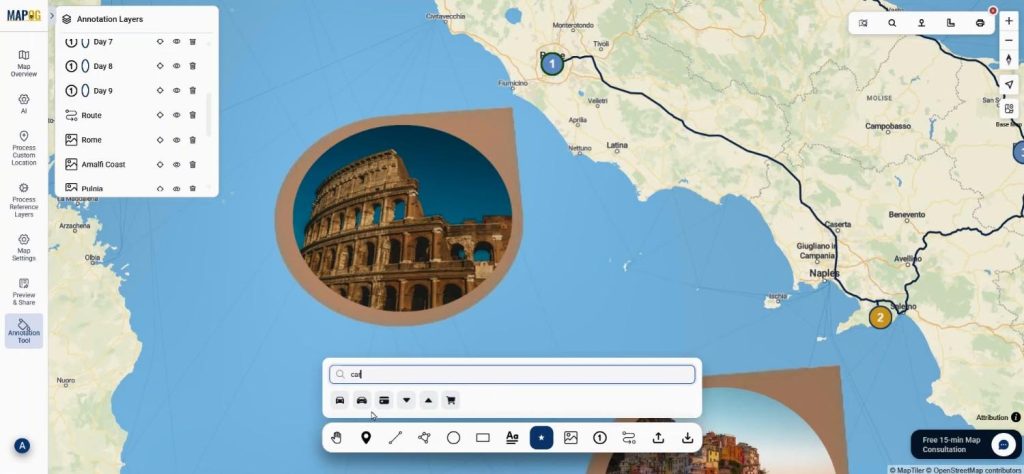
Next, you use the Annotation tool from the map interface to begin plotting the trip.
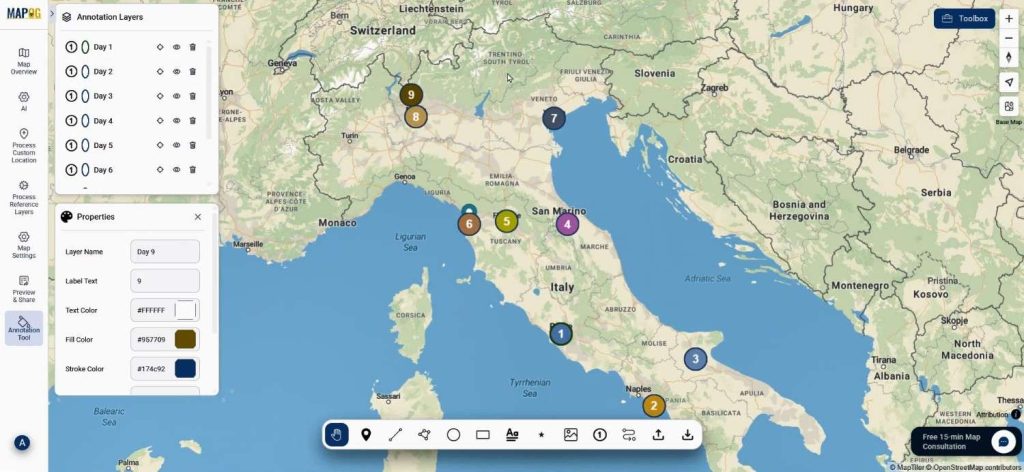
You search locations by address or precise coordinates from the toolbox.
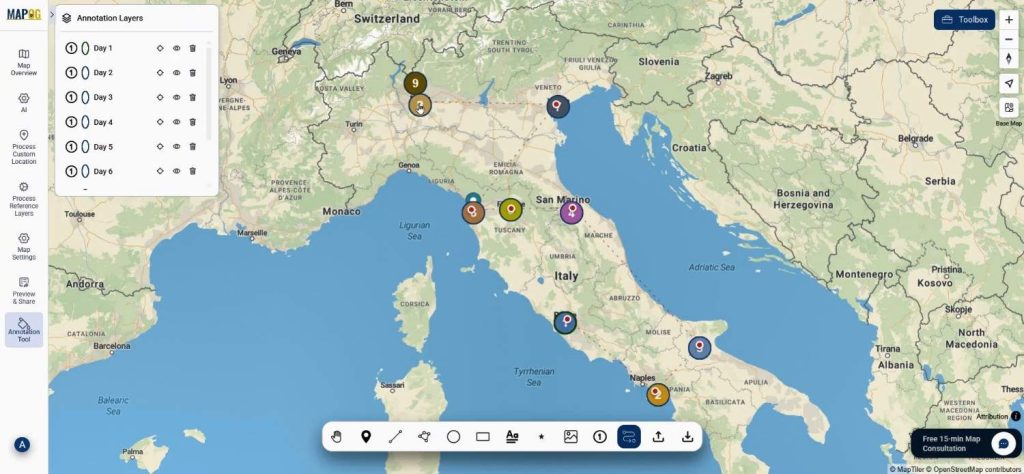
Using category symbols from four patterns, you mark each point with a day number.
Moreover, you adjust layer names, colors, and symbols to reflect daily plans clearly.
Step 3: Organizing Days and Categories
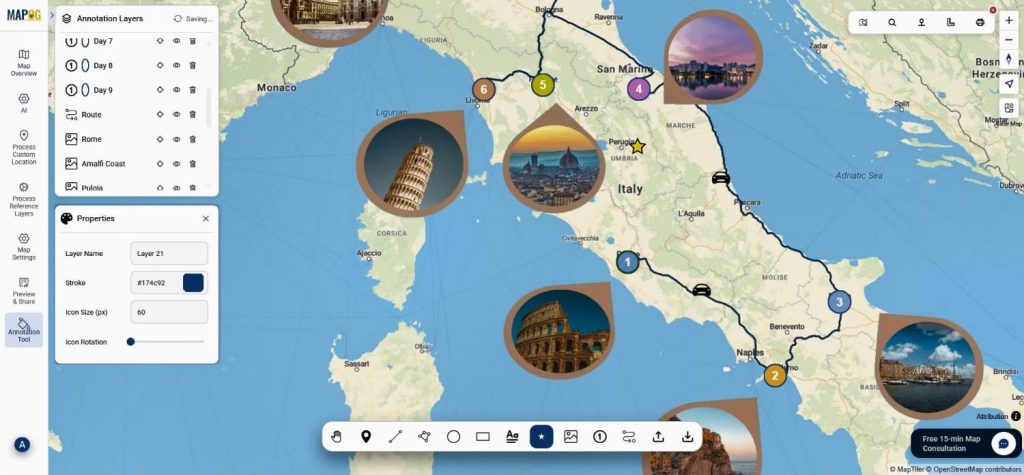
As Turning Your Trip Plan develops, you thoughtfully layer points for each day. For instance, Day 1 sightseeing spots may use one color, while Day 2 uses another. This visual separation, therefore, reduces confusion and improves readability across complex itineraries.
Step 4: Connecting Routes Seamlessly
Then, you select the route option to connect all plotted locations.
Whether driving or walking, you choose the preferred route mode using the route profile.
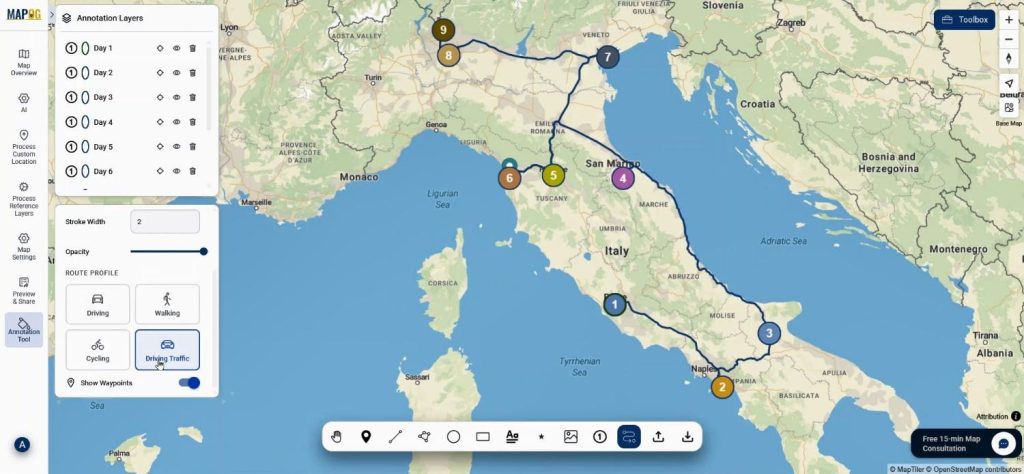
you can even edit the properties of the routes like name, opacity etc.
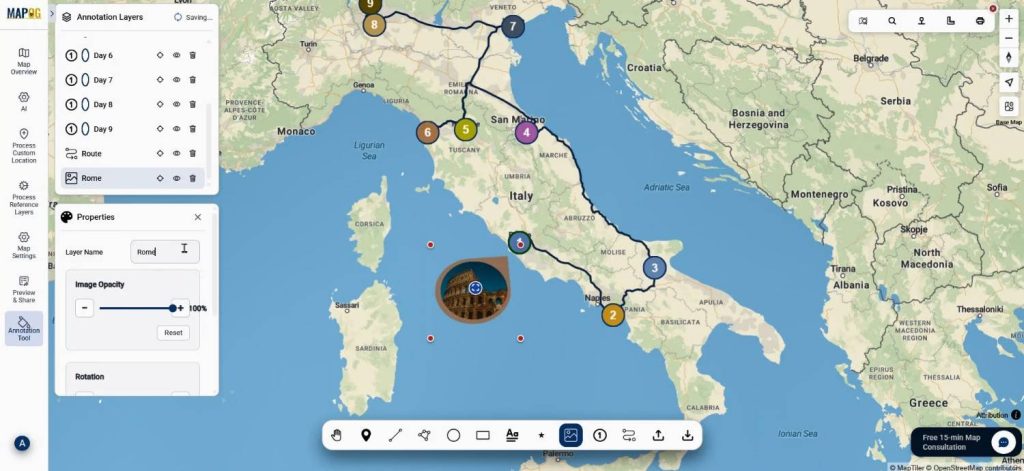
Step 5: Enhancing with Images
To bring Turning Your Trip Plan to life, you upload images directly onto map locations. Browse your images & upload them.
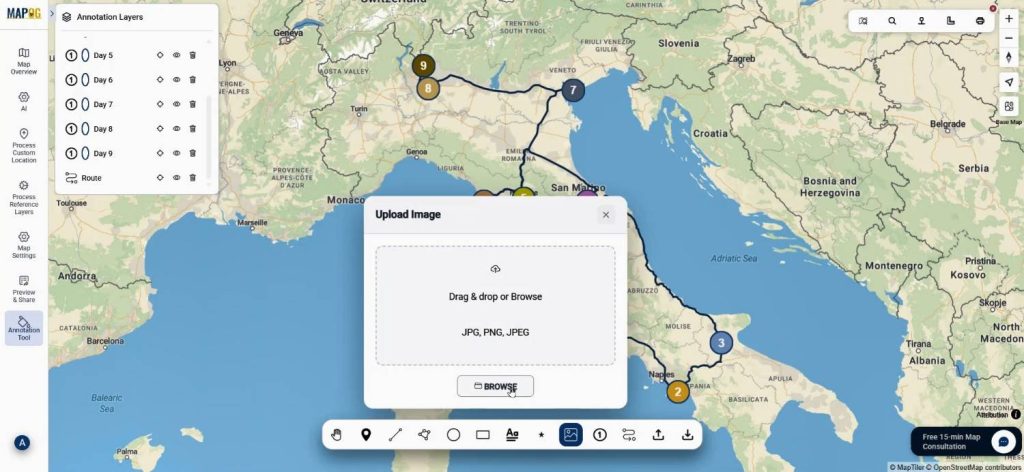
Draw area to place the images.
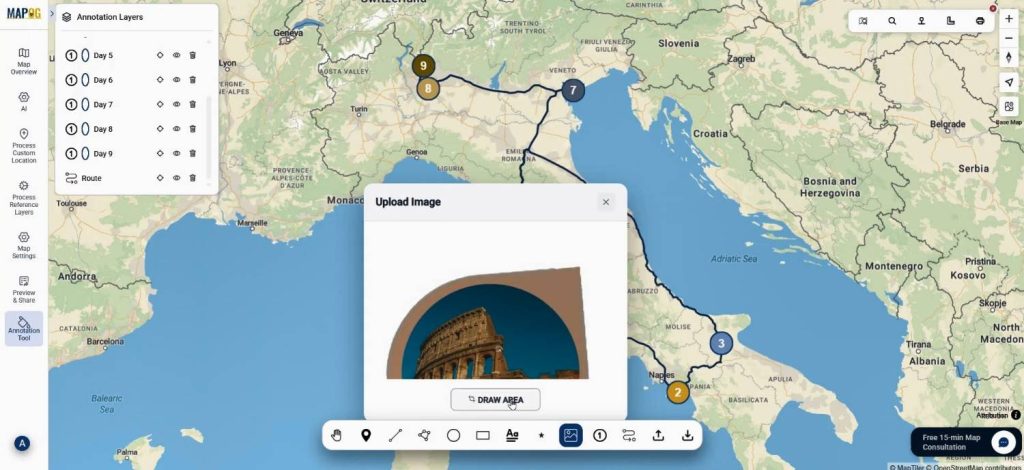
These visuals allow you to resize, rotate, or adjust opacity using the select option. As a result, each destination tells its own story visually.
and you add symbols at suitable points. Choose proper symbol through icons option.
Place them on proper place. Consequently, distances and travel flow become instantly understandable.
Step 6: Adding Labels and Exporting
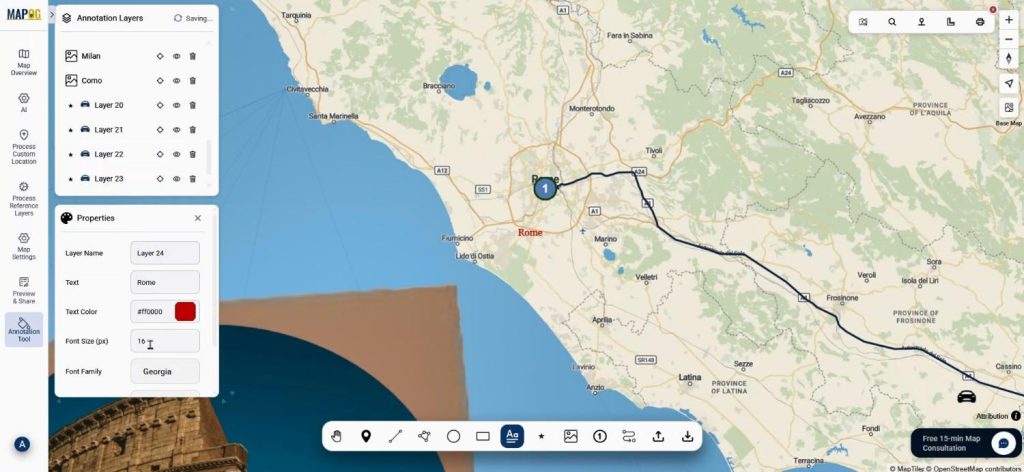
Finally, you drop labels using the label option to name places or highlight notes.
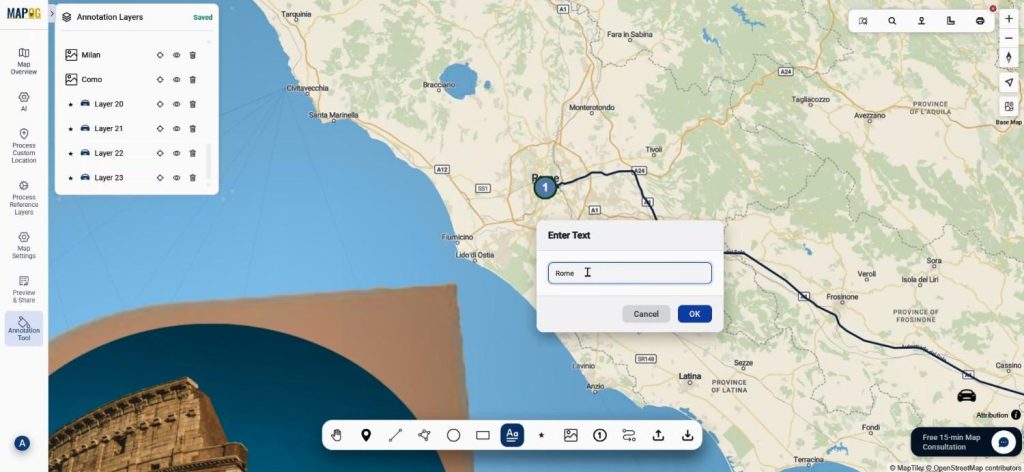
Text color, size, and font style are easily customized.
Once everything is refined, the map is exported in GeoJSON format for further GIS use or sharing.
Industry Uses and Key Benefits
Turning Your Trip Plan into a smart travel map is valuable beyond personal travel. Travel bloggers can showcase itineraries, tourism planners can visualize routes, and educators can demonstrate geography-based journeys. Since MAPOG supports data export and detailed annotations, it fits seamlessly into broader GIS workflows.
Conclusion
Turning Your Trip Plan into a smart travel map brings clarity, creativity, and structure together. By using MAPOG’s Annotation, routing, and export features, trips are visualized rather than imagined. Explore how mapping your next journey can streamline planning and enrich storytelling.