Working with address data in Excel or CSV is common, but understanding that data becomes much easier when you can see it on a map. Whether you’re managing customer locations, store outlets, survey responses, or delivery points, visualizing them geographically helps you uncover patterns, plan better, and make faster decisions. This is why many users now look for simple ways to convert Excel or CSV addresses into a map for quick visual insights.
Today, you don’t need advanced GIS tools or any coding knowledge to do this. With MAPOG, you can upload your Excel or CSV file and instantly convert your address data into an interactive map in just a few clicks.
Key Concepts for converting Excel and CSV addresses into a map
Converting Excel or CSV addresses into a map involves key concepts such as geocoding, which converts written addresses into precise latitude and longitude coordinates for accurate spatial representation. Clean and well-structured data ensures that each location is mapped correctly without errors or misplacement.
Using no-code mapping tools, users can easily upload data and generate interactive maps without technical complexity. Visualization techniques like filtering and heatmaps enhance visual clarity, while secure sharing options allow the mapped information to be used collaboratively for informed, location-based decision-making.
Step by Step Guide on how to convert Excel or CSV addresses into a map
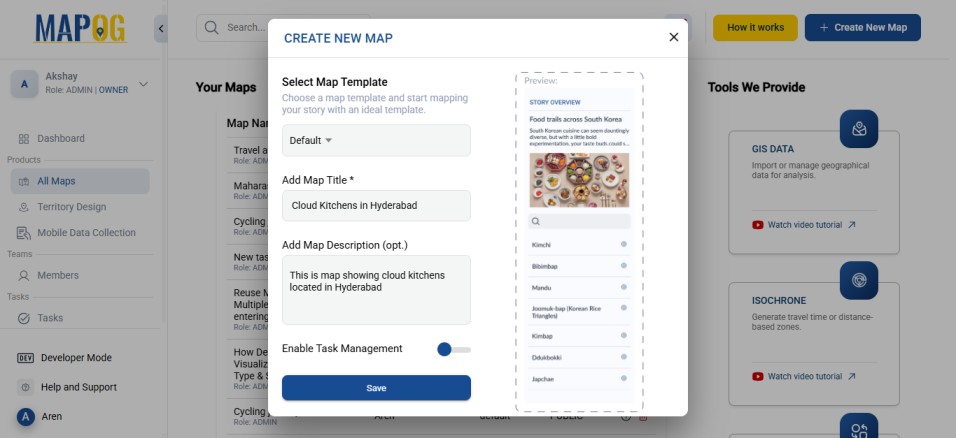
1. Start with a New Map
Open MAPOG and click on “Create New Map”, give your project a title and a brief description, then hit save.
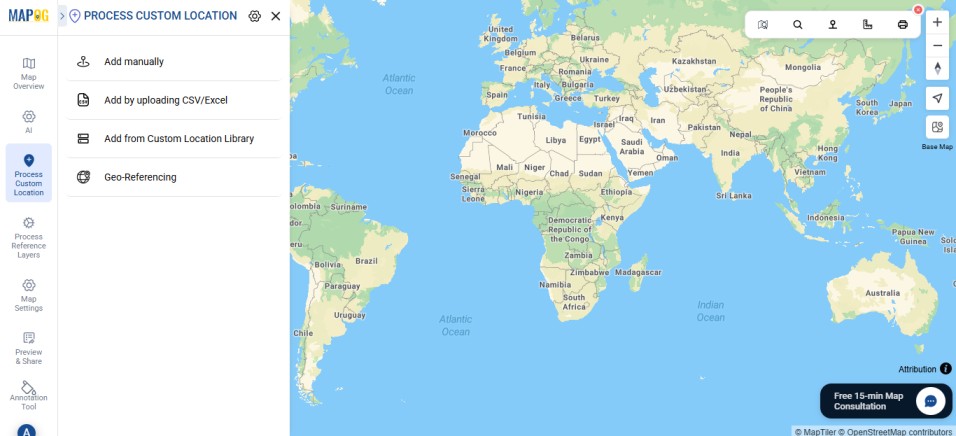
2. Add coordinates using an Excel or CSV file
Go to Process Custom Location and then select “Add by uploading CSV/Excel”.
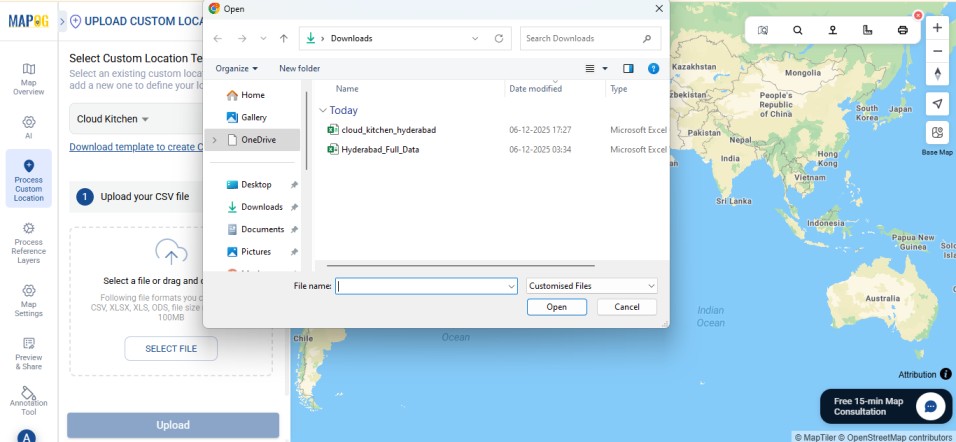
And then upload your desired Excel file.
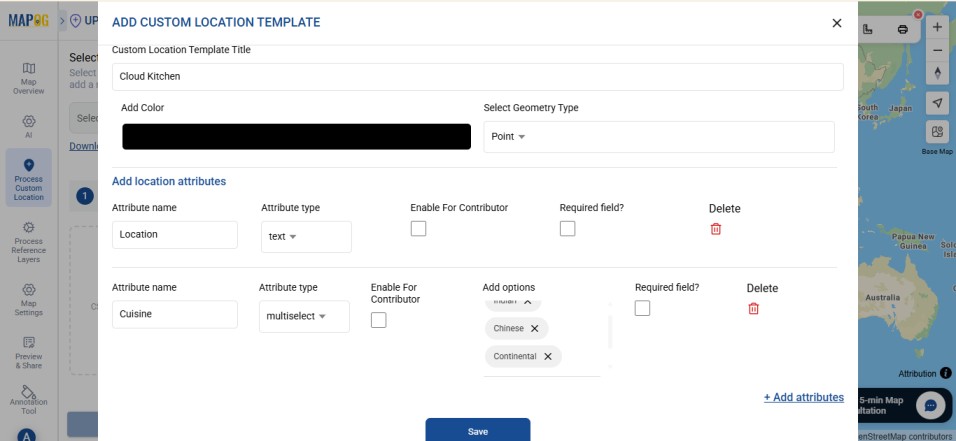
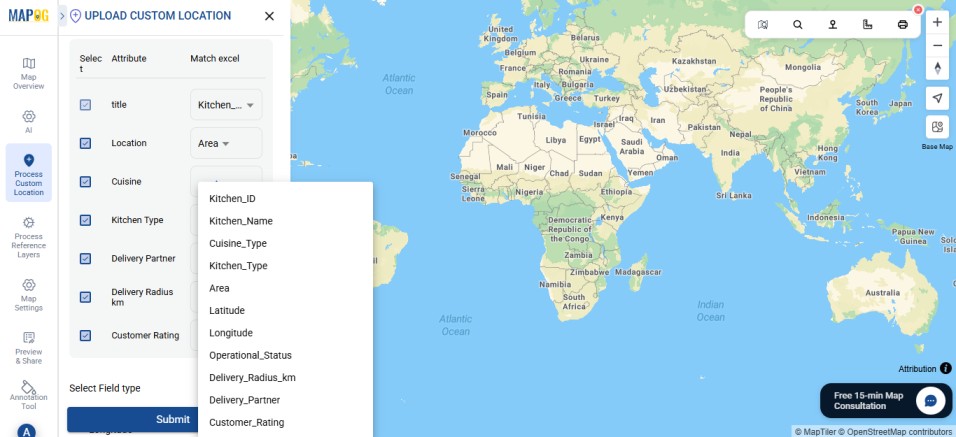
Go to Select Custom Location Template settings option, add custom location template, such as Cloud Kitchen, as here we use a dataset pertaining to it. Then input necessary attributes such as the Location, Cuisine, etc.
Then, match your Excel columns with the corresponding attributes.
Select the field type as Geocoding. First, select the country to which the address belongs. Then, match the address field with the columns that contain all the required address details to form a complete address.
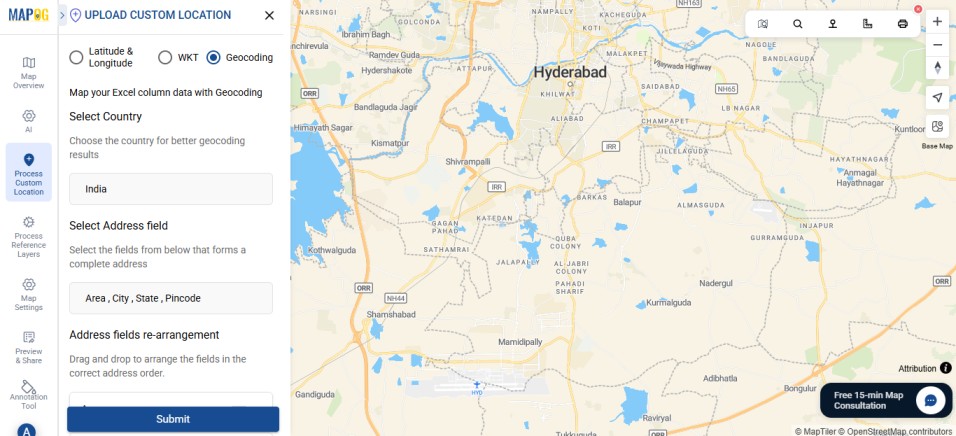
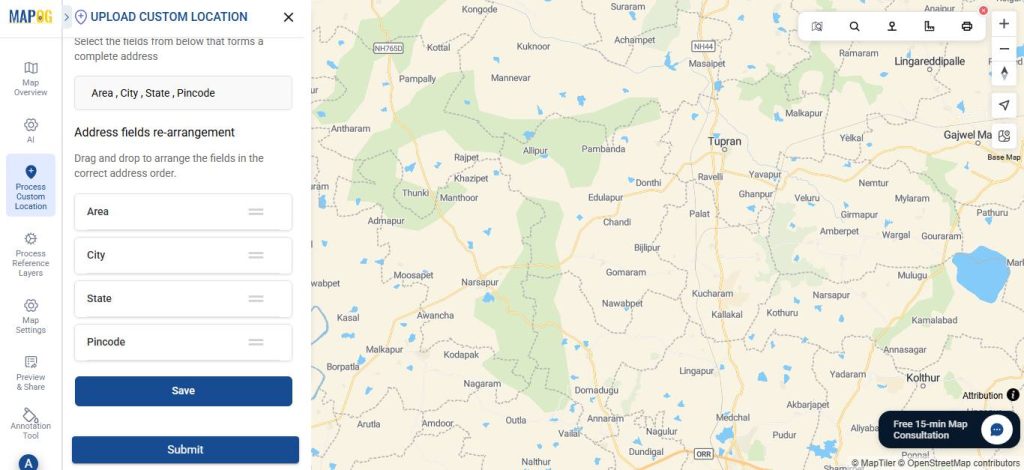
You can also reorder the selected columns to ensure the address is formed correctly without any discrepancies. After that, click Submit.
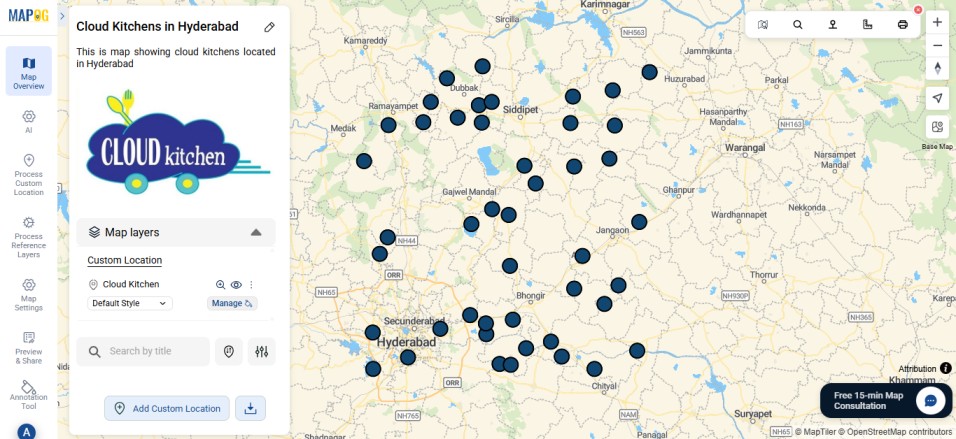
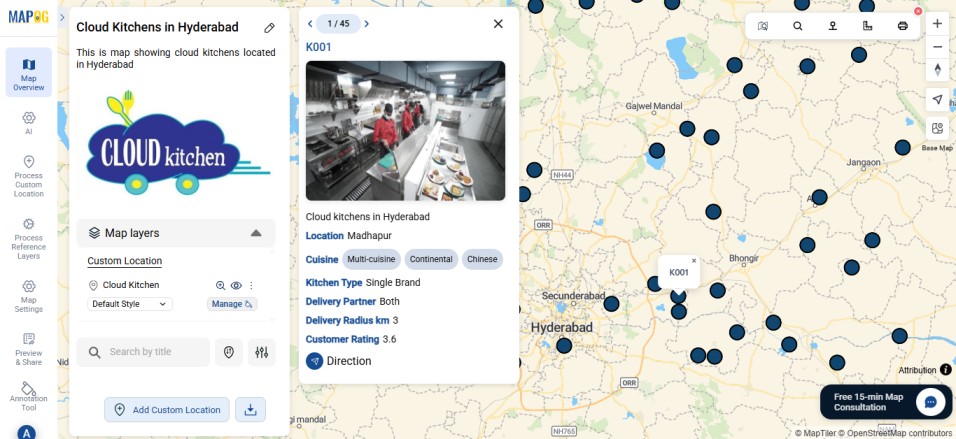
Your points will now appear on the map.
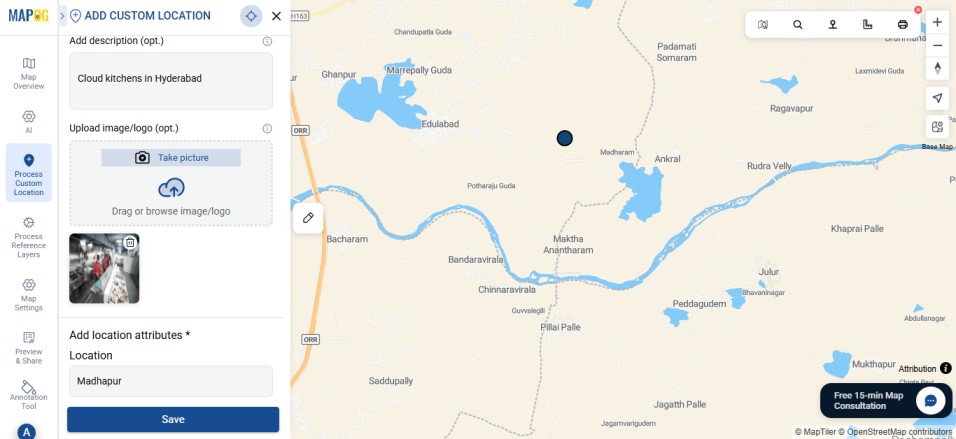
3. Editing the points
Go to Edit point details. Next, upload relevant image for your point to complete the necessary attributes, then click Save.
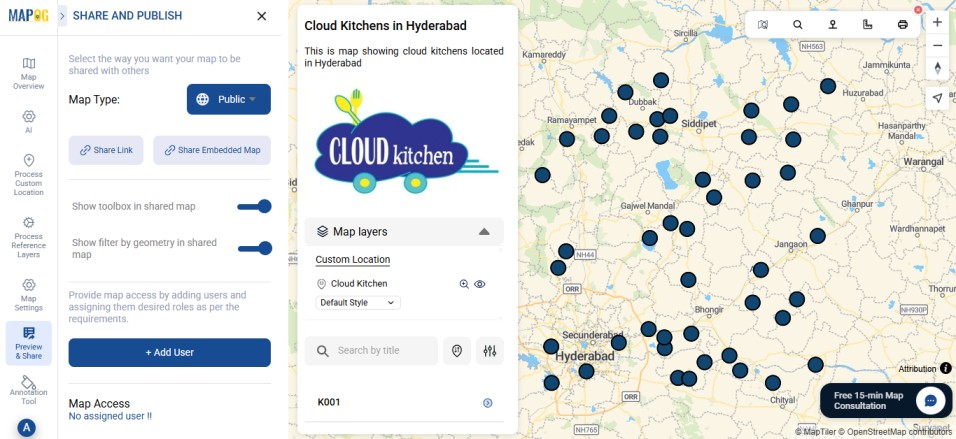
4. Share Your Map
Once your map is ready, click “Preview and Share”. You can also set your map to Public for wider visibility or share it using the Share Link option.
Real World Applications
Mapping Excel or CSV address data is widely used across real-world applications such as retail planning, delivery logistics, urban management, and survey analysis. Businesses use mapped customer and store locations to identify high-demand areas and optimize service coverage, while logistics teams rely on location maps for route planning and faster deliveries.
In public sectors, mapping helps visualize health centers, schools, utilities, and infrastructure, supporting better planning and resource allocation. Researchers and field teams use mapped survey data to detect spatial trends, clusters, and gaps, making location-based insights clearer and more actionable.
Conclusion
In conclusion, converting Excel or CSV addresses into a map transforms simple tabular data into meaningful spatial insights. By applying geocoding, proper data preparation, and effective visualization techniques, users can create accurate and interactive maps with ease.
MAPOG make this process even simpler, allowing anyone to upload data and generate maps without technical expertise. These maps not only improve understanding of location-based patterns but also support smarter planning, efficient operations, and informed decision-making across a wide range of real-world applications.
Here are some other blogs you might be interested in:
- Using Geospatial Filters to Simplify Your Map
- Add Contact Details and Customer Notes Directly on the Map with Location Points
- How to Draw 3D Buildings on a Live or Dynamic Map
- Creating 3D Building Maps for Your Real Estate Project