Ever wondered which areas your customers come from or where your business is growing the fastest? Visualizing customer locations on a map can turn raw data into clear, actionable insights. With MAPOG, you can easily map and view your customers by state, city, or region, giving you instant insights into geographic trends and market potential. Instead of spreadsheets, you’ll see a dynamic map that helps you plan smarter marketing strategies, allocate resources efficiently, and uncover new opportunities for growth.
Key concept of the map
The key concept behind the map is turning data into visual understanding. Instead of looking at rows of numbers, you see real geographic patterns — clusters of loyal customers, untapped regions, and trends that guide smarter decisions. A map makes complex data intuitive, helping you see your business from a whole new perspective. You can easily plot your customers by state, city, or area, thus transforming your data into an interactive visualization that highlights your key markets and growth opportunities.
Step-by-step method of creating the map
Step 1 : Create the map
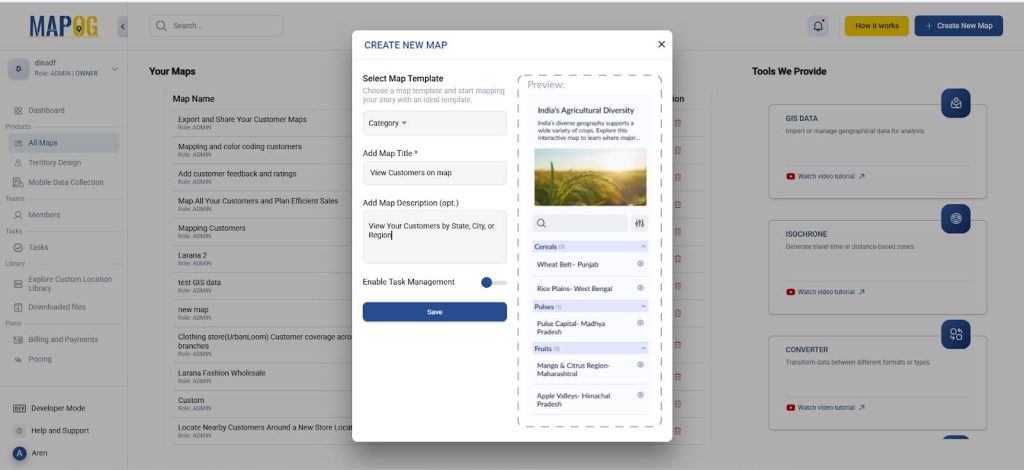
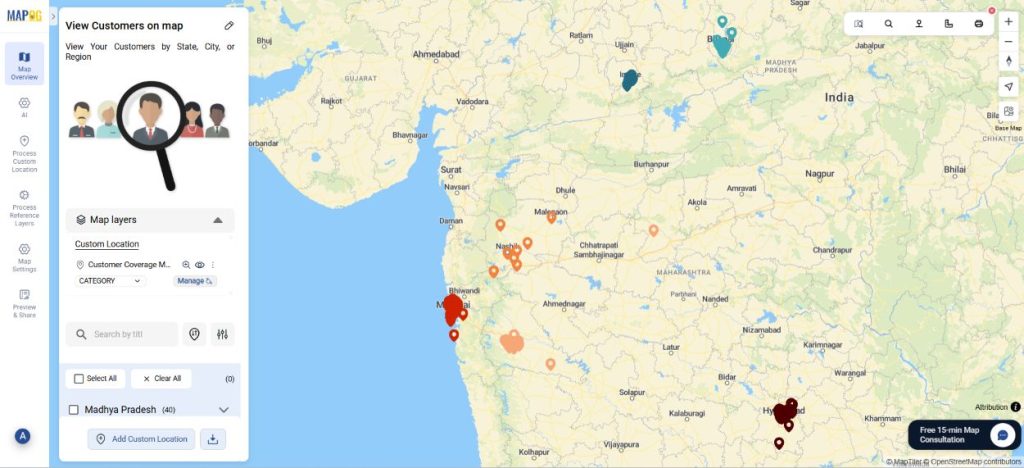
Go to MAPOG and create a new map. Select the story template as ‘Category’ and add story title and description and save.
Step 2 : Uploading your data and adding attributes
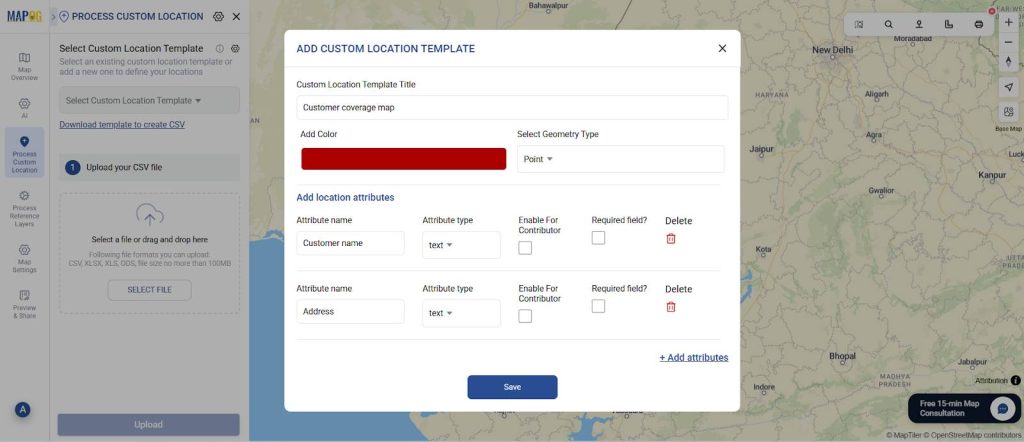
Afterwards, go to process custom location and select add by uploading excel/CSV. Go to ‘Select Custom Location Template’ settings and add your custom location template along with necessary attributes like customer name, address, pin code, etc. Select the custom location template that you created and select your excel file with all the details and upload.
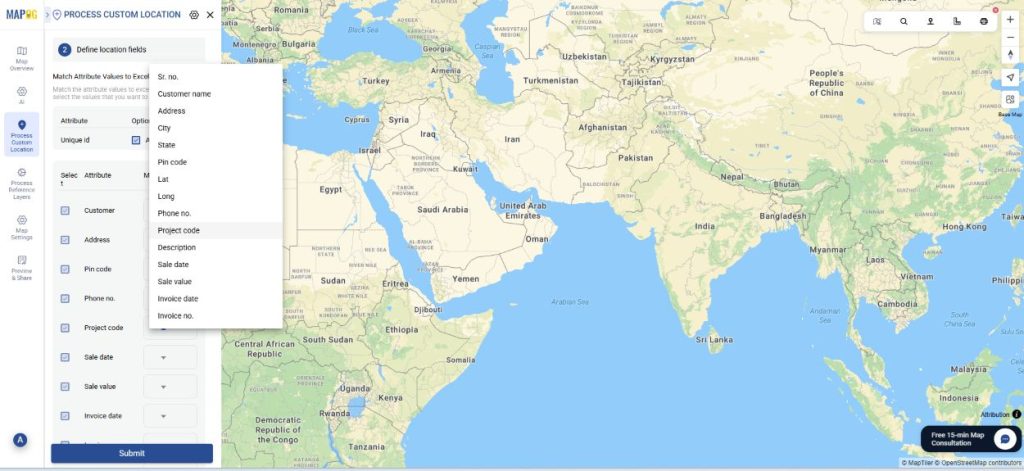
Now, match excel with the attributes including coordinates in location fields and submit. Your data will now come alive on the map.
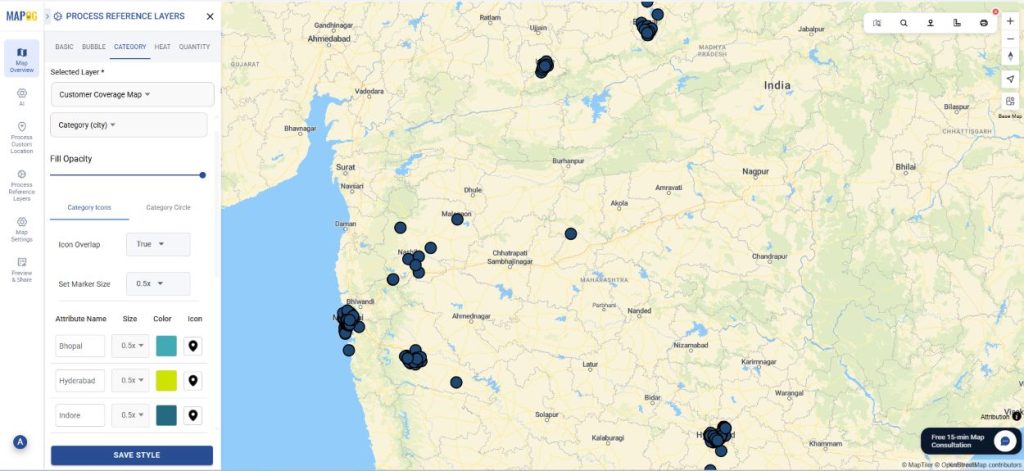
Step 3: Style the customer points by category
Further, style your customer points differently based on the city in which they are present. After that, go to ‘add style layer’ and style by category.
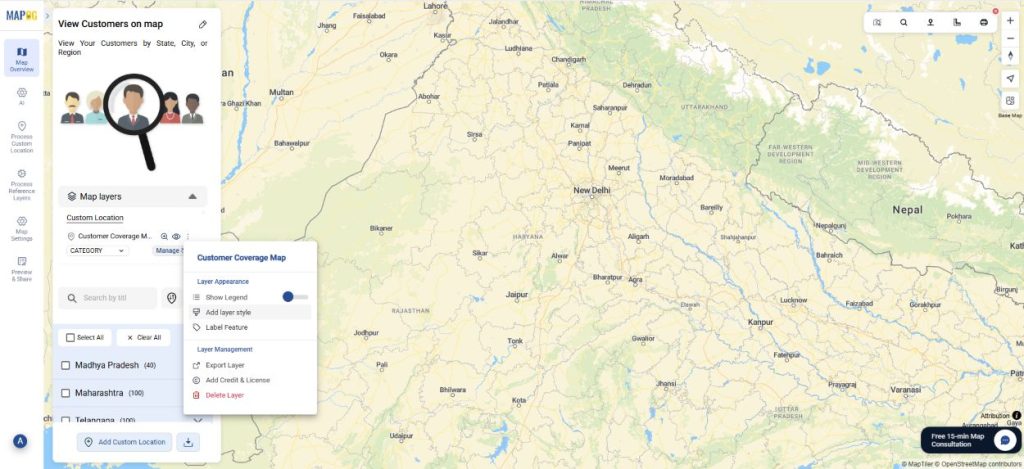
In the category style, choose the attribute you want to categorize on the basis of like city or state. Then, select the colours in a manner where you can easily differentiate based on the city or region. For example, you can choose shades of green for cities in the same state. Thus, you can view the customers of different regions with ease. Finally, choose the appropriate icon and press ‘save style’.
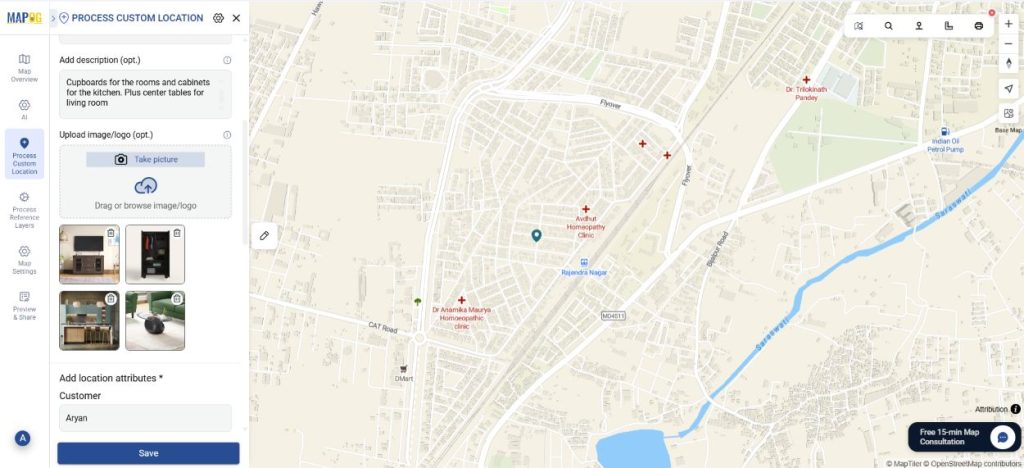
Step 4: Edit point details.
You can edit each point detail and add the type of sale the customer gave or images for clarity.
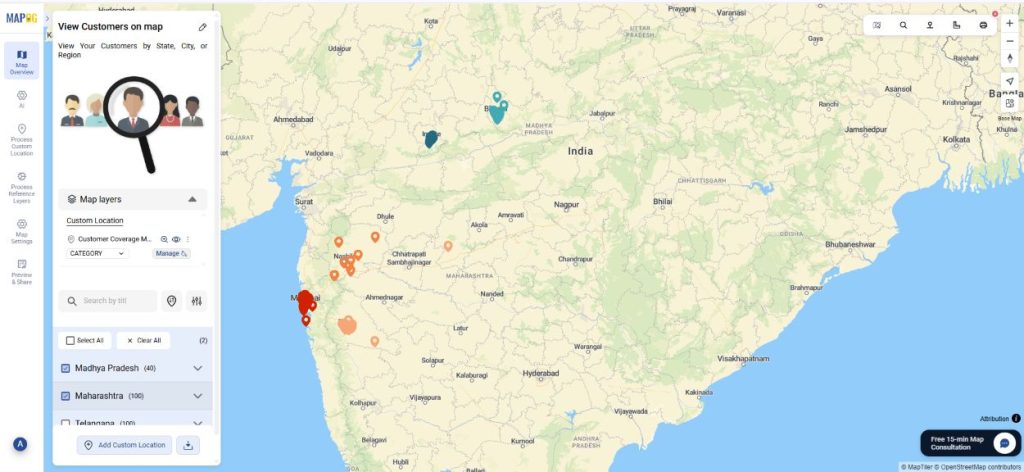
Step 5: View story filters
Now, you can selectively view the customers of different regions by turning on the story filters.
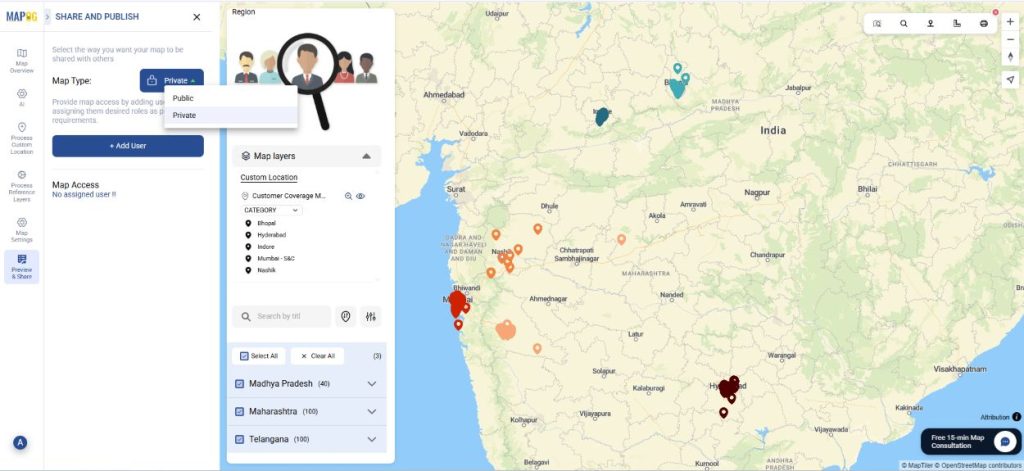
Step 6: Preview and share
Finally, once your map is complete, click “Preview and Share”. You can choose to keep your map private or share the link with your team.
Industrial Use and Benefits
Location-based visualization is valuable across many industries. In retail, it helps identify high-demand areas and plan store networks. Manufacturers can optimize supply chains by tracking distribution points and regional demand. Logistics teams use maps to streamline delivery routes, while marketers target campaigns more effectively by understanding where customers are most active. Across sectors, mapping customer and operational data leads to smarter decisions, reduced costs, and a clearer view of business performance.
Conclusion
Visualizing customer locations brings data to life by revealing patterns, opportunities, and insights that traditional reports often miss. Whether it’s identifying strong markets, improving logistics, or planning growth, location-based analysis empowers better business decisions. With MAPOG, you can easily transform your customer data into clear, interactive maps that show exactly where your business is thriving therefore, helping you move from data to action with confidence.
Similar articles: