Shapefiles are a popular format for storing geographic data, often used in GIS to define boundaries, and spatial attributes. However, How to Import Shapefiles into an Online Mapping Tool can be complex and difficult to interpret for non-technical audiences or in decision-making processes. Importing shapefiles into MAPOG transforms static data into interactive, shareable maps that support better analysis, visualization, and communication. This process helps stakeholders visualize and understand spatial patterns or GeoJSON data more intuitively, such as identifying the location of active and drying springs, ultimately leading to more informed interventions and resource management.
Key Concept: How to Import Shapefiles into an Online Mapping Tool?
Shapefiles are a widely used format for storing geographic data, including points, lines, and polygons or static visuals along with their attributes. Importing shapefiles into an online mapping tool transforms static spatial data into interactive, visually engaging maps. This process is especially valuable for non-technical users, as it enables easy visualization, and sharing of geographic information without requiring advanced GIS software or coding skills.
Step-by-step Guide to How to Import Shapefiles into an Online Mapping Tool
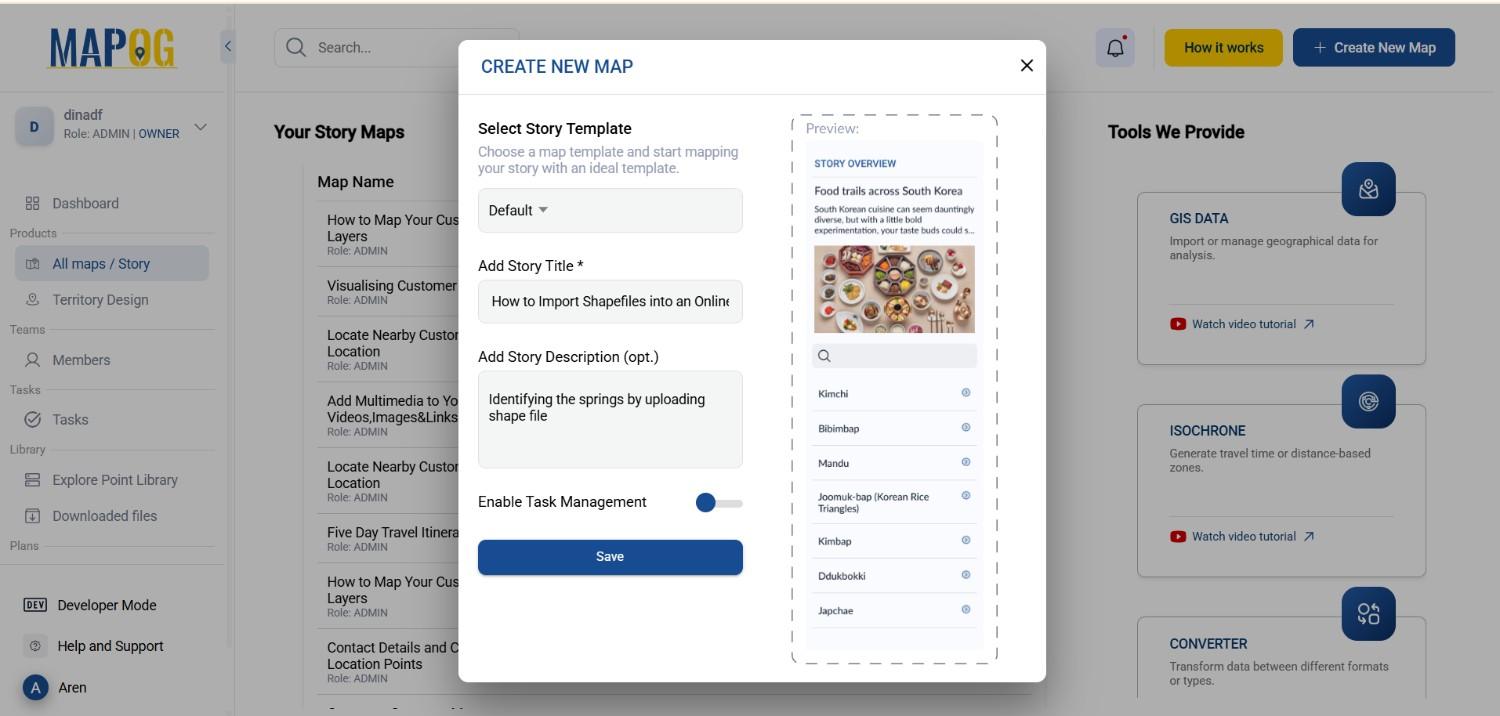
1. Creating a New Map
Start by creating a new map in MAPOG
2. Upload Your Shapefile
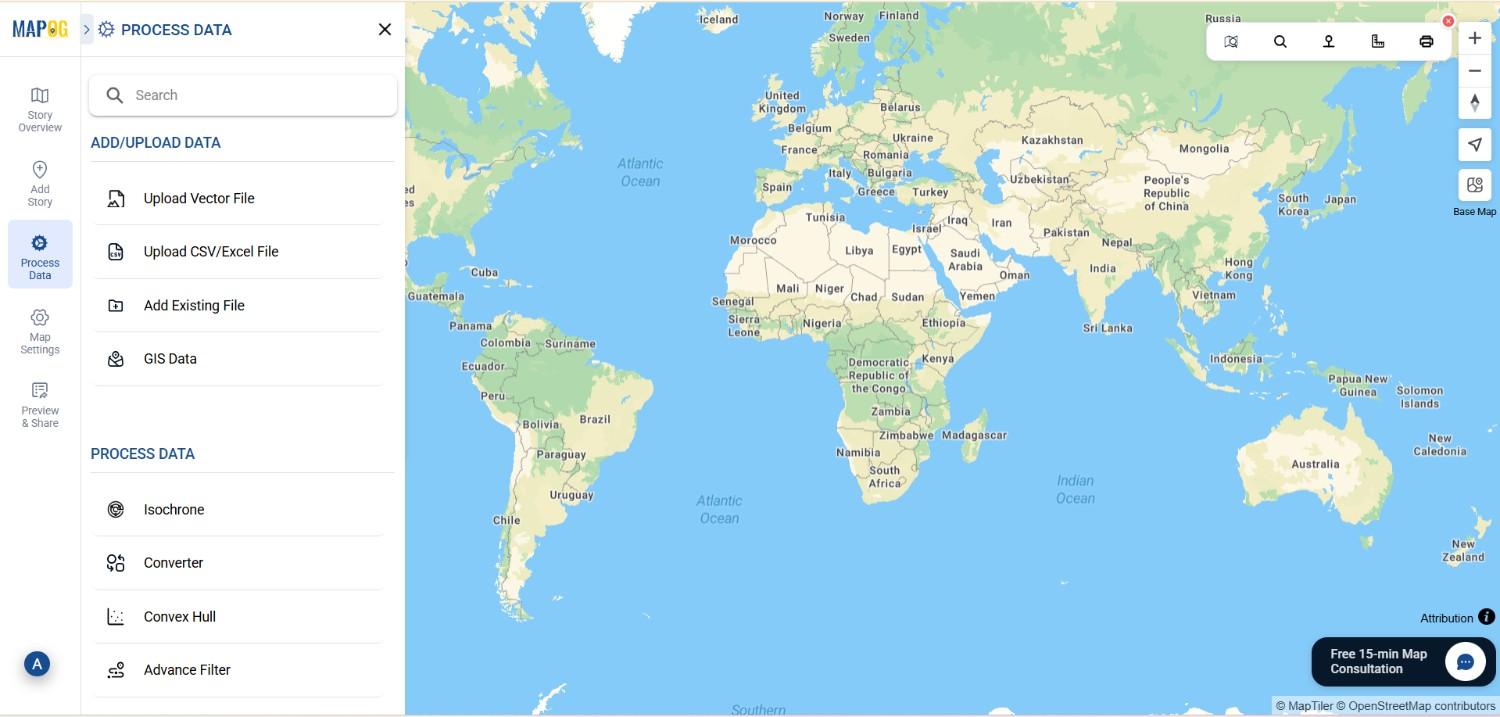
Next, proceed to the data upload phase. Click the “Process Data” button, then select the “Upload Vector File” option.
Here, you’ll browse your device to locate the shapefile representing your springs data , including the features for active and drying springs. Here 15+ different formats are available to upload. Confirm your selection and click “Upload” , Additionally, you can add a village boundary shapefile to enhance the map’s interactivity.
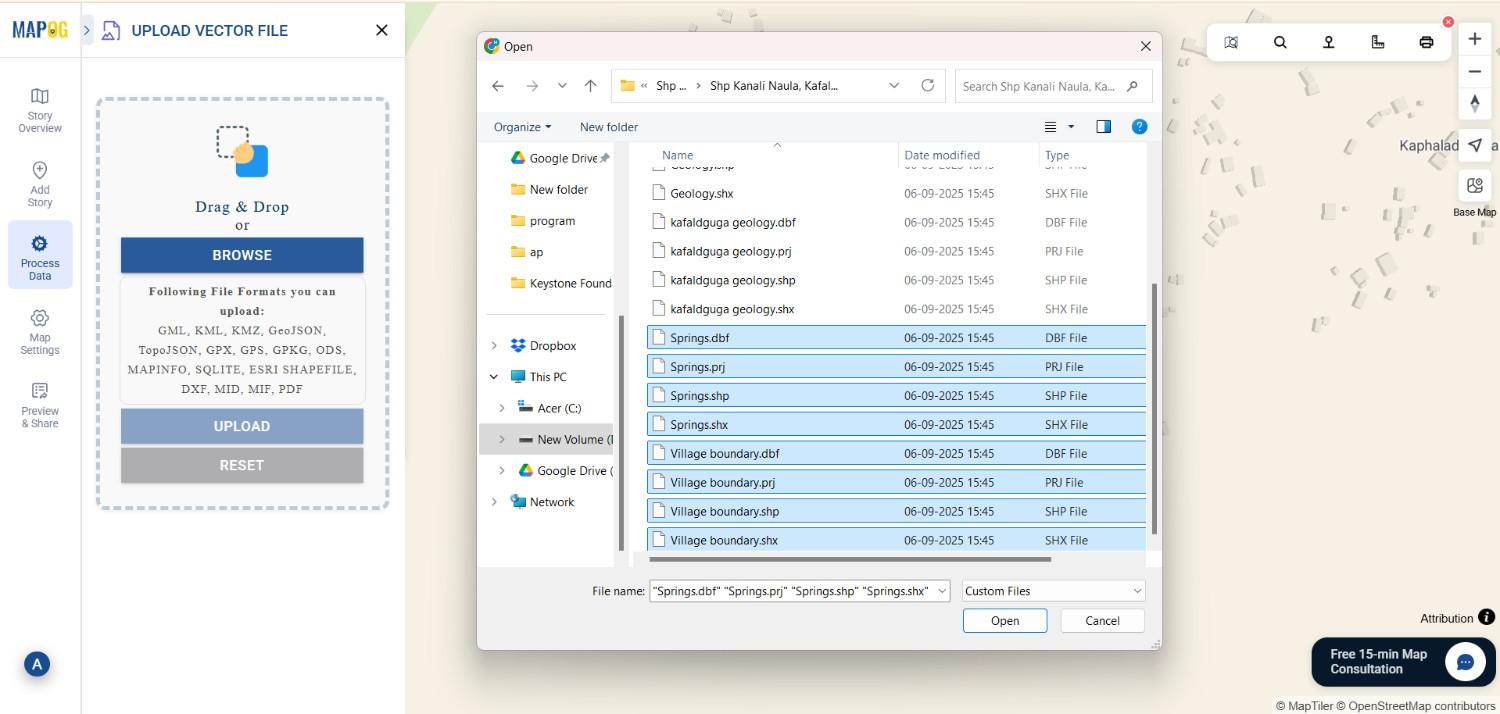
The platform might also prompt you to upload associated files such as .dbf or .shp files, which are essential to ensure complete data integration.
3. Style and Configure the Layer
Once your shapefile is uploaded, the next step is to style and categorize the features for better visualization. Head over to the layer panel, where you can see your imported shapefile.
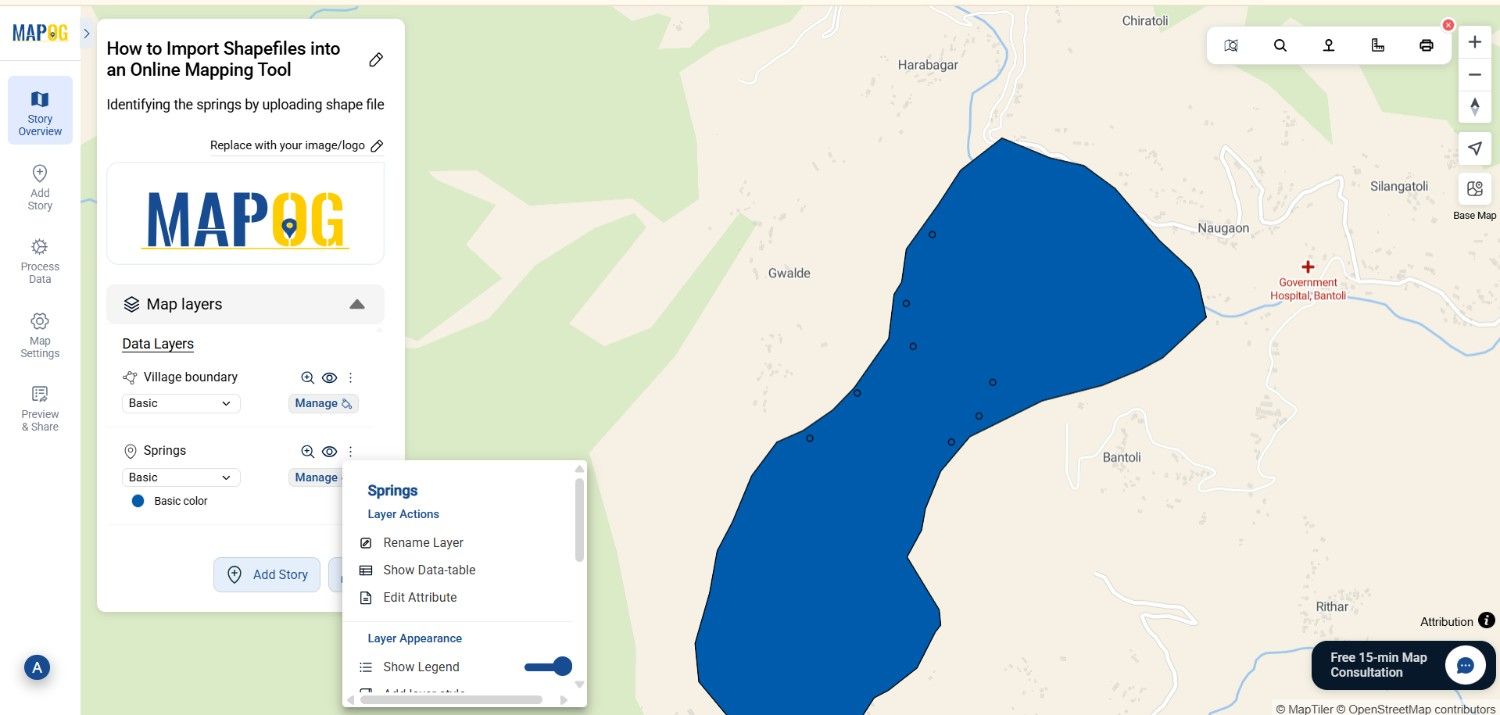
You should now choose “Edit Attribute” to add new attributes related to the springs, like their status—active or drying.
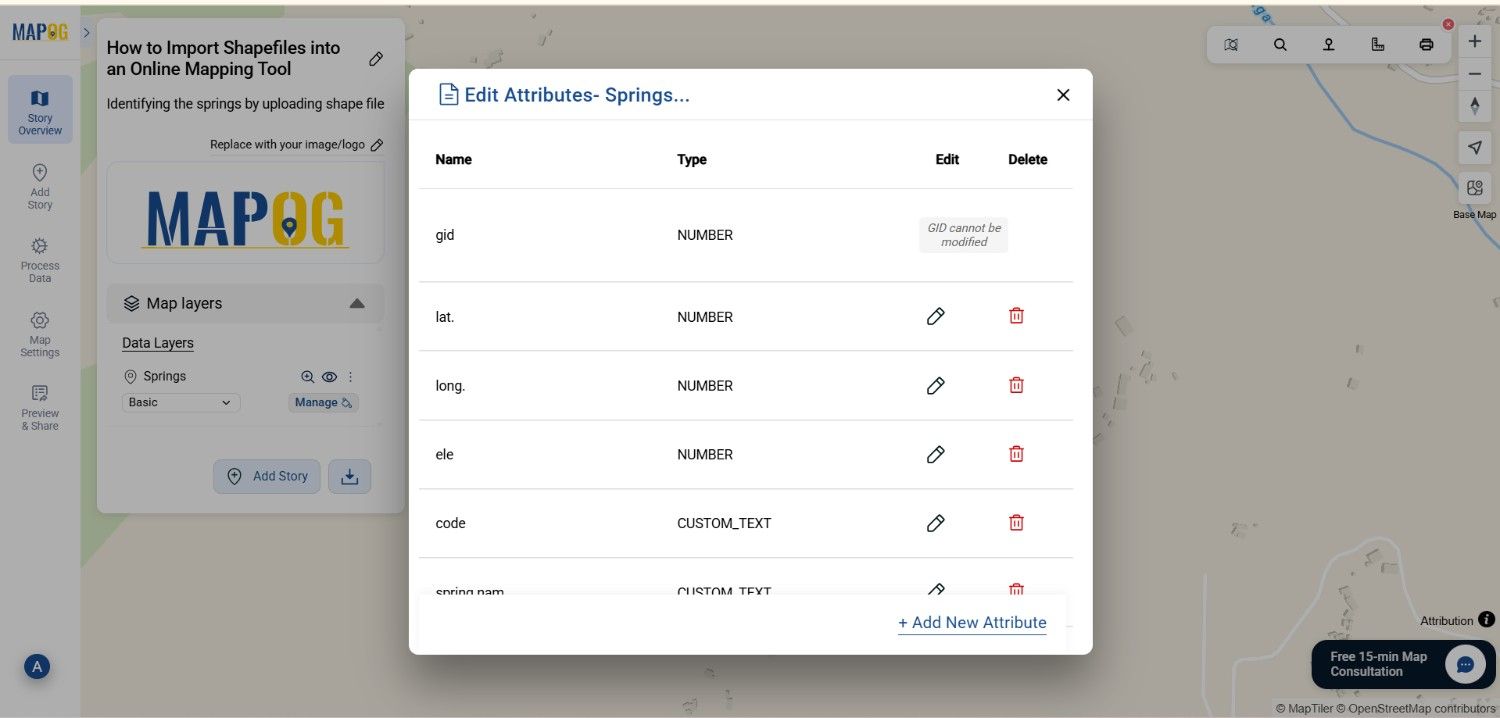
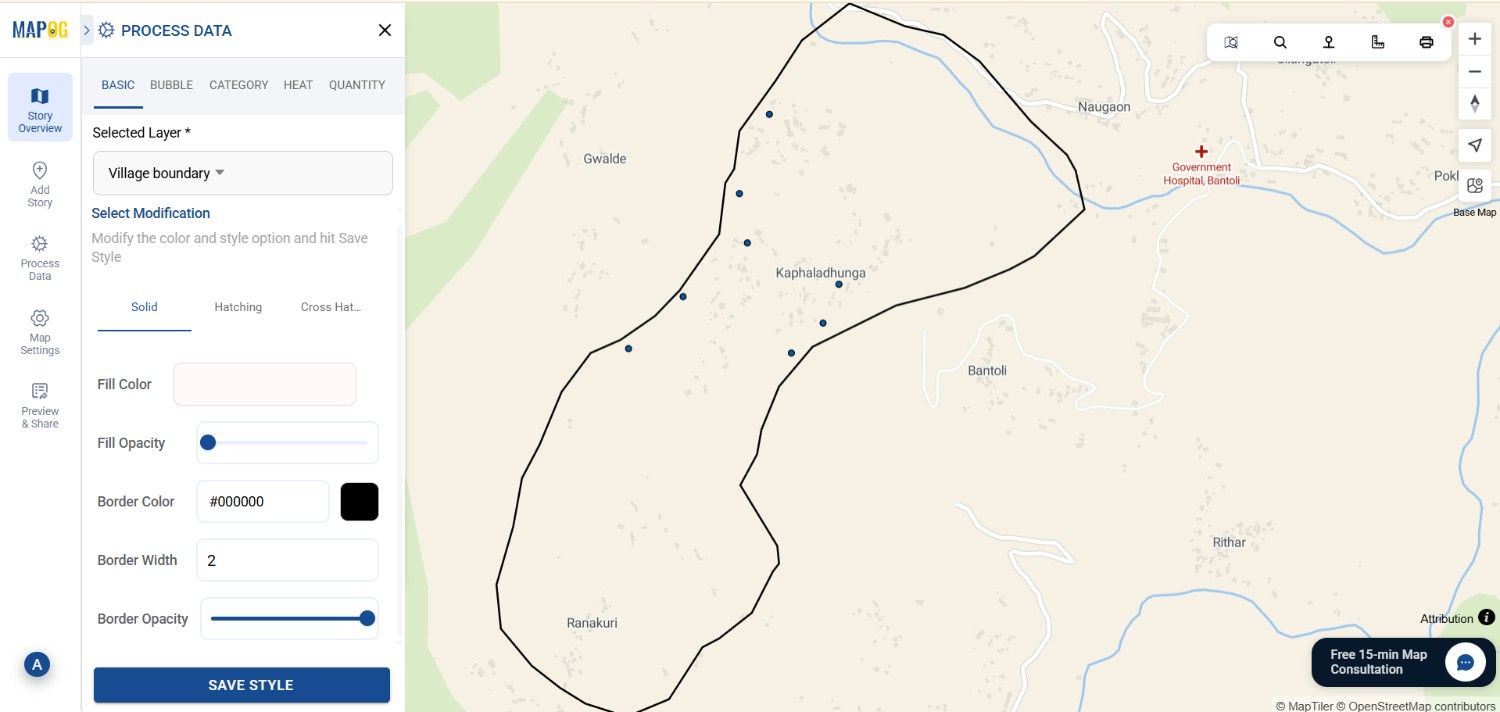
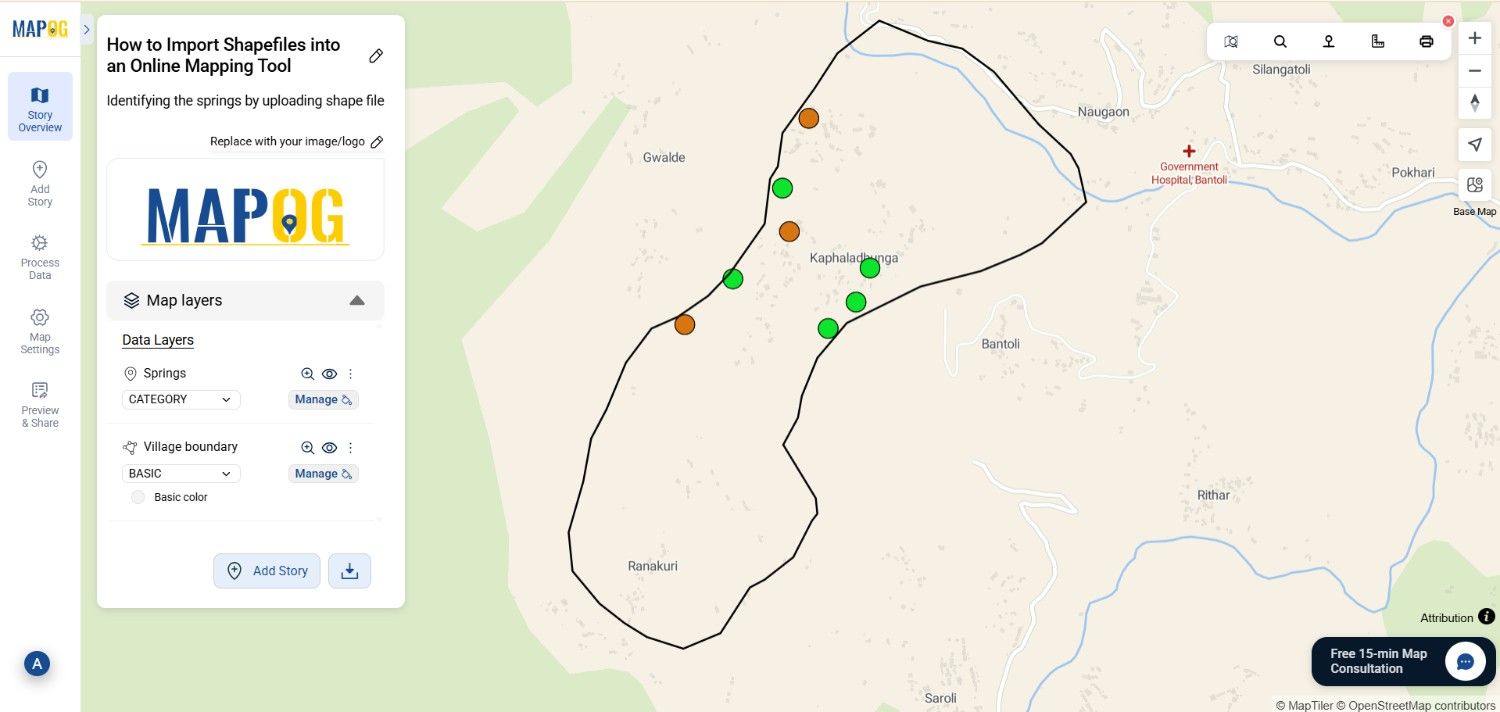
Go to the Add style layer section of Village boundary, change the color & opacity & save the style.
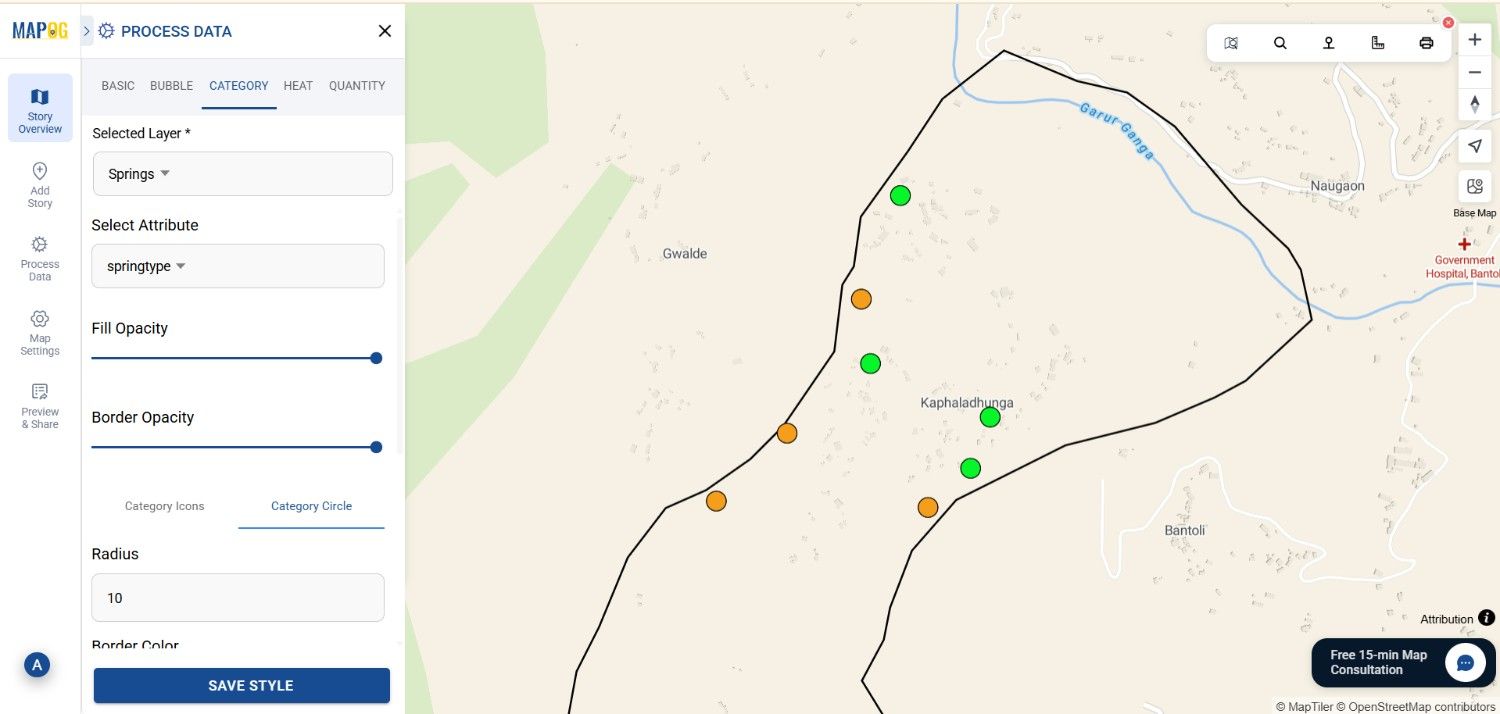
Afterward, in the same way assign symbols, colors, or icons to different spring statuses. For example, You can choose category style for this, select green for active springs and red for drying ones. Adjust opacity to balance visibility, size and finally, click “Save Style” to apply your customizations.
Including a legend is also essential to help viewers interpret colors correctly.
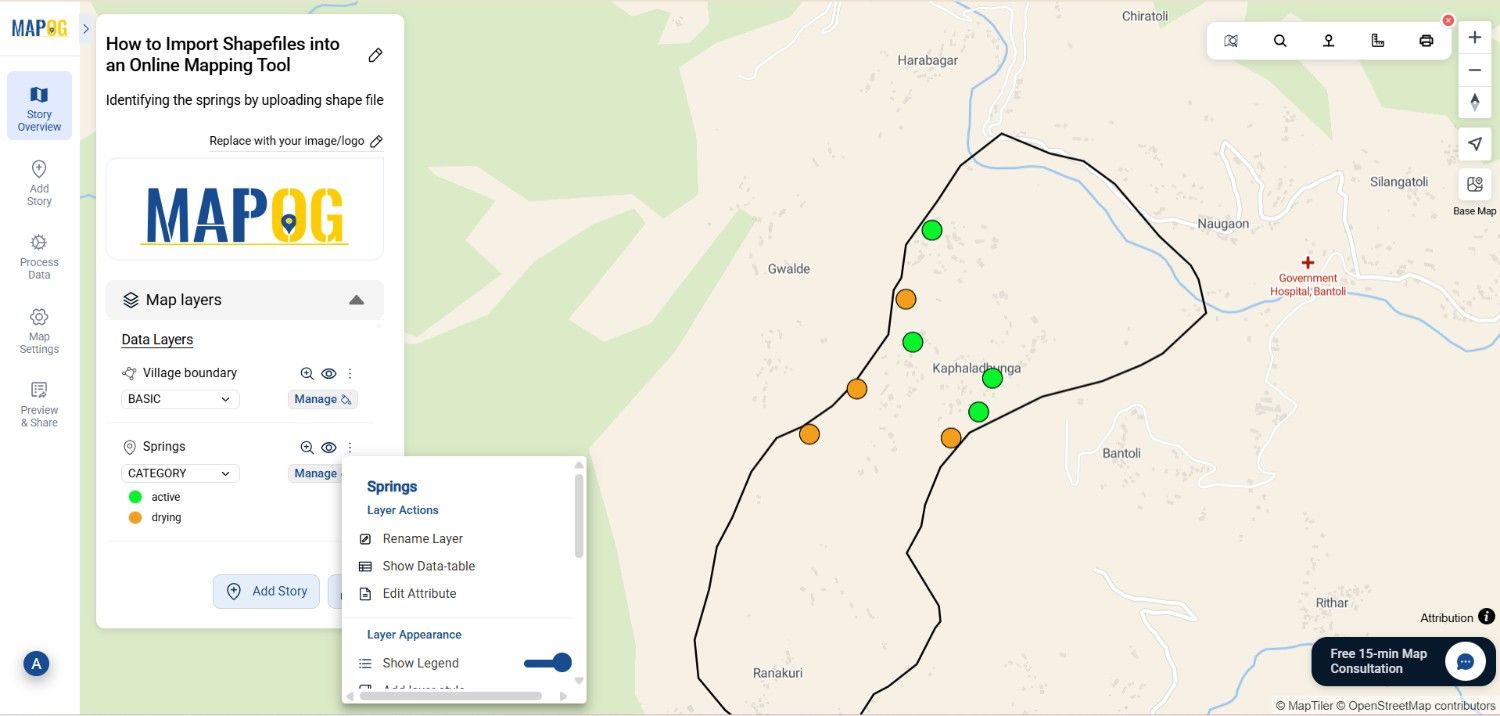
4. Explore Your Interactive Map
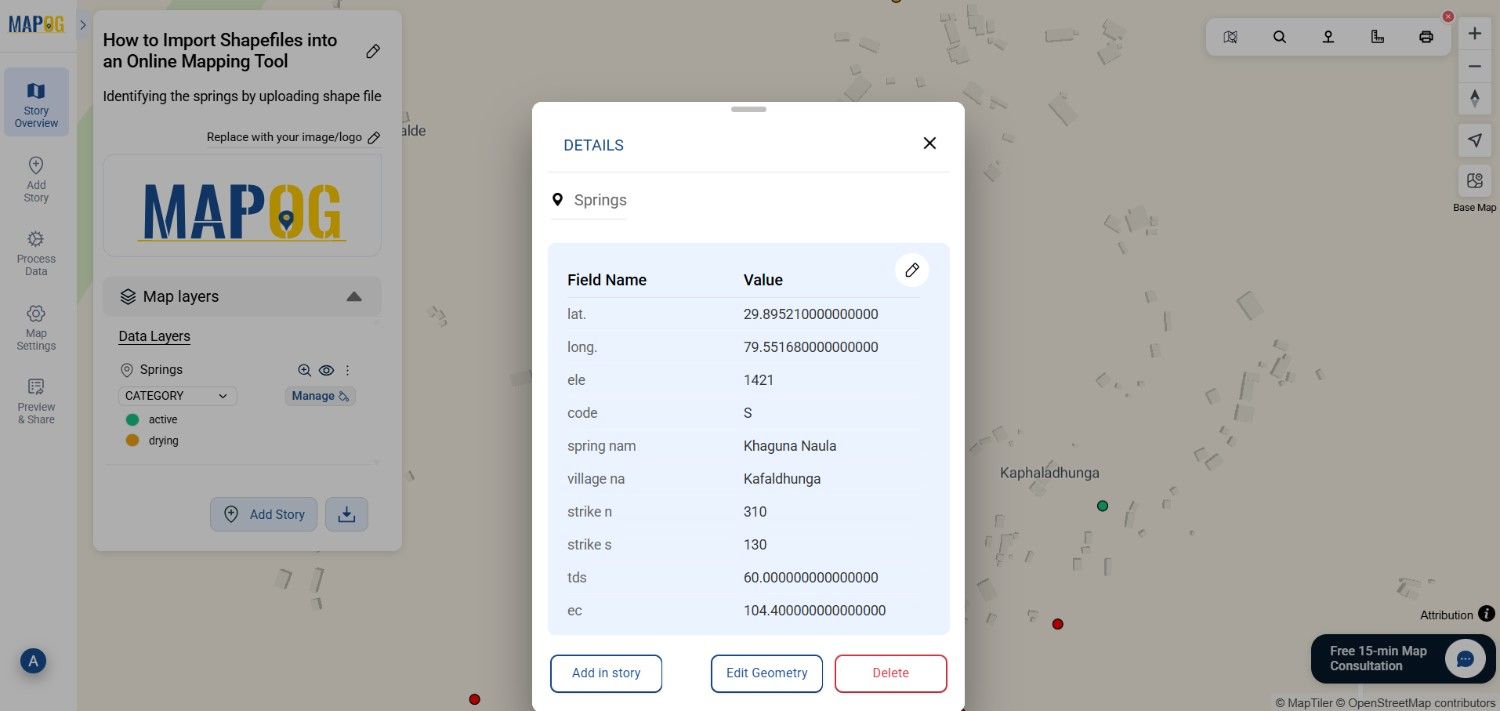
With styling complete, your map is ready for exploration. Open popups for each spring feature to display detailed attributes such as name, water flow, or status. Hover over features to observe their spatial relationships within the village area. This dynamic interaction makes it easy to identify clusters of active springs or areas where springs are drying up, providing useful insights for water management or conservation efforts.
Industry Use and Benefits
- Urban Planning: By visualizing infrastructure, zoning boundaries, and resource distribution, planners can make more informed decisions their plans effectively.
- Agriculture: Moreover, mapping field layouts, soil types, and irrigation networks effectively supports precision farming and ensures sustainable resource use.
- Environmental Management: Additionally, tracking pollution, forest cover, and protected areas helps enable better conservation efforts and continuous environmental monitoring.
- Disaster Response: Furthermore, mapping flood zones, shelters, and evacuation routes significantly improves coordination as well as response times during emergencies.
- Telecom: Similarly, identifying dead zones and strategically planning tower placement greatly enhances network efficiency and overall coverage.
Conclusion
In essence, importing shapefiles into MAPOG makes geographic data accessible, editable, and shareable without requiring elaborate GIS software or programming skills. It empowers rural communities, to visualize complex spatial relationships simply and interactively. From monitoring water springs to planning sustainable resource use, this process transforms geographic data into actionable insights, ultimately fostering informed decision-making for a resilient future.
Exploring Our Previous Blogs
- Role of GIS In Irrigation Planning and Water Resource Management
- How GIS and Smart Mapping Reduce Urban Heat Islands
- GIS in Infrastructure Development and Road Network Analysis
- Flood Risk Mapping with Interactive Web Maps: SaaS Approach
- Optimizing Warehouse Location Selection with GIS for Supply Chain Efficiency