Creating detailed maps for real estate projects or buildings once required technical GIS knowledge or expensive software. For developers, planners, easy mapping tools for real estate projects often meant relying on specialists just to visualize property layouts or land parcels. However, the rise of easy, no-code mapping tools has completely changed that. MAPOG now make it simple to design, style, and share interactive maps online.
Why Easy Mapping Tools Matter for Real Estate Projects matters
In real estate, location is everything. However, understanding a location goes beyond seeing an address on a 2D map. Professionals also need to visualize how plots, roads, electric stations, and surroundings connect spatially. Earlier, achieving this level of insight required complex desktop GIS software or technical mapping skills. Now, with simple online tools, creating interactive and detailed real estate maps has become faster and easier.
Step-by-Step Guide: How to Map Your Real Estate Project
1. Start a New Map
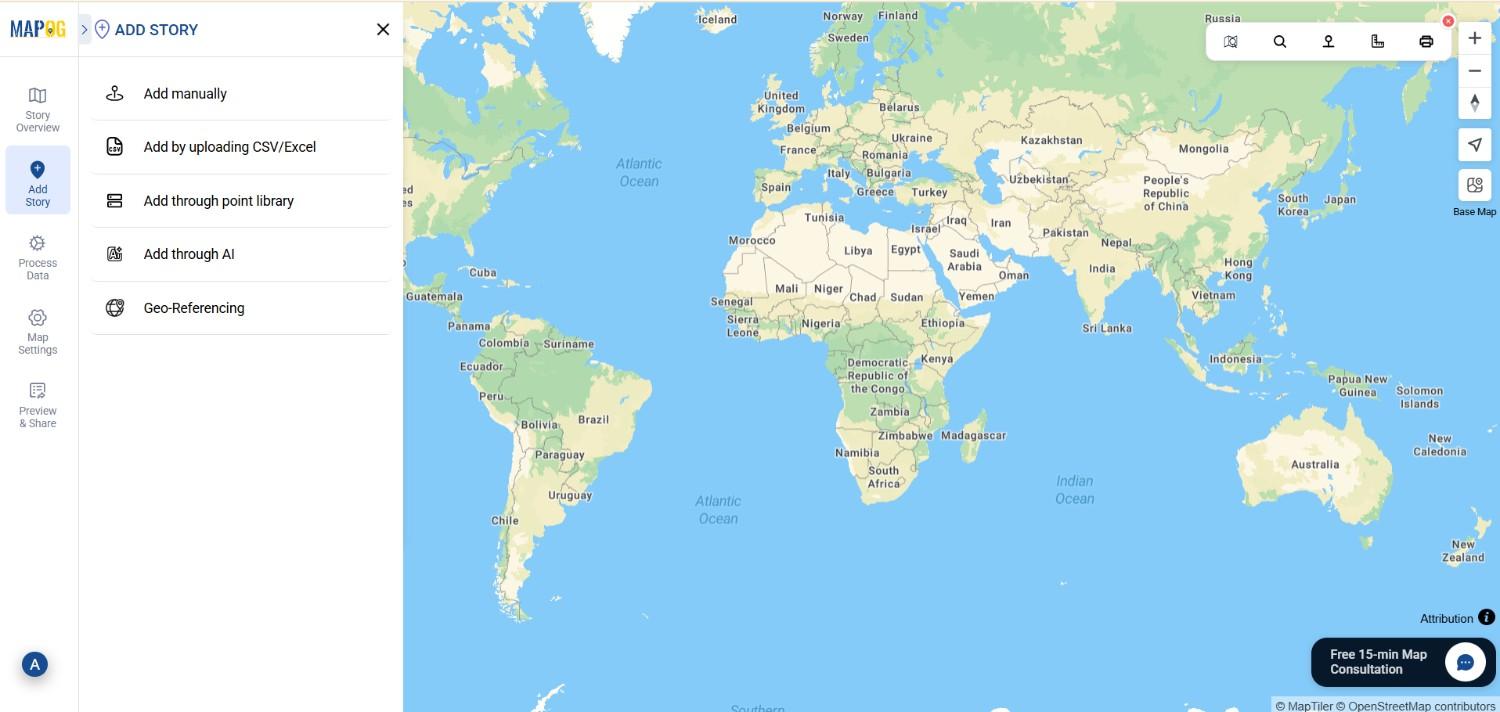
First, log in to MAPOG and create a new category map project. Once inside, go to the “Add Story” section and choose “Add Manually.”
2: Categorize
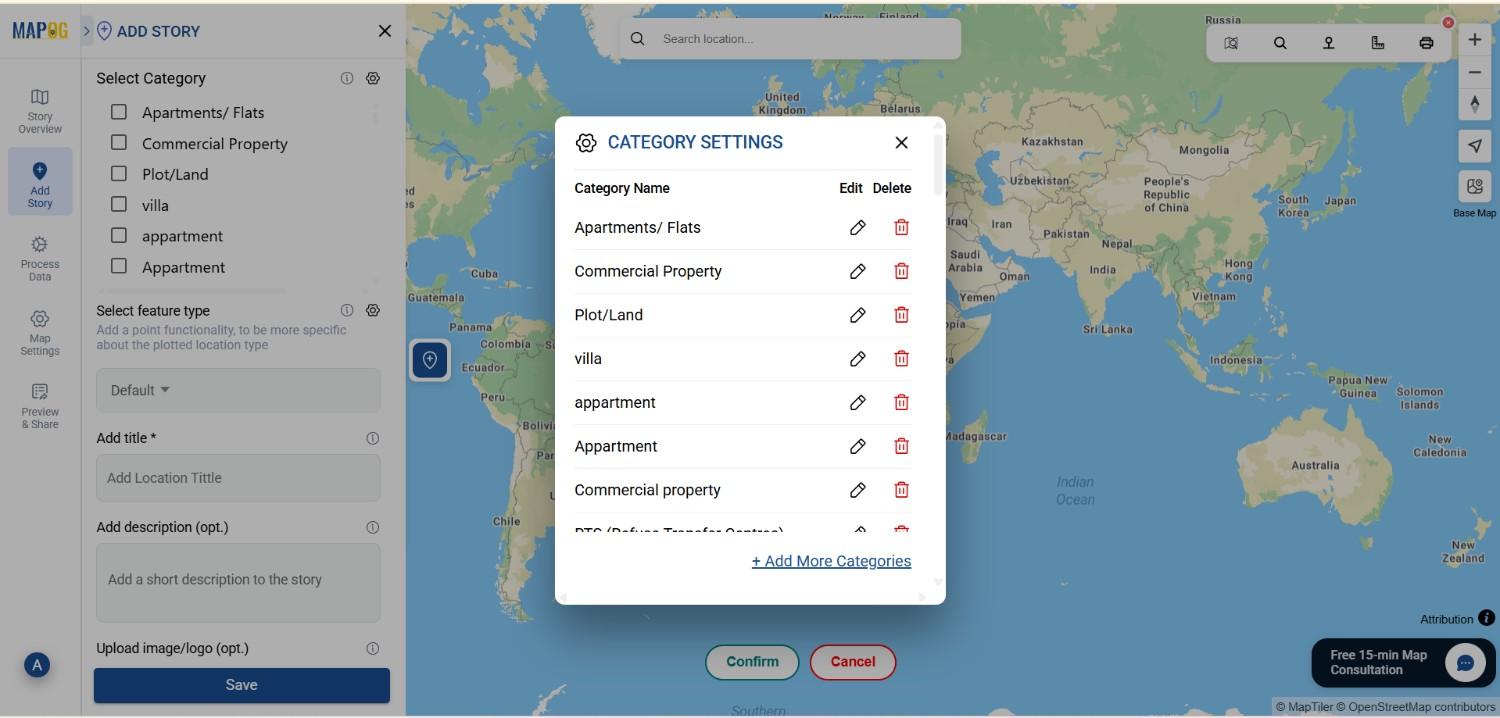
Go to edit point details and on select category settings create new categories like Apartments or Commercial buildings select one of them which seems suitable and do the same for each point .
3. Locate Your Project Area
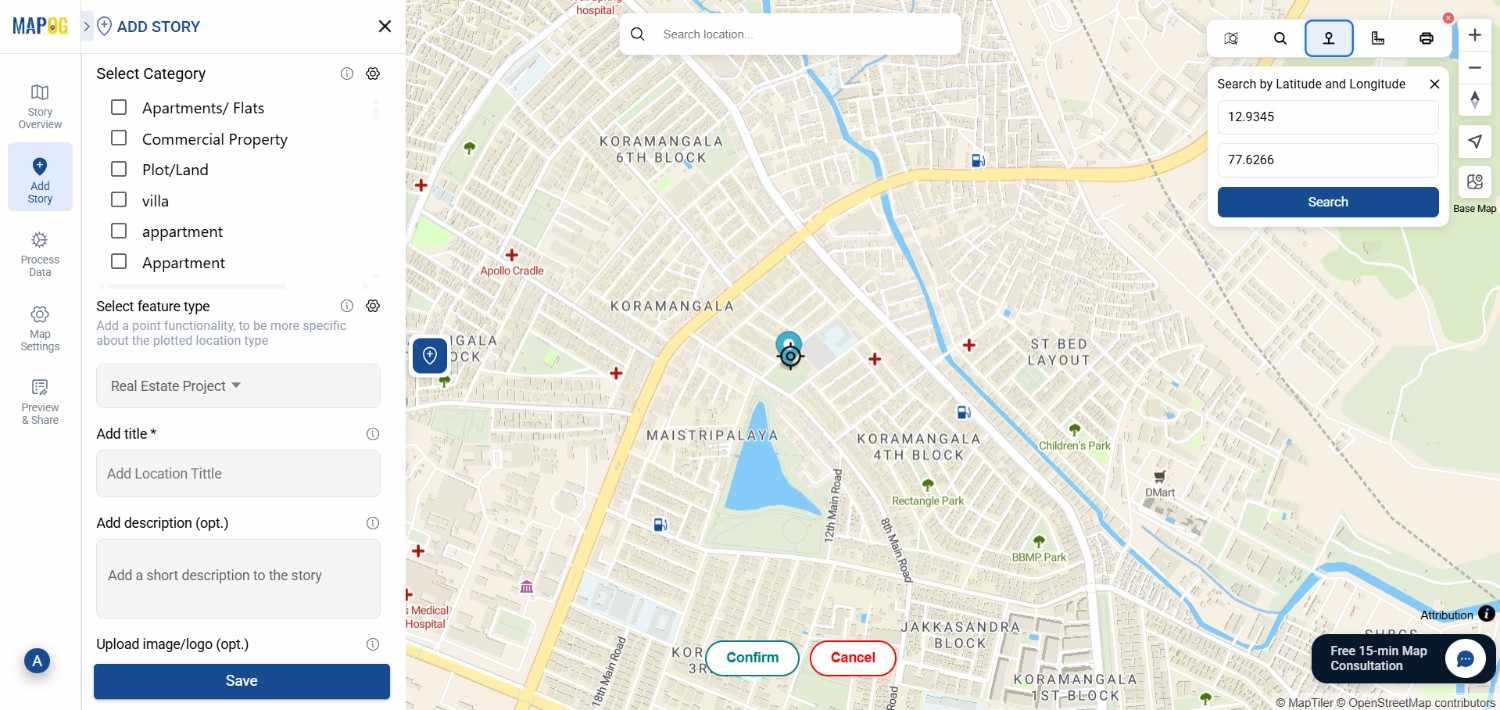
Next, use the Search Tool to find your project location. You can search by or coordinates.
4. Define the Feature Type
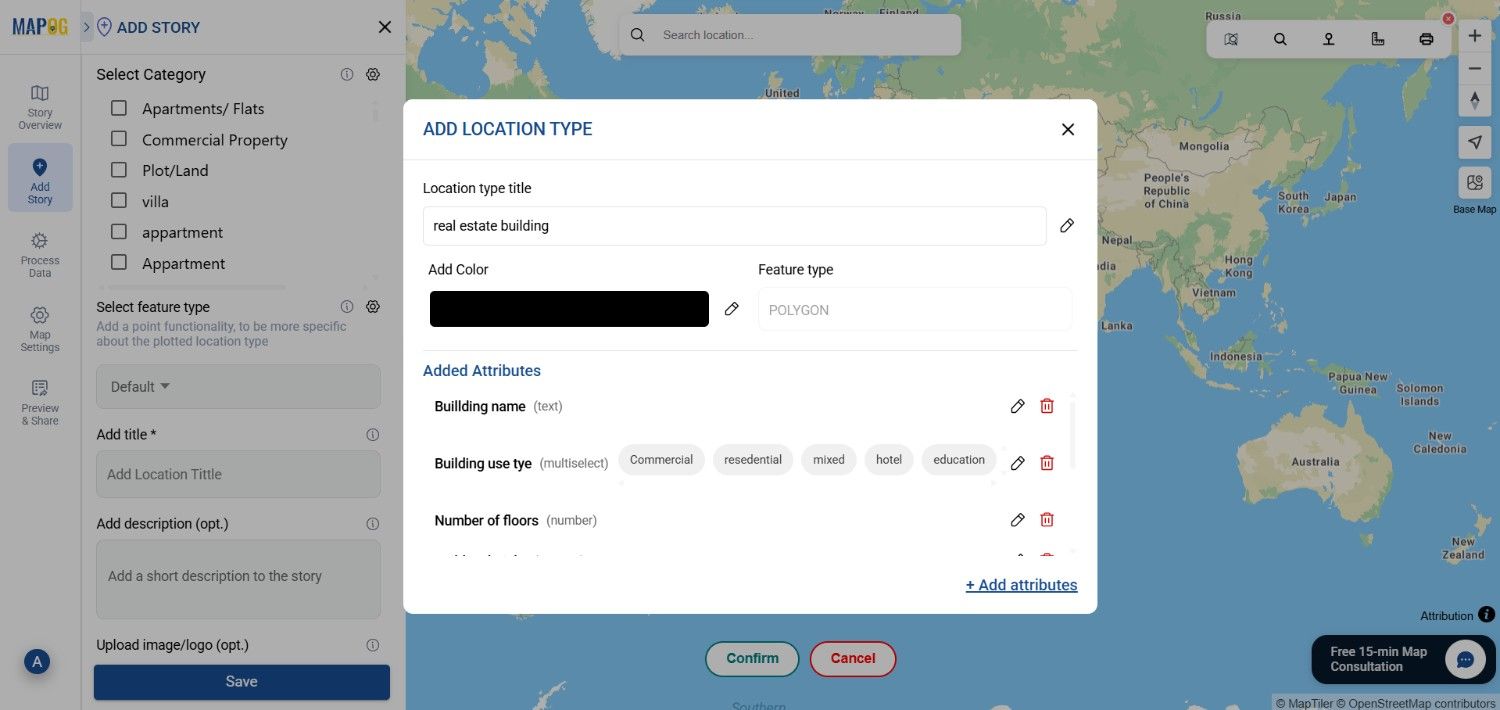
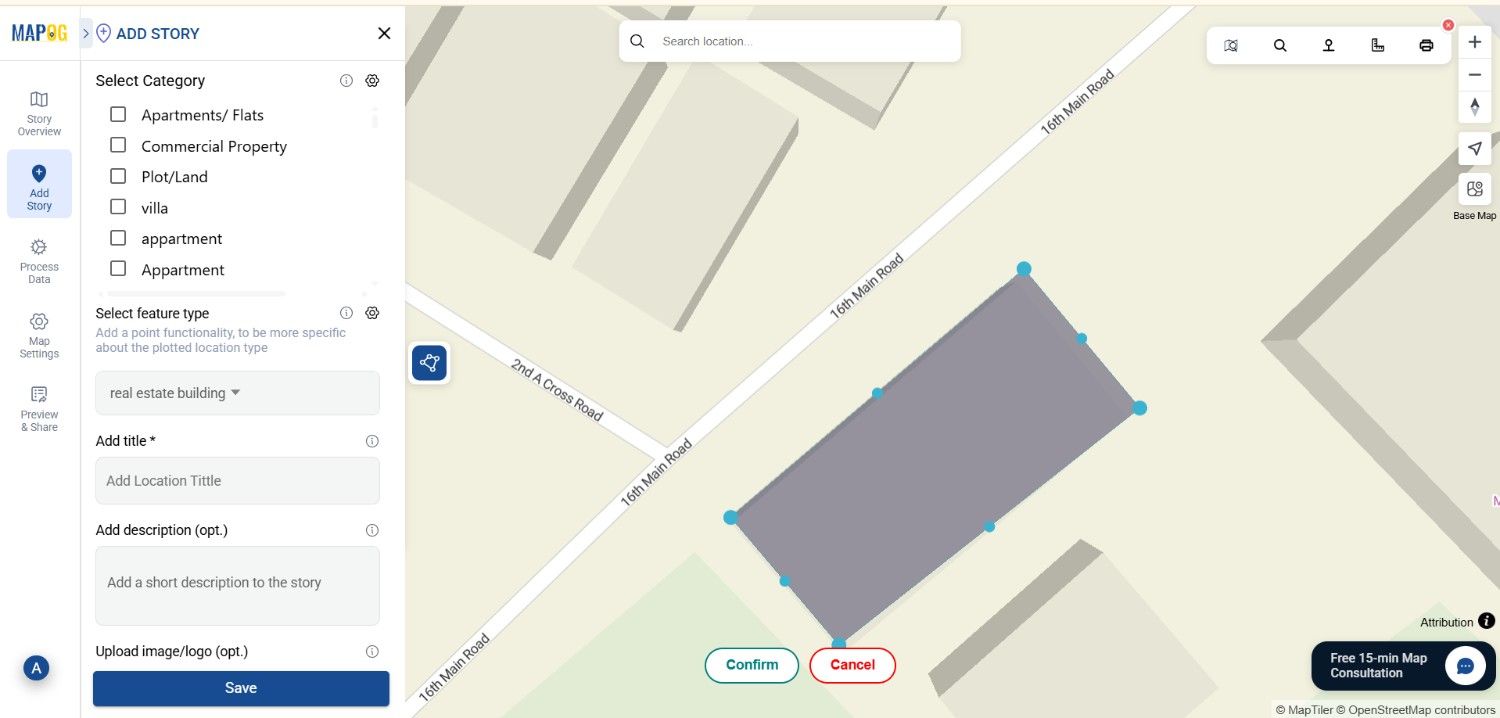
Then, open the Feature Type Settings to structure your data. Select Polygon as your feature type since most real estate areas are defined by boundaries. Add key attributes such as building name , address etc.
5. Draw Property Boundaries
Now, click the Polygon Tool and start tracing your first property boundary. Click around the edges of the plot to mark corners, then connect them to form a closed shape. Once done, select Confirm to save the feature. You can repeat this process for all plots and road layouts within your project boundary.
6. Style, Label, and Add Details
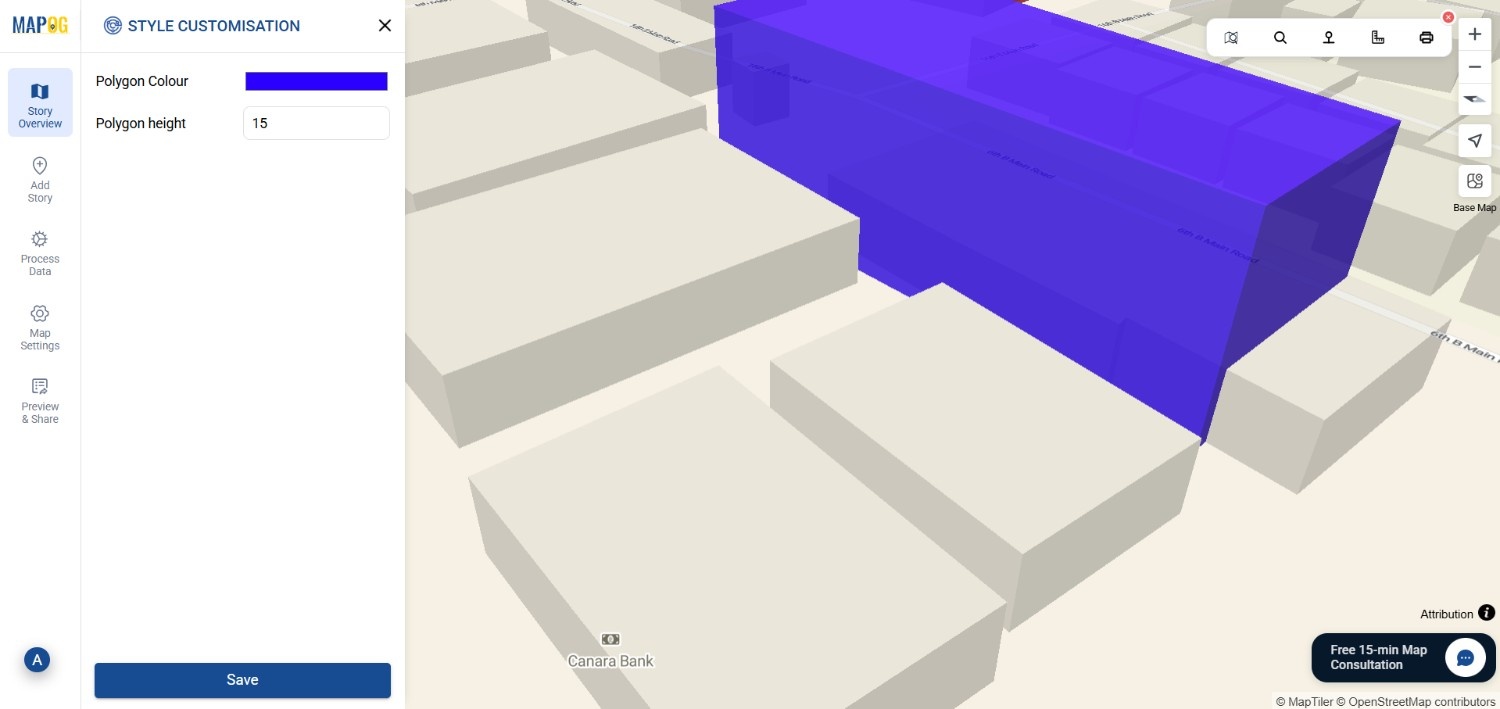
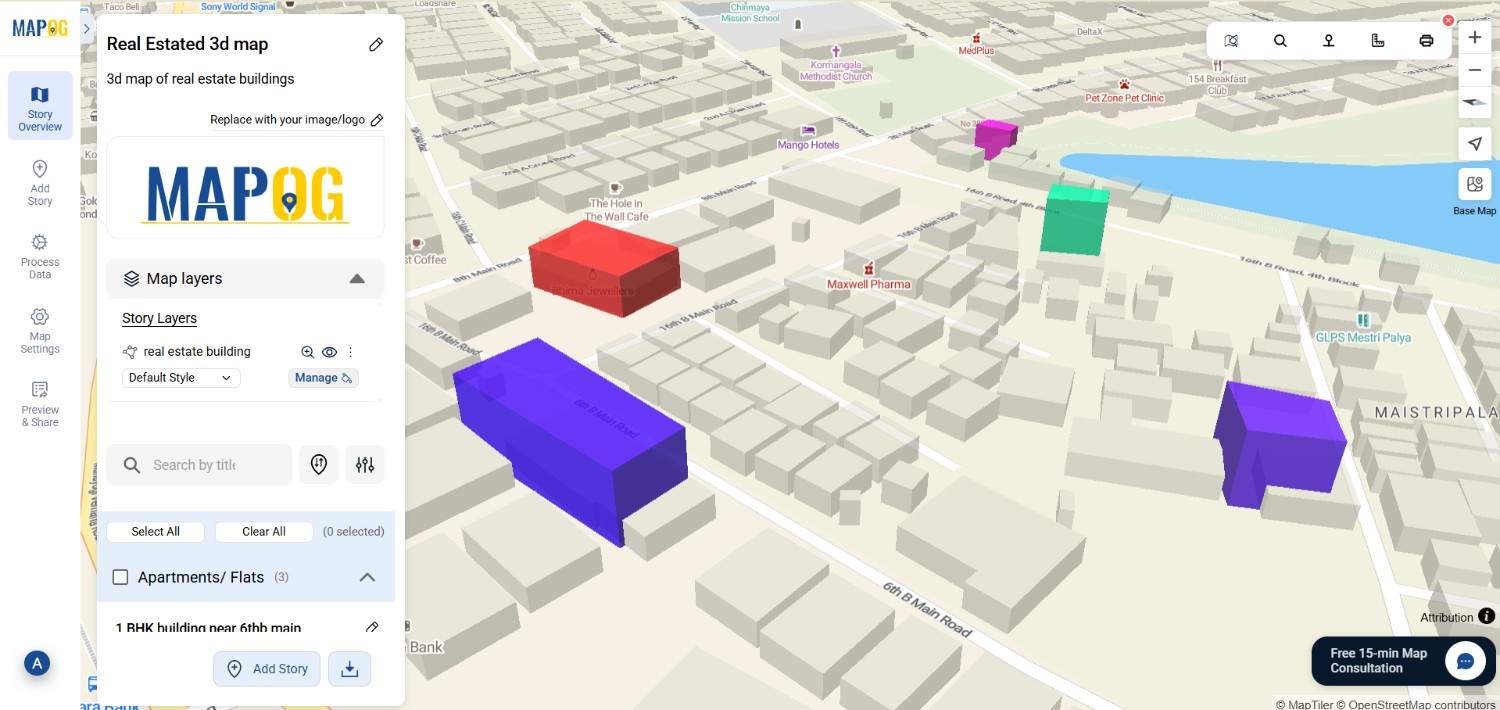
After drawing your boundaries, click the Edit (pencil) icon to open the styling panel. Here, you can assign colors, change the height to give it a 3d look , opacity, and border styles to differentiate between property types — for instance, residential areas in blue and amenities in green.
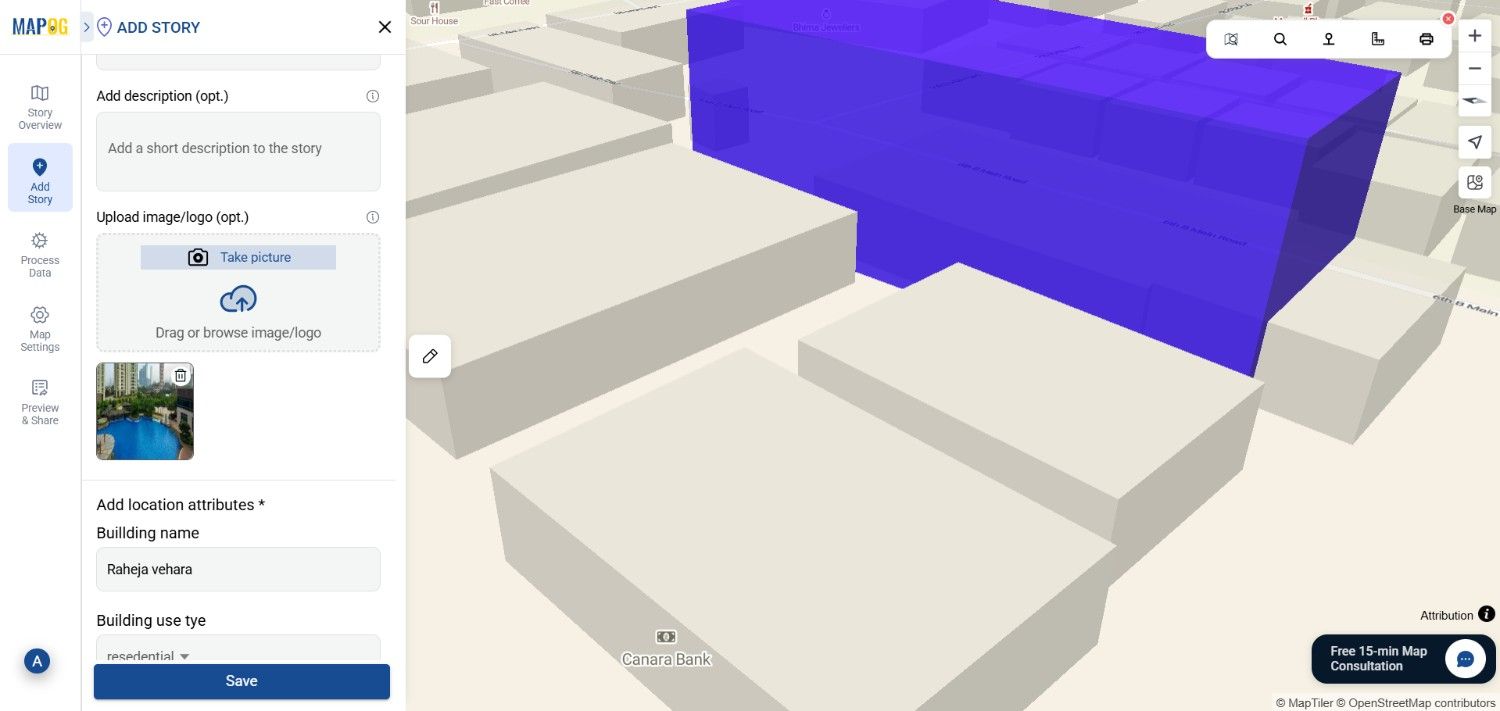
Next, fill in the attribute values and upload relevant images such as plot layouts or site photos.
7. Share and Publish
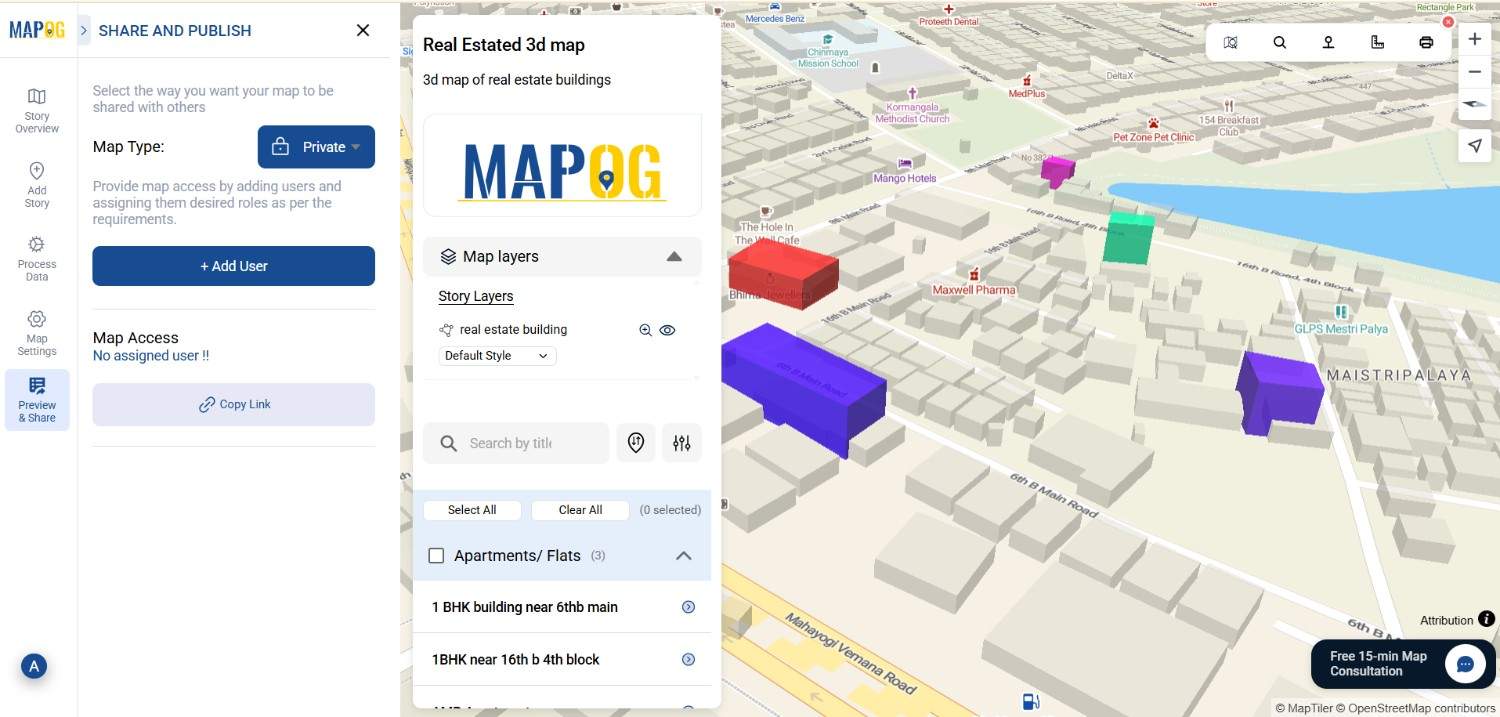
Finally once your map is ready, click Share & Publish. Make it public for citizens, embed it on community websites, or share the link with local authorities for planning and monitoring.
Industrial Use & Benefits
These easy mapping tools offer clear advantages across the real estate sector. For developers, they simplify project visualization while helping teams efficiently track construction progress spatially. Moreover, sales teams can easily use interactive maps to present available plots and highlight sold ones with color codes. Meanwhile, investors and clients gain a clearer understanding of project layouts and nearby amenities, thus boosting transparency and trust.
Furthermore, urban planners can effectively analyze land-use compatibility, road access, and green coverage. Even educational institutions offering real estate or urban studies courses can conveniently use maps to teach spatial analysis concepts without relying on heavy software setups. Since everything happens online, multiple stakeholders can access, view, and comment on the same map, thereby streamlining collaboration and improving decision-making.
Conclusion
In short, easy mapping tools are completely transforming how real estate projects are planned, presented, and shared. By eliminating the technical barriers of traditional GIS, MAPOG now make it easier for anyone — from builders to brokers — to turn property data into clear, interactive maps. Moreover, with just a few clicks, users can visualize layouts, update attributes, and present entire projects in an engaging and spatially rich format.
Exploring Our Previous Blogs
- Role of GIS In Irrigation Planning and Water Resource Management
- How GIS and Smart Mapping Reduce Urban Heat Islands
- GIS in Infrastructure Development and Road Network Analysis
- Flood Risk Mapping with Interactive Web Maps: SaaS Approach
- Optimizing Warehouse Location Selection with GIS for Supply Chain Efficiency