Learn how to create a story map online free using MAPOG—no GIS skills needed, just intuitive storytelling with images, text, and location. Whether you’re showcasing heritage sites, tracking environmental changes, or exploring social patterns, Story Maps convert static information into engaging experiences. For example, you can plan travel routes with story maps or explore the greatest inventions across the world through a mapped narrative. Its application ranges from students to planners—to craft and share powerful geographic stories online, entirely for free.
Understanding Story Maps
A Story Map is a digital narrative that blends geographic data with multimedia—like images, text, and video—to give spatial context to any topic. Unlike static reports, Story Maps offer interactive experiences that make information more engaging and easier to understand.
They’re popular in tourism, planning, and education. For instance, How to Create a Travel Itinerary on a Map and Share It Online shows how even personal trips can be turned into immersive, interactive maps.
By blending maps with multimedia, story maps offer an intuitive and accessible way for anyone—planners, educators, students, or citizens—to tell compelling location-based stories online.
“Building Interactive Story Maps” presents geographic information through engaging, multimedia narratives. Unlike static lists, these interactive maps blend images, descriptions, and links, turning raw data into compelling visual stories. Platforms like MAPOG empower anyone to create immersive, location-based experiences effortlessly.
Step-by-Step: How to Create a Free Story Map Online
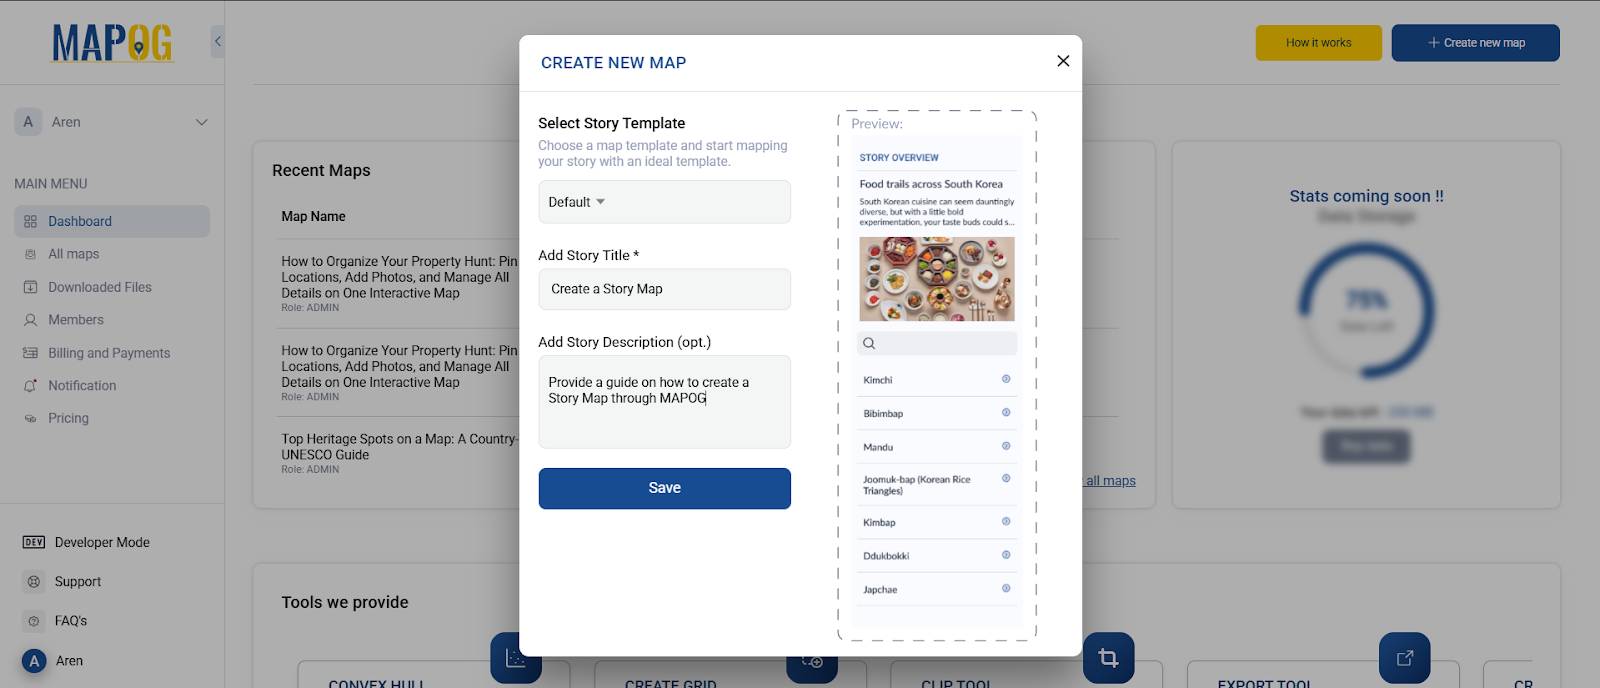
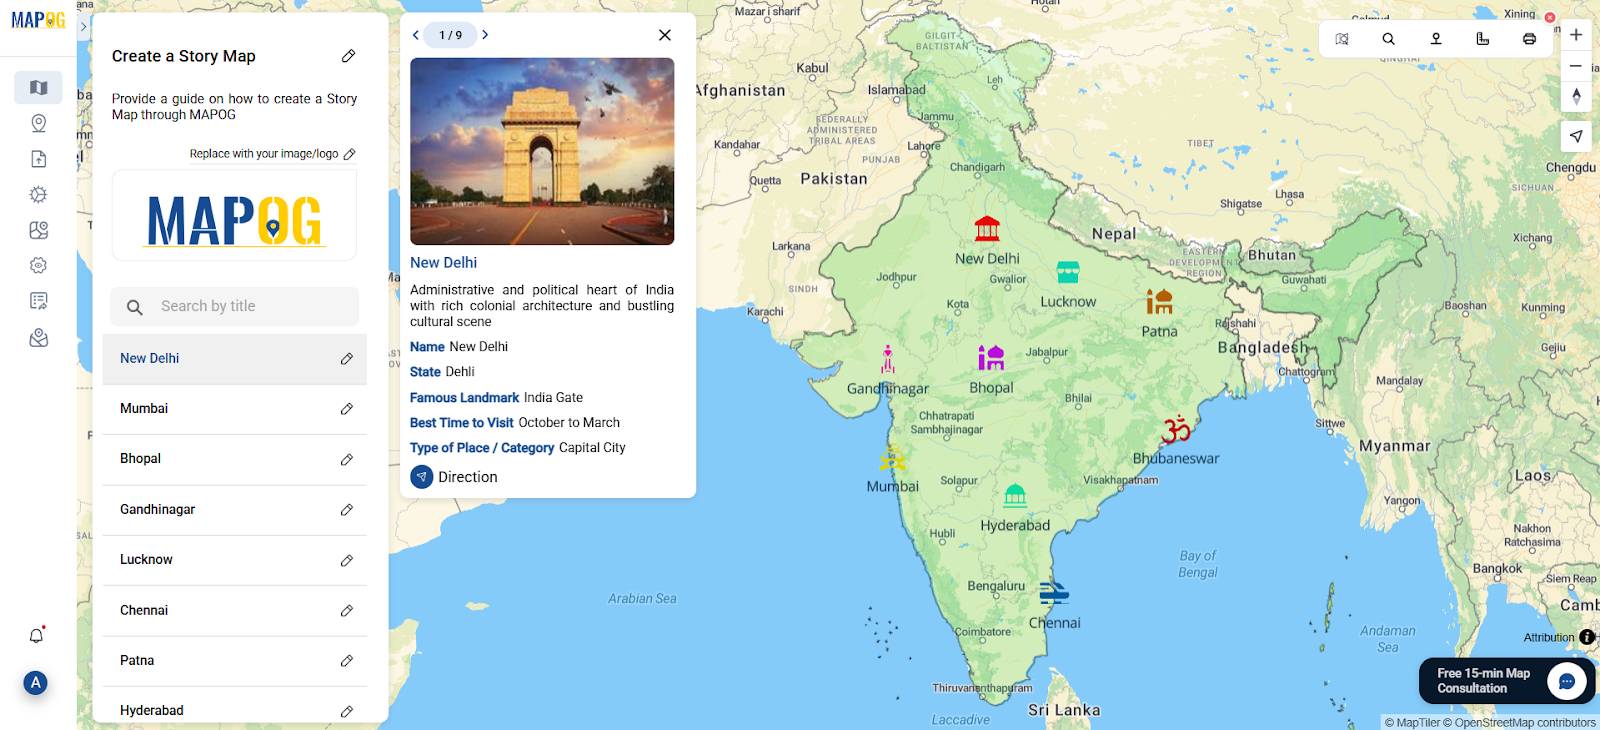
Step 1: Visit the MAPOG Story Mapping Platform
Go to MAPOG and start a new project by clicking “Create New Map”
- Title your project
- Write a short description
Once done, click “Save” to enter the map editor.
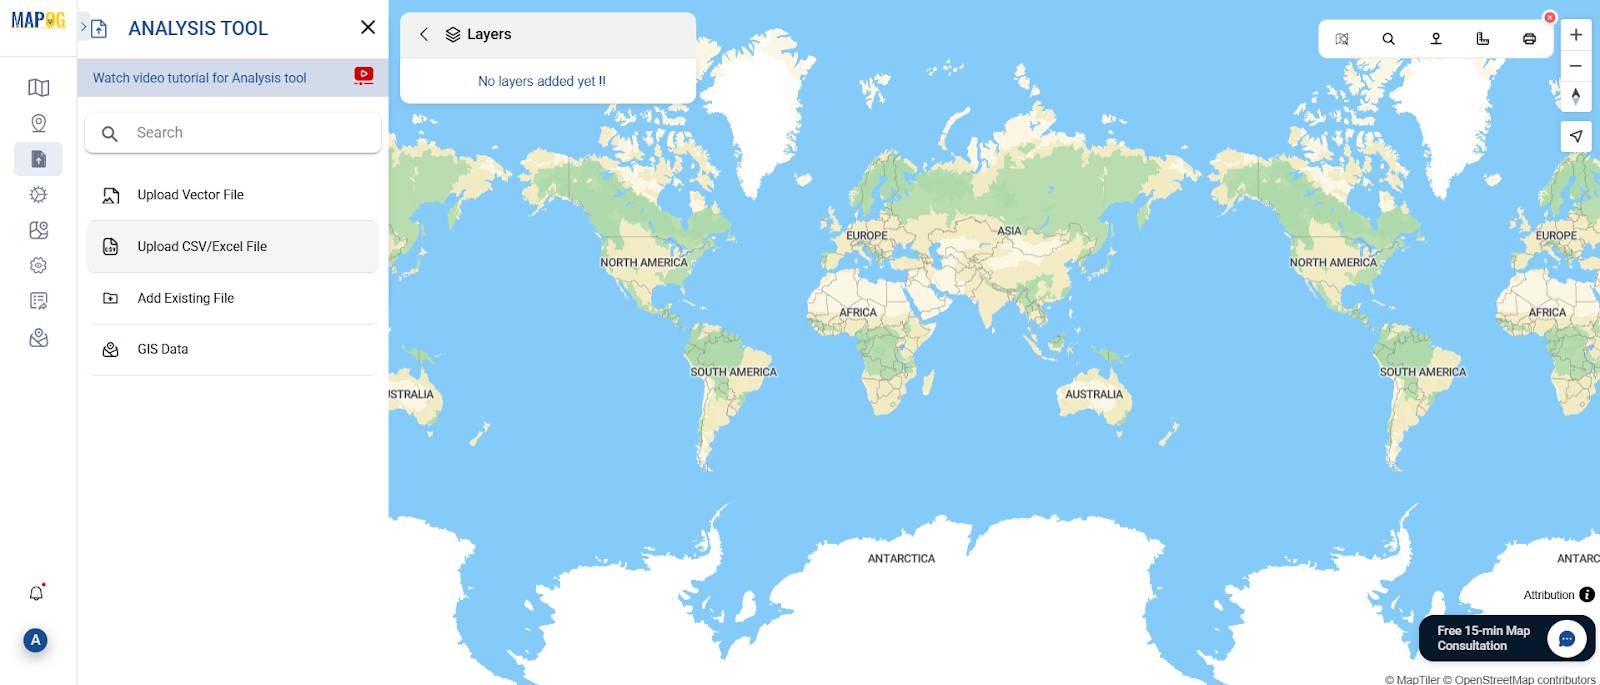
Step 2: Insert Your Story Data
In Story Map mode, you don’t need to upload complex datasets to get started. Simply use the built-in tool box to:
- Search and plot specific addresses directly on the map
- Manually input latitude and longitude to place points with precision
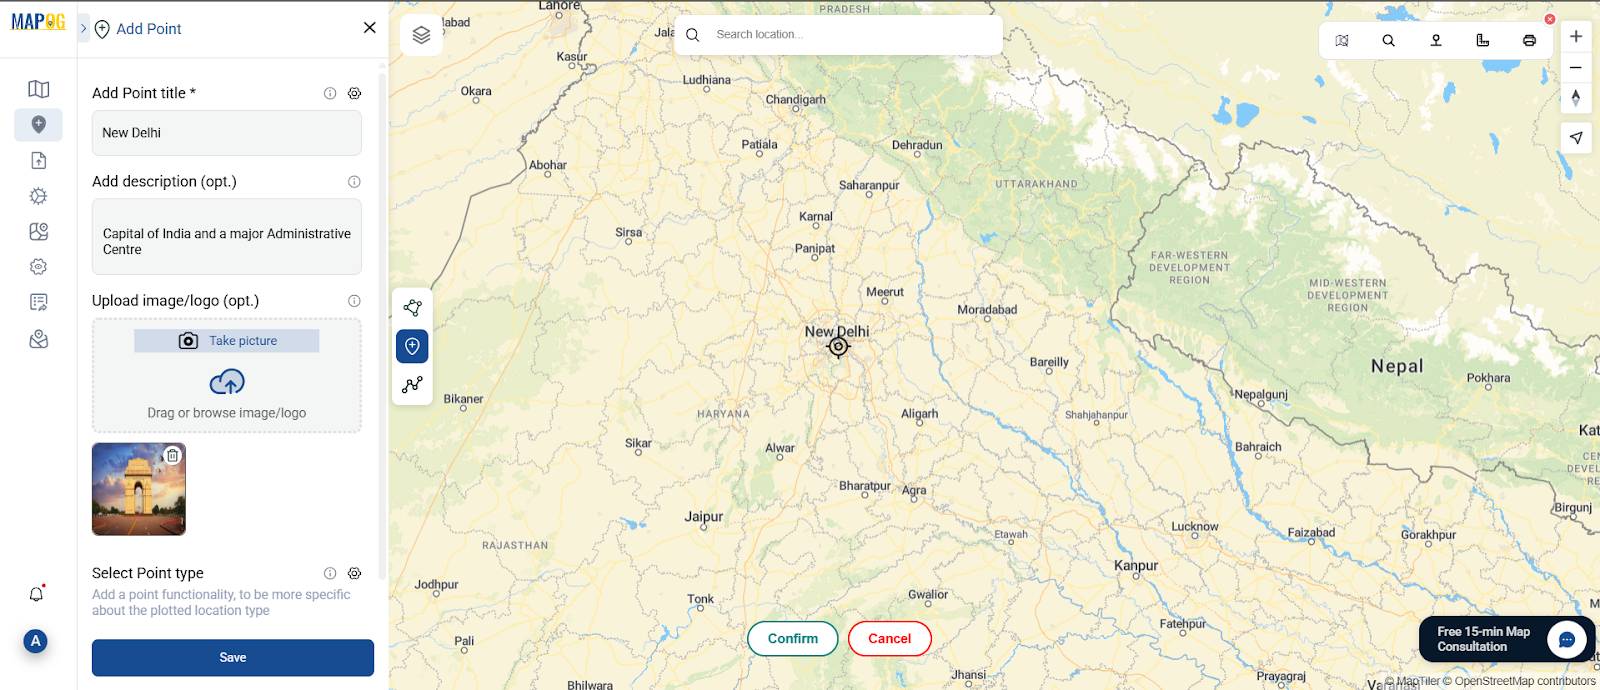
Step 3: Add Story Points and Organize with Location Types
Add Story Points:
- Navigate to the “Add Point” tab.
- Click anywhere on the map where your feature (e.g,a location of interest) is located.
- For each point, fill in:
- Title
- Description explaining its history, importance, or architecture
Upload images or icons, to visually enhance the experience.
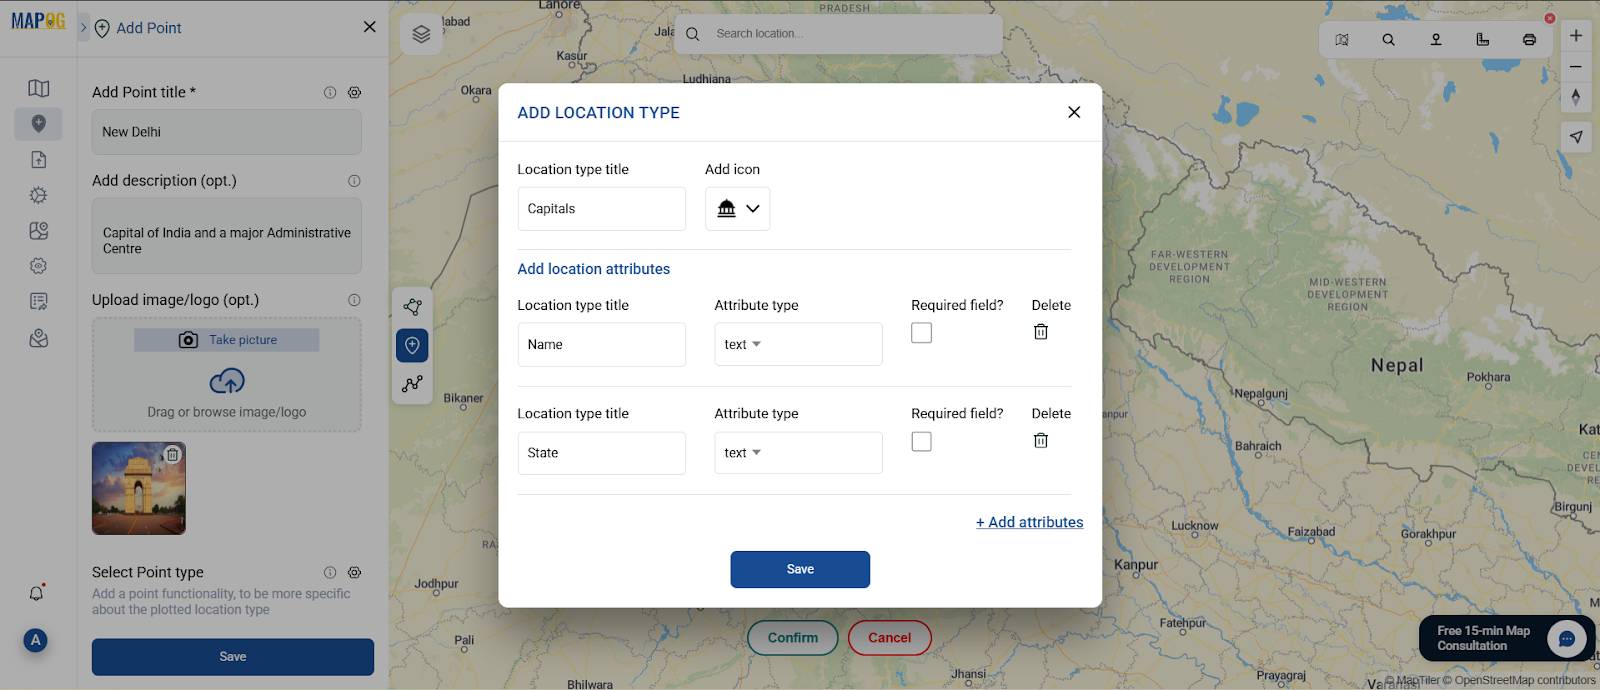
Group Data Using Location Types:
- Open the “Location Type Manager”
- Add categories based on Map type
- Assign a unique icon and color to each location type
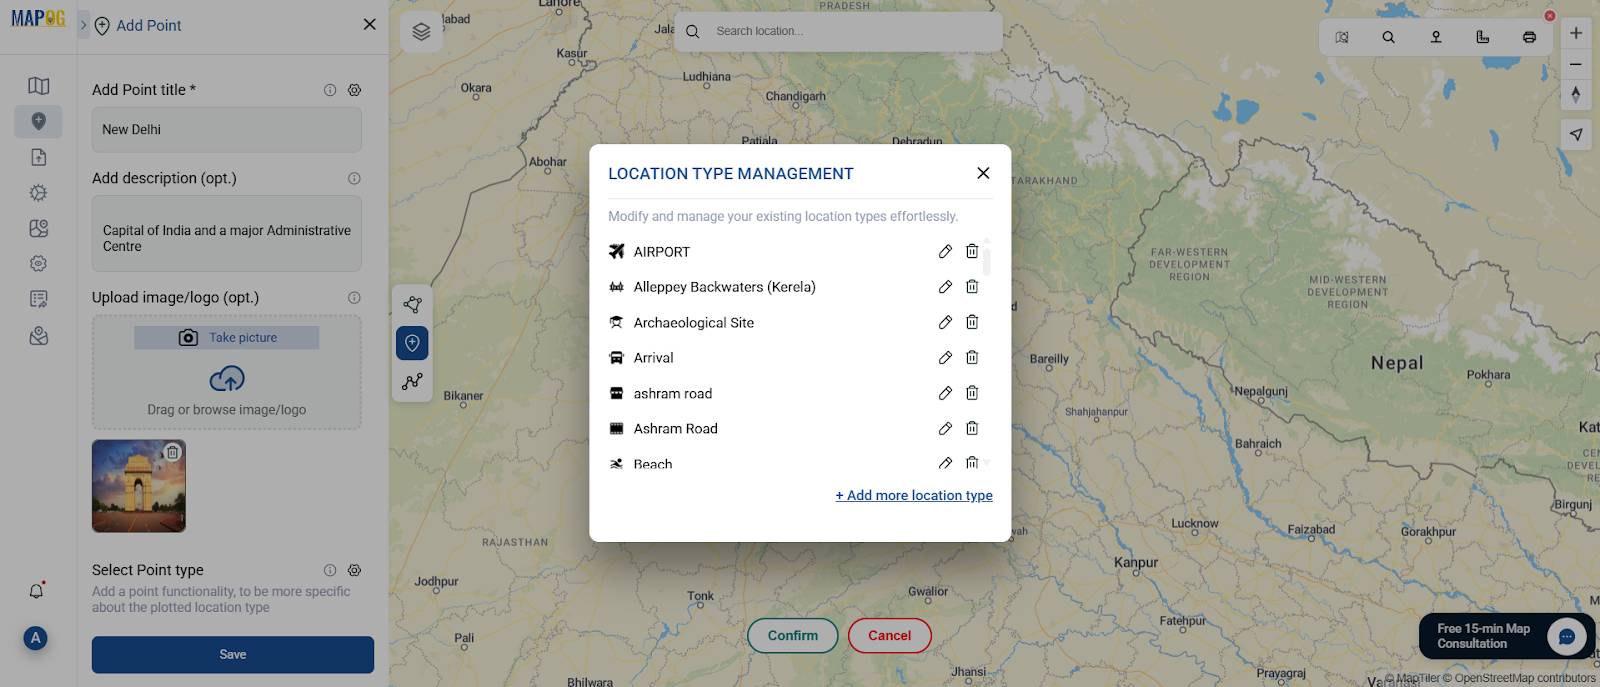
By doing this before styling, you create a well-structured, color-coded map where each point is both informative and visually distinct.
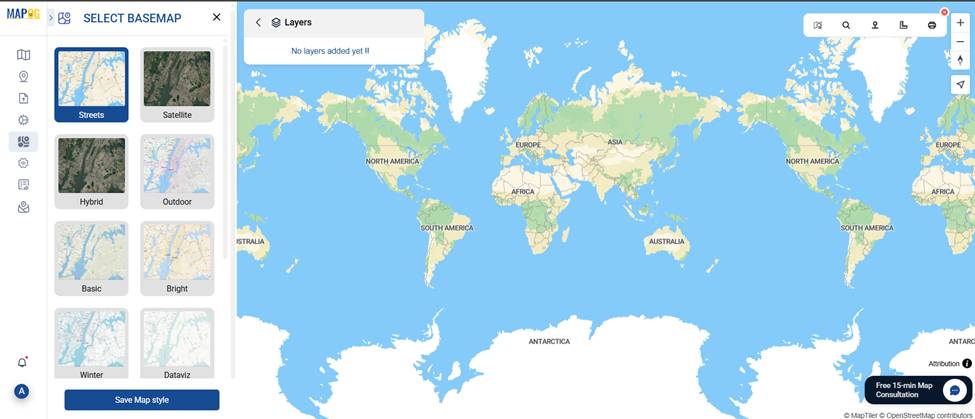
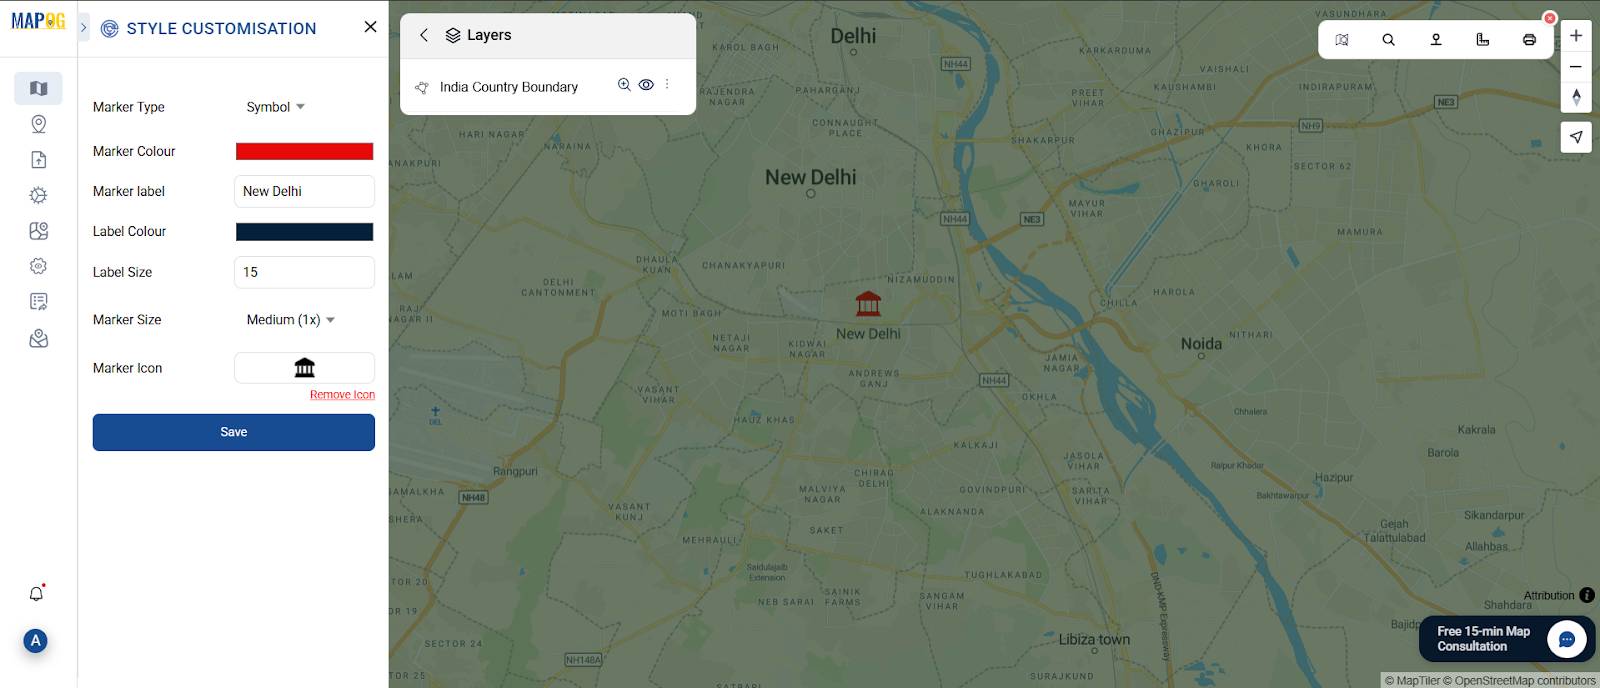
Step 4: Style Your Map and Enhance Readability
Make your map visually appealing and easy to navigate by:
- Using the “Style Customisation” panel to:
- Assign symbols or colors to distinguish data categories.
- Resize icons or adjust their shapes for clarity.
- Apply quantity-based styling if your data includes numerical values.
- Enhance readability with:
- Labels to clearly identify place names.
- A legend to explain the colors or icons used.
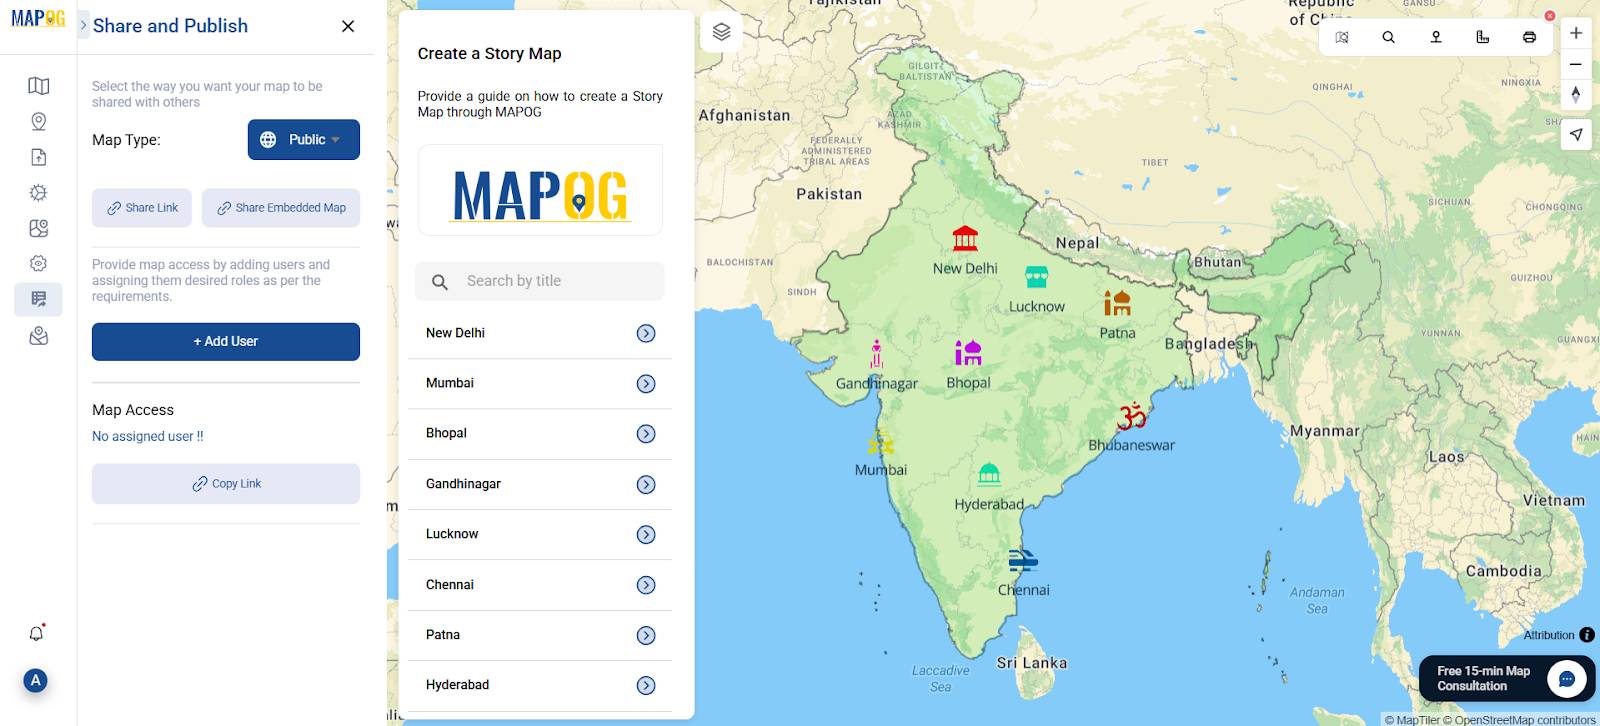
Step 5: Save, Publish & Share Your Story Map
Click on the “Share & Publish” tab:
- Choose visibility: Public or Private
- Copy the Public Link to share via social media or messaging
Industry Use & Benefits of Story Mapping
Story Maps visually connect data to geography, making insights interactive. From classrooms to heritage projects, their visual clarity improves engagement and understanding in ways traditional reports cannot.
MAPOG—equipped with a dedicated Story Map mode, built-in location search, manual point plotting, and seamless multimedia integration—creating rich, location-driven narratives is easier than ever. You don’t need any GIS expertise to build immersive digital stories; just combine interactive maps with images, text, and links. In a matter of clicks, you can transform scattered information into compelling story maps that are easy to explore, share, and understand.
Conclusion: Map, Style, and Share Your Story
Creating a Story Map isn’t just plotting points—it’s transforming complex information into engaging narratives. With MAPOG, you can bring data to life visually, making your insights accessible and interactive. Whether mapping history, heritage, or urban growth, Story Maps connect audiences clearly and compellingly.