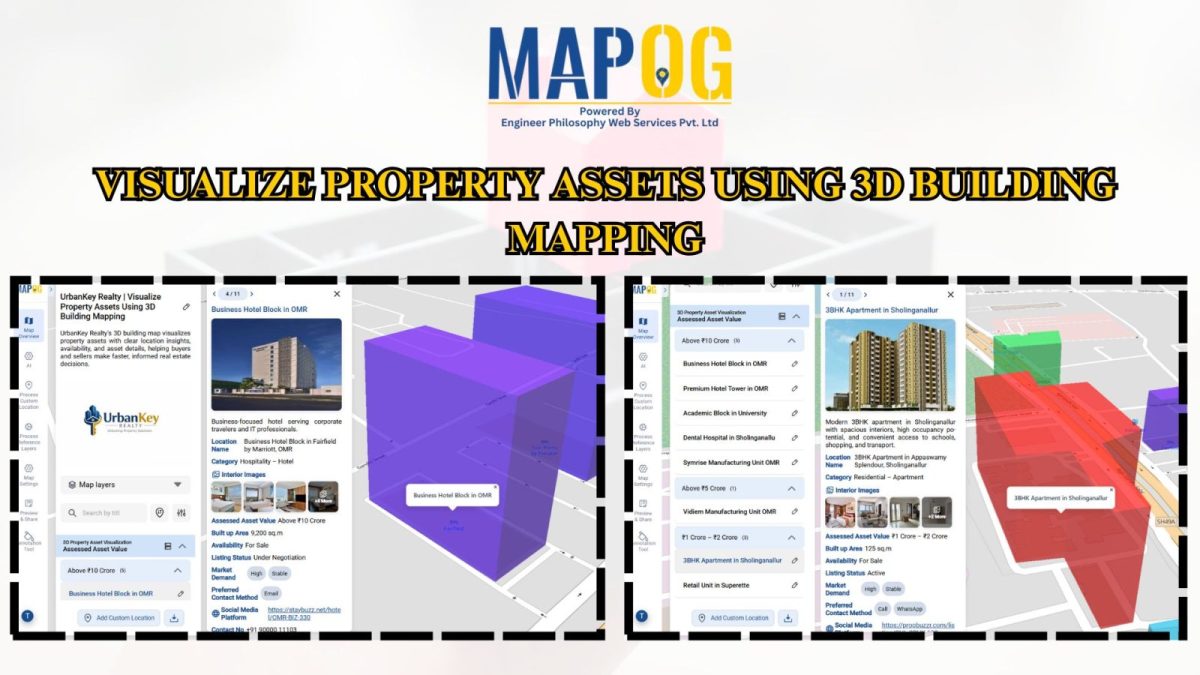
Visualize Property Assets Using 3D Building Mapping
Traditional spreadsheets and flat property listings hide high-value real estate assets to flat rows of data, critical spatial context making it hard to understand location impact, building scale, and asset relationships slowing decisions and increasing guesswork. MAPOG changes this by transforming real estate data into interactive 3D building maps, allowing teams to Visualize Property Assets … Read more