Choosing the right retail location goes beyond guessing where people shop. Instead it’s about recognizing spatial clusters, identifying market gaps, and optimizing coverage. With this in mind, MAPOG, retailers can make data-driven decisions by interpreting customer and store distributions visually. Coupled with heat bubble styling, grid-based analysis, or retail site selection , MAPOG enables smarter planning with fewer tech barriers.
Key Concept: Convex Hull and Retail Site Selection
The Convex Hull in GIS functions like stretching a rubber band around a group of locations—it forms a clean boundary that reflects your business footprint. In retail, this visualization helps you understand coverage, prevent cannibalization by nearby outlets, and pinpoint underserved pockets. It also complements spatial strategies like retail mapping and territory analysis.
Steps to Use Convex Hull Tool for Retail Site Selection in MAPOG
Step 1: Go to the Mapping Platform
To begin with, open your preferred browser and navigate to MAPOG’s website.
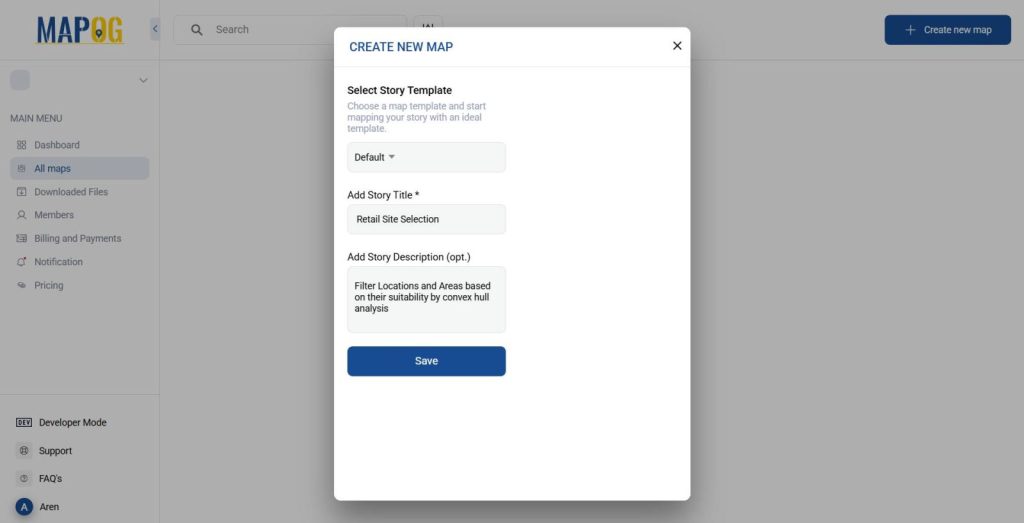
Click “Create New Map” to start a new project.
Then, fill in map’s Title, Description, and optionally upload a Cover Image that represents your project.
Click Save to proceed.
Step 2: Upload the Data
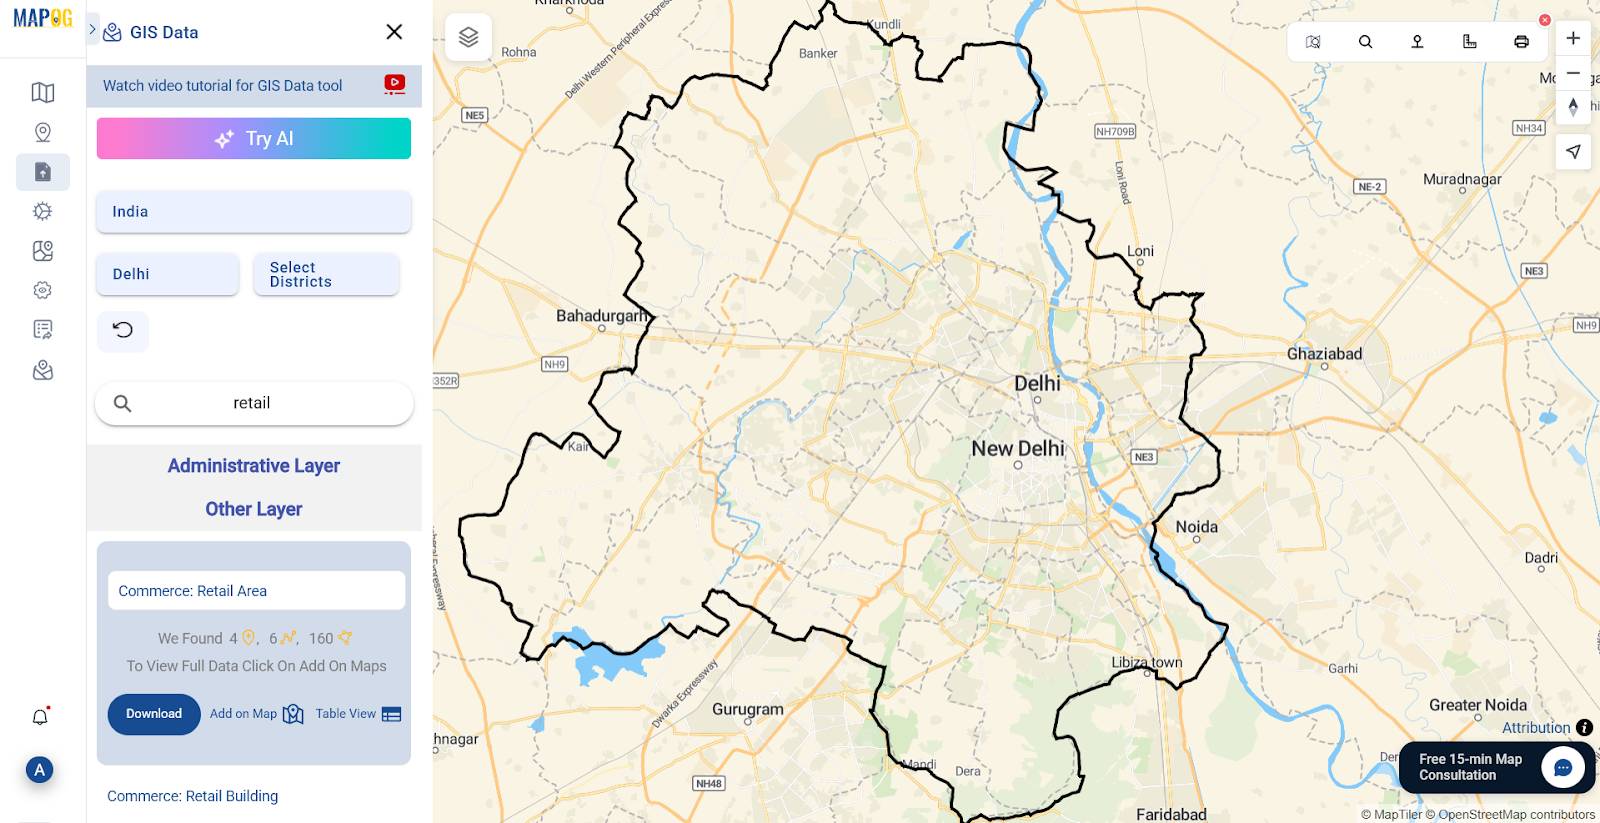
You can also use the layers provided by MAPOG under the “GIS Data” option in the “Add/Upload Data” menu. The layer: Commerce: Retail Areas is a good option for finding suitable retail locations and is used for this process.
Step 3: Launch the Convex Hull Tool
After that, on the left panel, click on “Process Data” and select “Convex Hull” from the available tools.
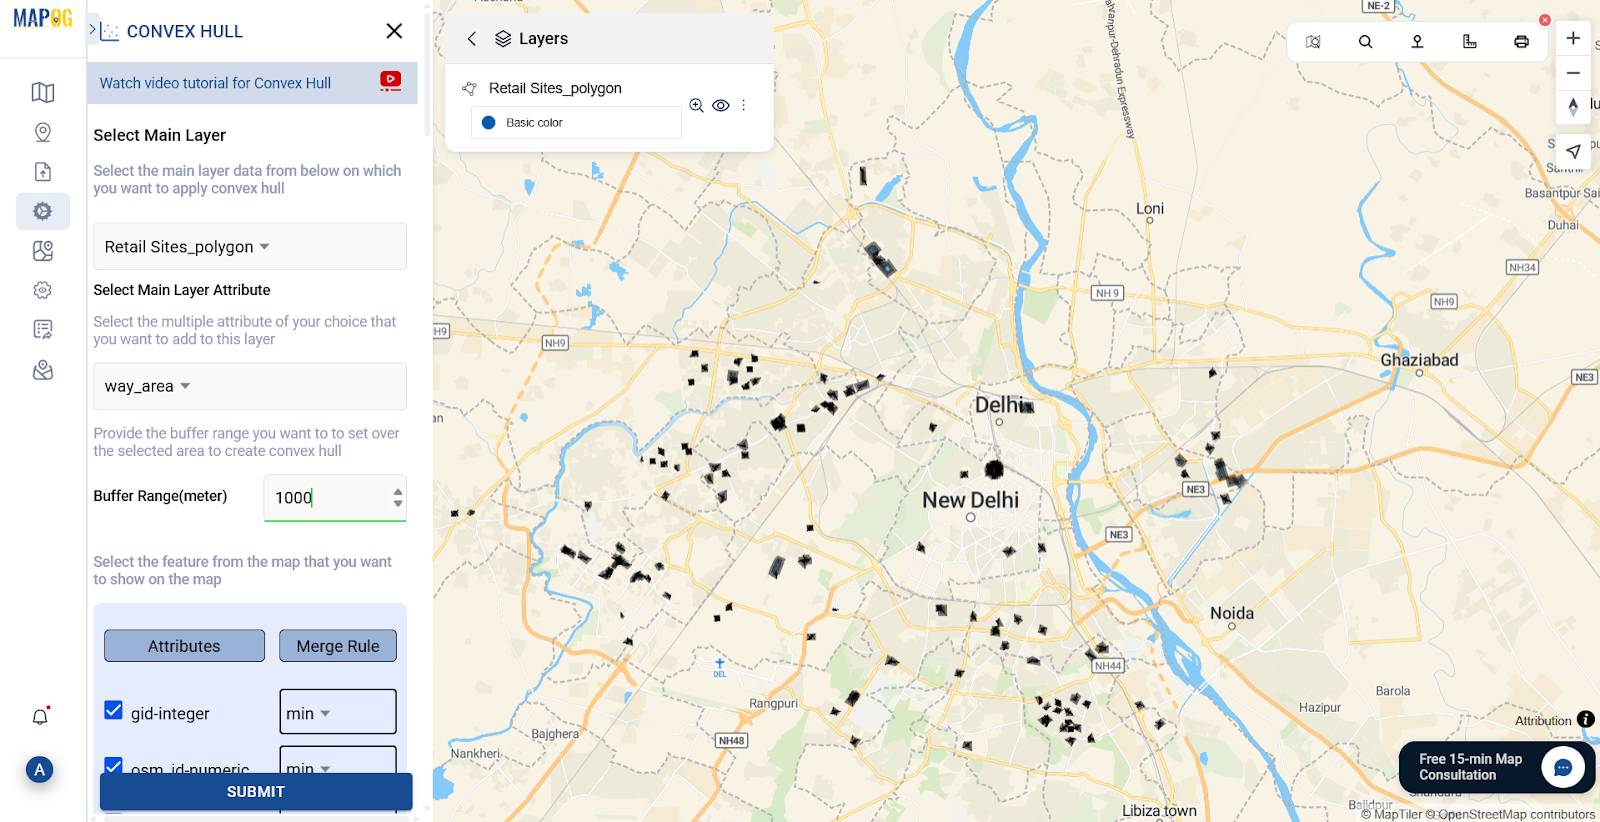
Choose your Commerce: Retail Areas layer in the “select main layer” option. If needed, select specific attributes (like store type, region, etc.) to group the hulls.
Then, define a buffer around the hull. For example: 500-1000m can represent walkable range or delivery limits.
Click “Submit.”
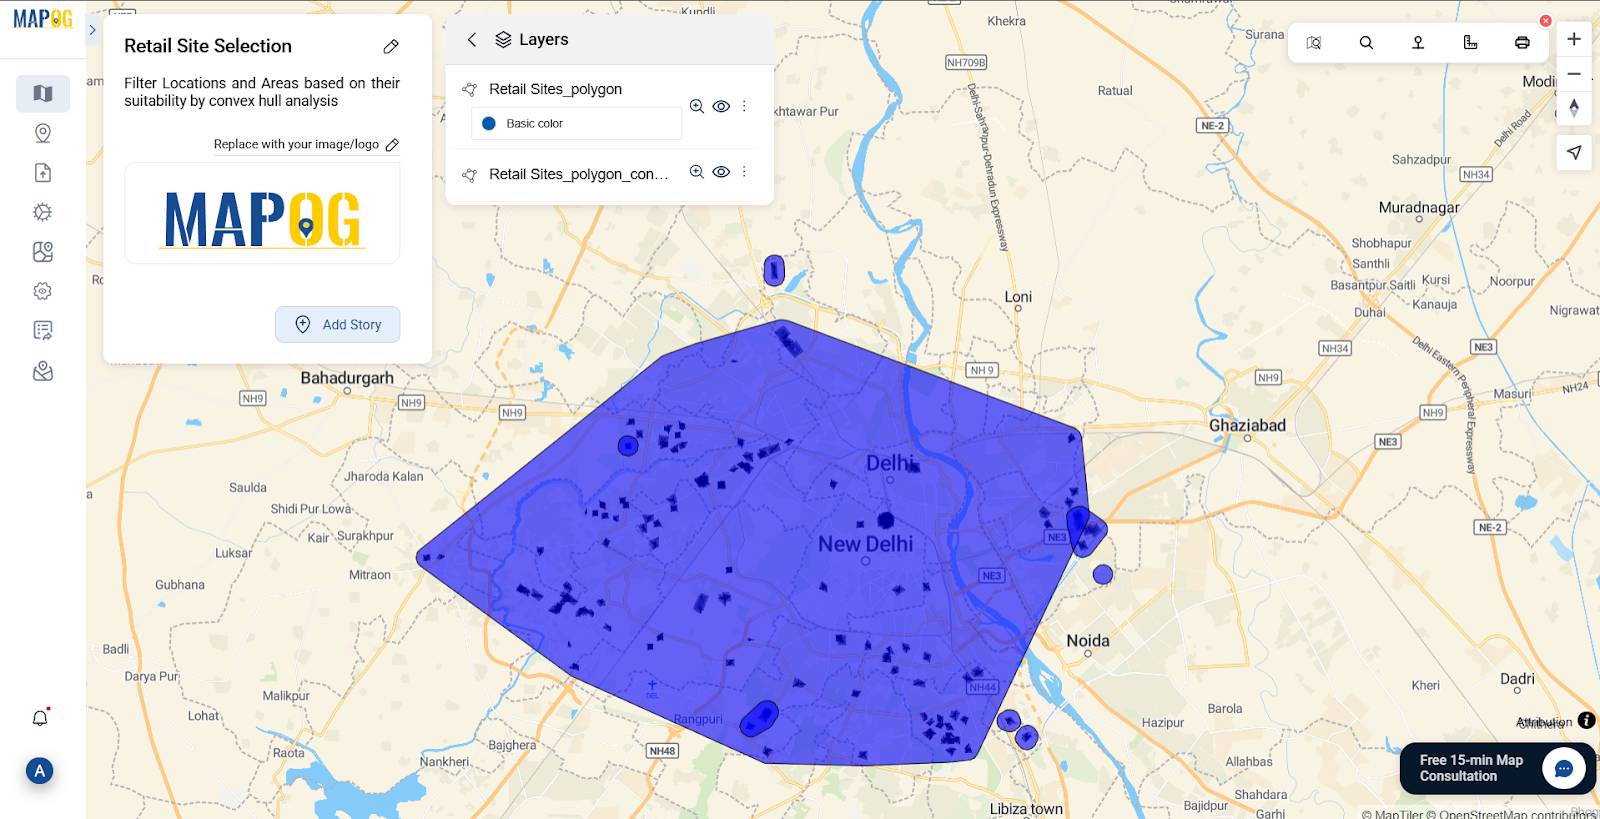
MAPOG will instantly process and display the Convex Hull on your map.
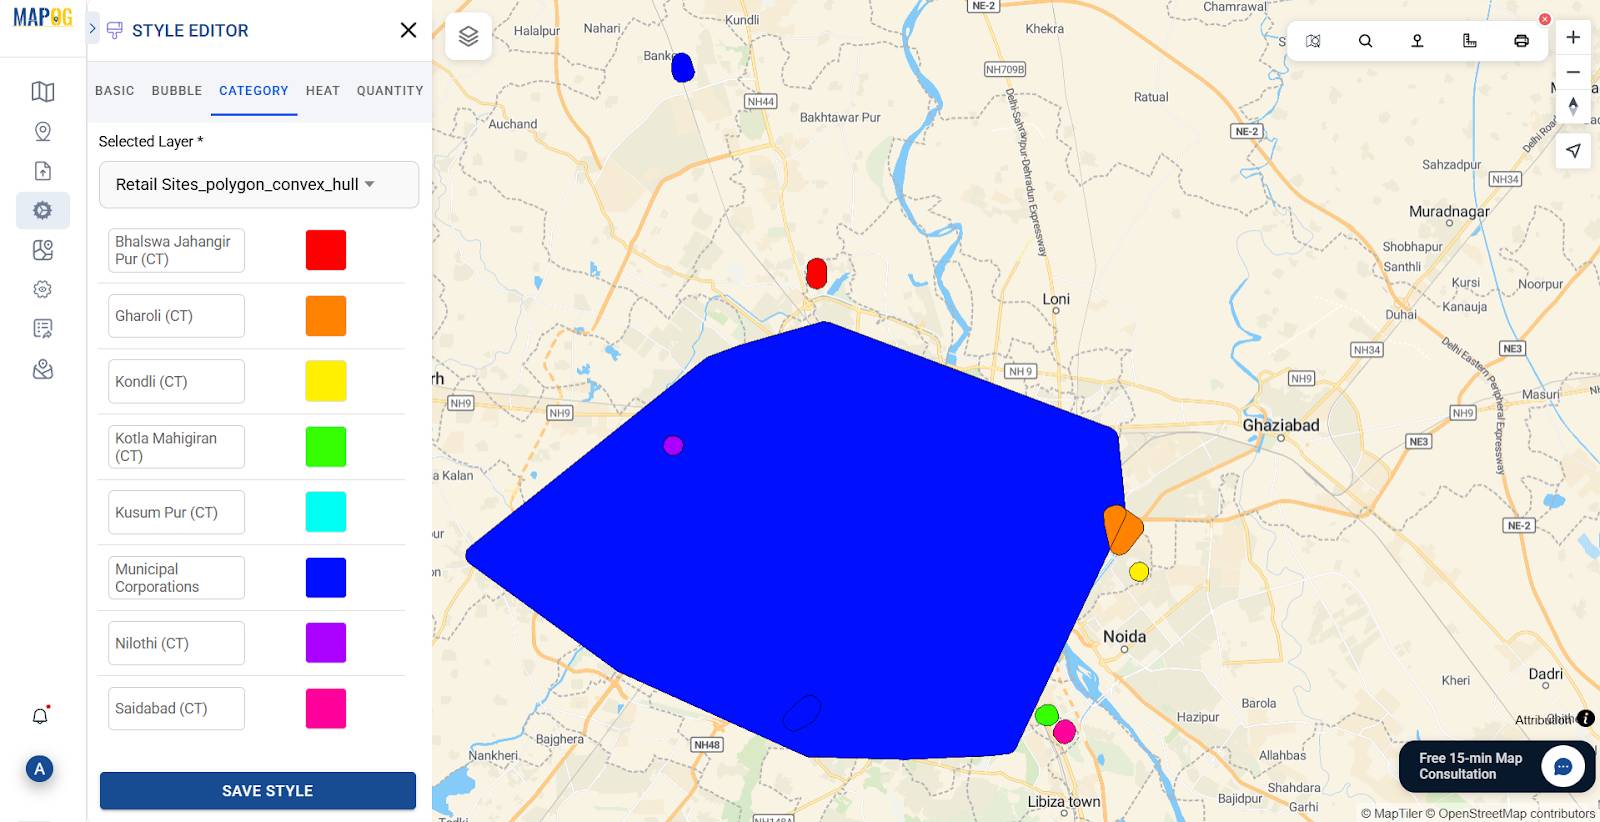
Step 4: Style Your Hull
Following this, use the “Style Layer” & choose the category option to categorize your layer on the basis of attributes & make the hull visually distinct.
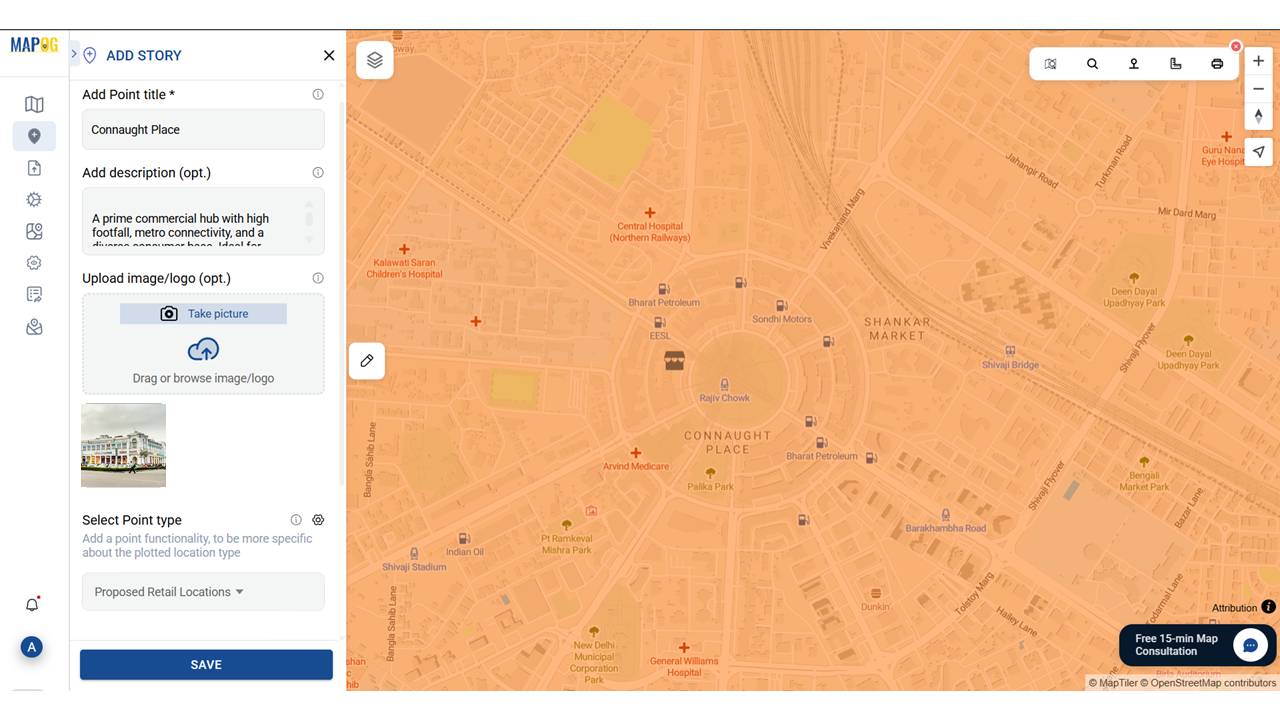
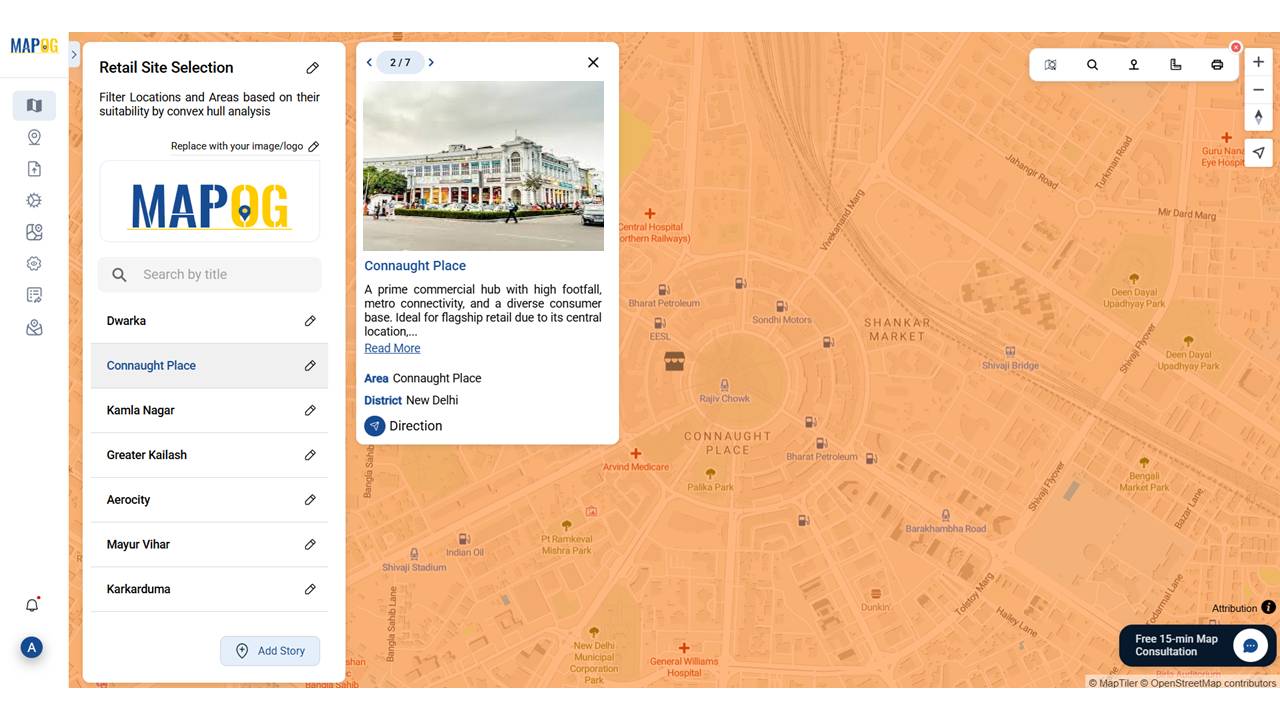
Step 5: Add Proposed Retail Store Locations
Click on “Add Story” from the top toolbar to place your proposed retail locations on the map manually.
Provide each point with a relevant name and description and cover image.
You can also select your point type from the list.
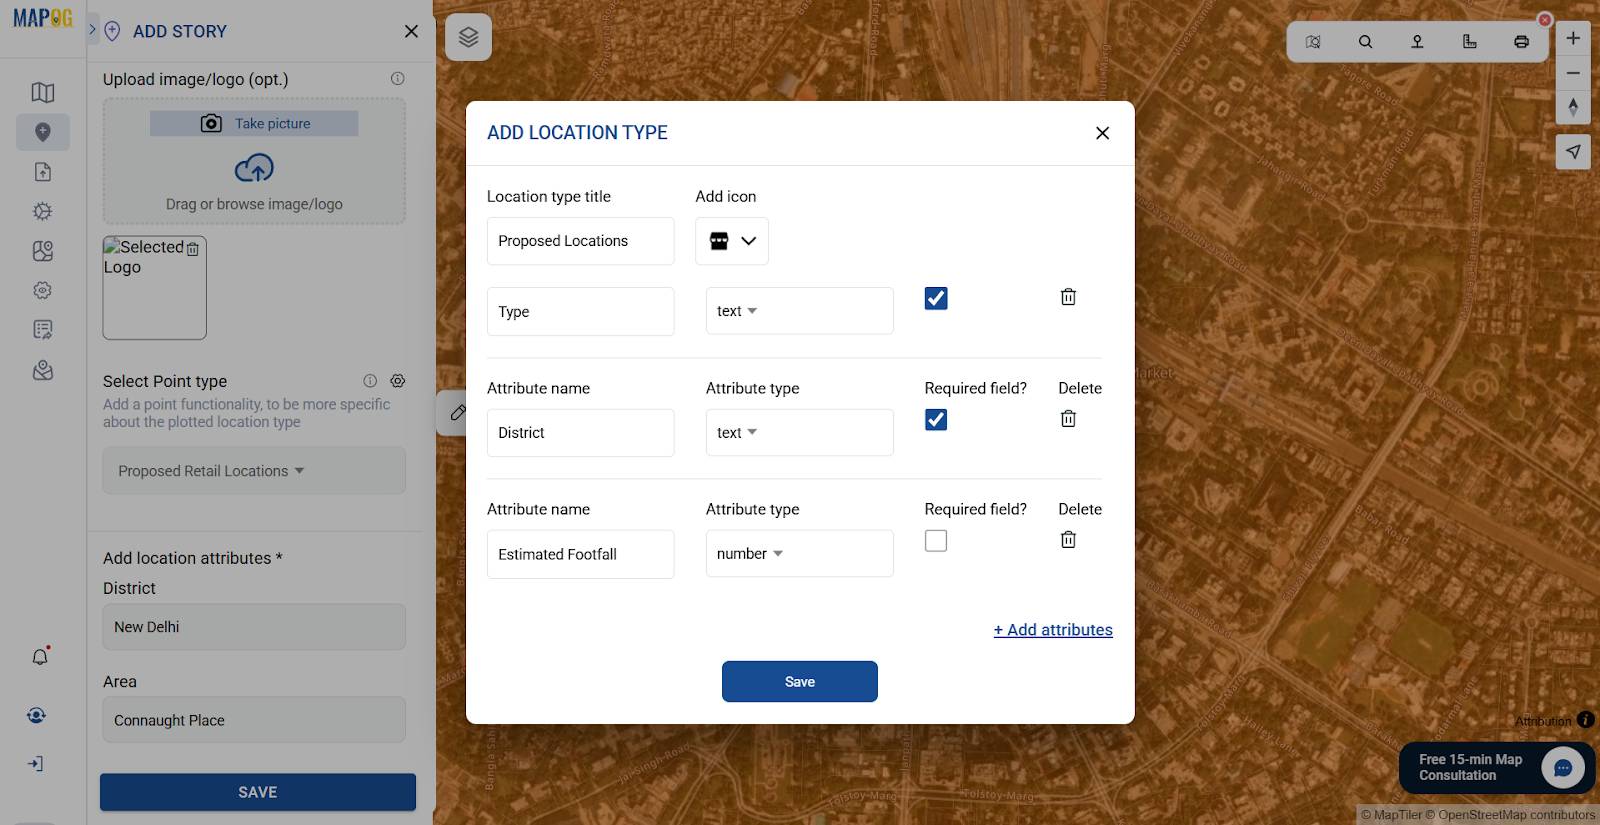
Additionally, you can add a point type or edit the previous point types by clicking on the settings icon.
The location type management panel will appear, Edit previous point types or “add more location type”.
Add a name, icon and attributes like region, estimated footfall, or data type and select if it’s required for the point type. Then click on save, and repeat the same process for all the other points.
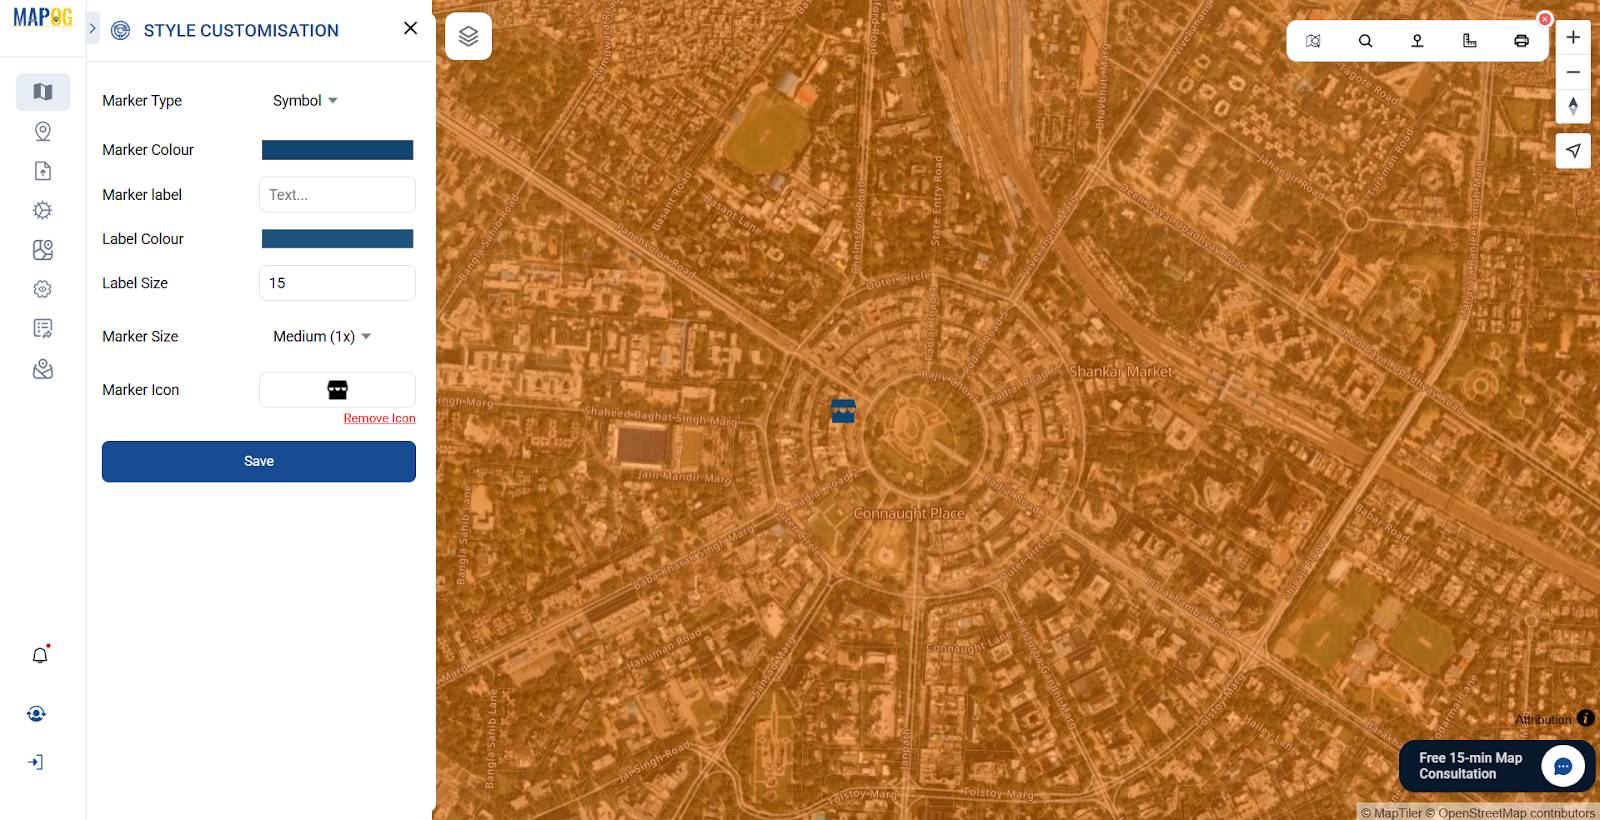
Your Points will appear on the map. You can now click on each story point to view its location and details on the map. You can customise these points by going to the point customisation option by clicking the edit button on these points.
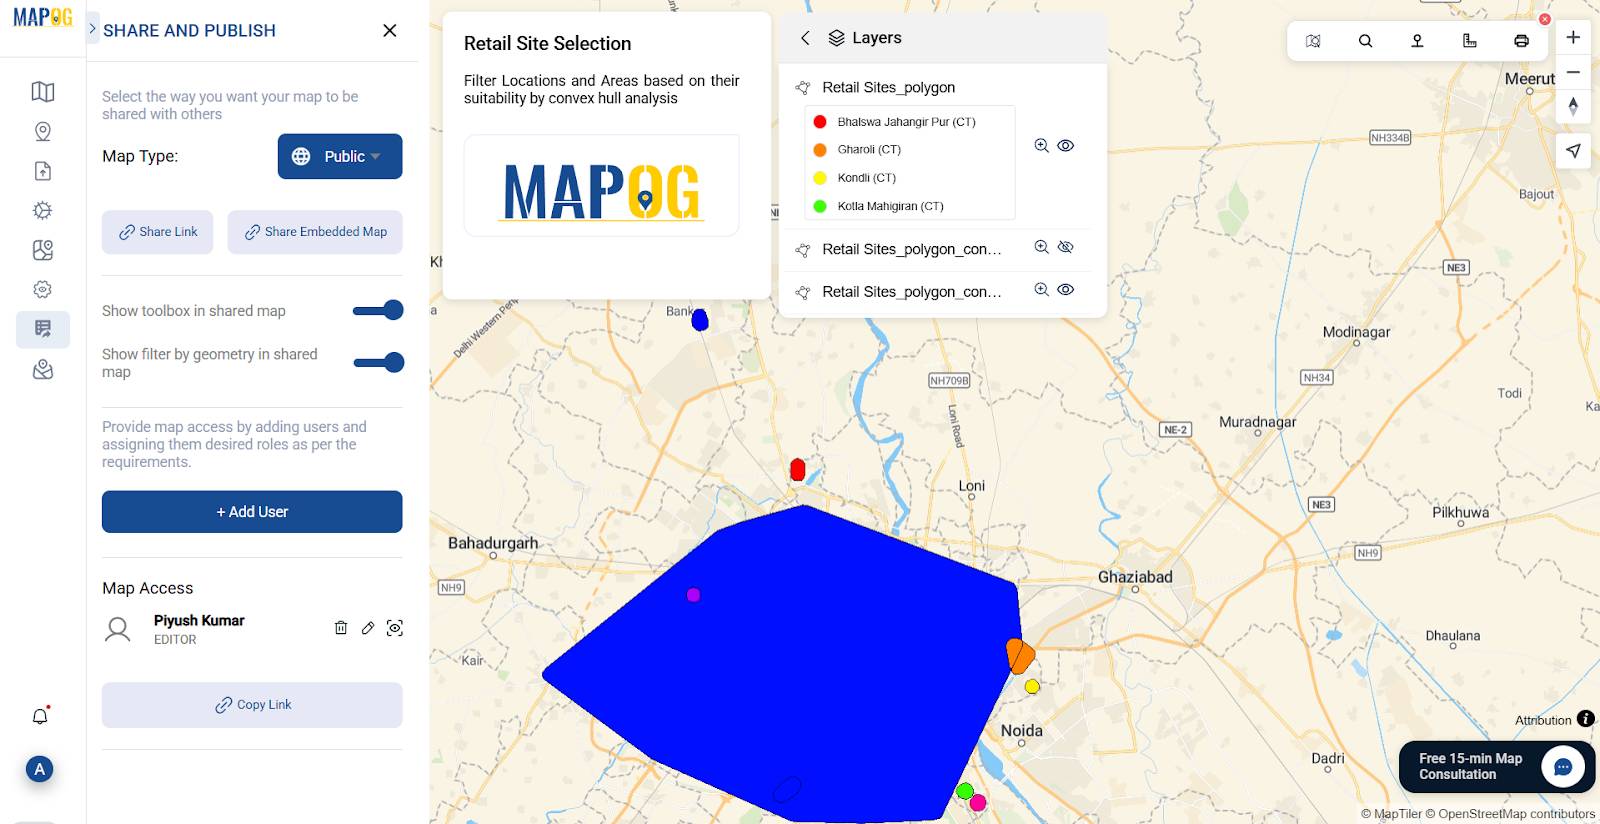
Step 6: Save and Share
After adding data to your map, under the Preview and Share option, you can click Save to preserve your project.
You can choose to make your map public and invite collaborators or keep it private.
Industry Applications
Therefore, convex Hulls simplify big questions and support smarter planning:
- Franchise Expansion: Set non-overlapping zones to guide new outlets.
- Delivery Optimization: Map influence areas for central kitchen or warehouse placement.
- Customer Mapping: Upload survey data to visualize loyal customer concentrations.
- Competitor Analysis: Overlay your area with competitors to identify white spaces.
While not a replacement for deep demographic or rental analytics, Convex Hulls provide a fast, intuitive baseline for retail strategy.
GIS DATA USED:
Conclusion
Convex Hull may seem simple, but it delivers powerful spatial clarity. For retail planning, it visualizes your market in ways charts can’t. In MAPOG, it’s easy, insightful, and helps you ask: where are we strong, and where should we expand?
So start with a hull—it could guide your next top-performing store.
Explore more with these MAPOG articles: