Historical events have, over centuries, shaped civilisations and cultures. Consequently, mapping history with GIS tools provides new insights into how past events unfolded geographically. As a result, this promotes deeper engagement, improves retention, and simultaneously encourages an immersive way of exploring timelines and stories. Moreover, by integrating GIS tools with historical data, storytelling becomes more dynamic, interactive, and accessible—thus bridging the gap between geography and time.
Key Concept: Why Mapping Historical events Matters
Mapping history helps us understand not only where something happened but also why it happened there. For instance, from colonial expansions and independence movements to ancient empires and key revolutions, geographic context clearly reveals the bigger picture. Therefore, history maps ultimately serve as powerful tools in education, tourism , museum design, and public memory.
Importance and Uses of Historical Event Mapping
Historical maps fulfill a wide range of functions across sectors:
- Educational Enrichment – In particular, bring textbooks to life by visualizing locations tied to historical milestones. This approach not only boosts student engagement but also encourages critical thinking.
- Cultural Understanding – Additionally, trace migration, trade, war, and diplomacy across regions and timelines to better understand shared human experiences.
- Tourism and Heritage Trails – Likewise, create location-based historical tours that guide visitors through cities or regions via past events.
- Community Engagement – Furthermore, share local stories and events—such as resistance movements, landmark decisions, or cultural beginnings—on a digital map.
- Policy and Research – As a result, support urban planning, heritage conservation, and academic work through geospatial historical datasets.
Methodology: Creating a Historical Map Story Using GIS
1-Selection of Historical Events
Start by listing the major events you want to map. These could be:
- India’s Freedom Struggle milestones (e.g., 1857 Revolt, Dandi March, Quit India Movement)
- Major world wars or treaties
- Revolutions or independence movements across countries
2-Collection of Geographic Coordinates
Once selected, find accurate coordinates for each event’s key location (city, battlefield, route).
- Event Name
- Location
- Latitude
- Longitude
- Date
- Description
3-Create a New Story –
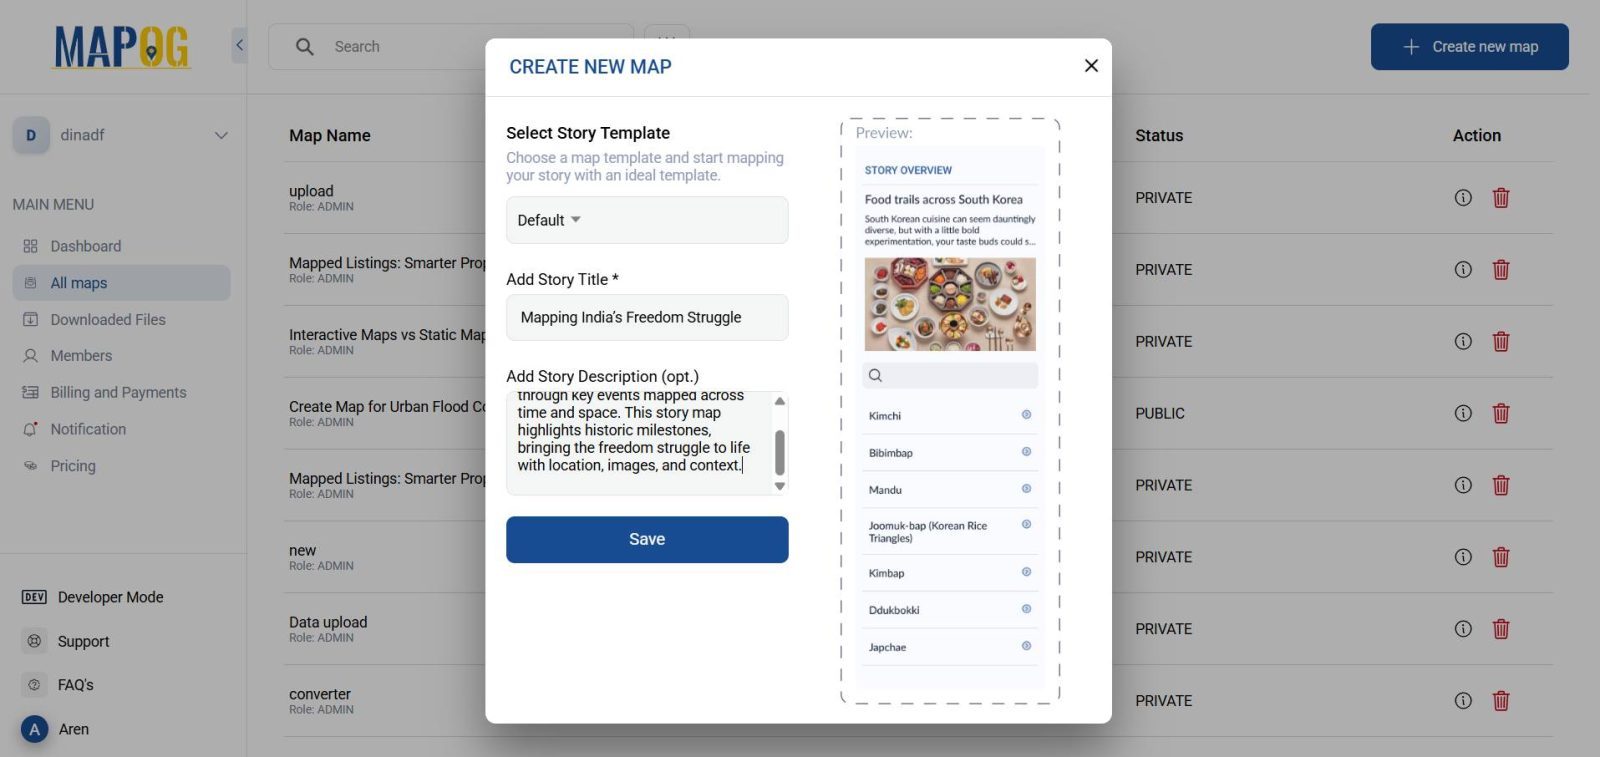
On the MAPOG platform, click “Create New” to begin your map story. Title it, for example: “Mapping India’s Freedom Struggle: A Visual Timeline.” Add a description like: “This map traces major milestones in India’s fight for independence, allowing users to explore where key events unfolded.”
4- Adding Points Manually –
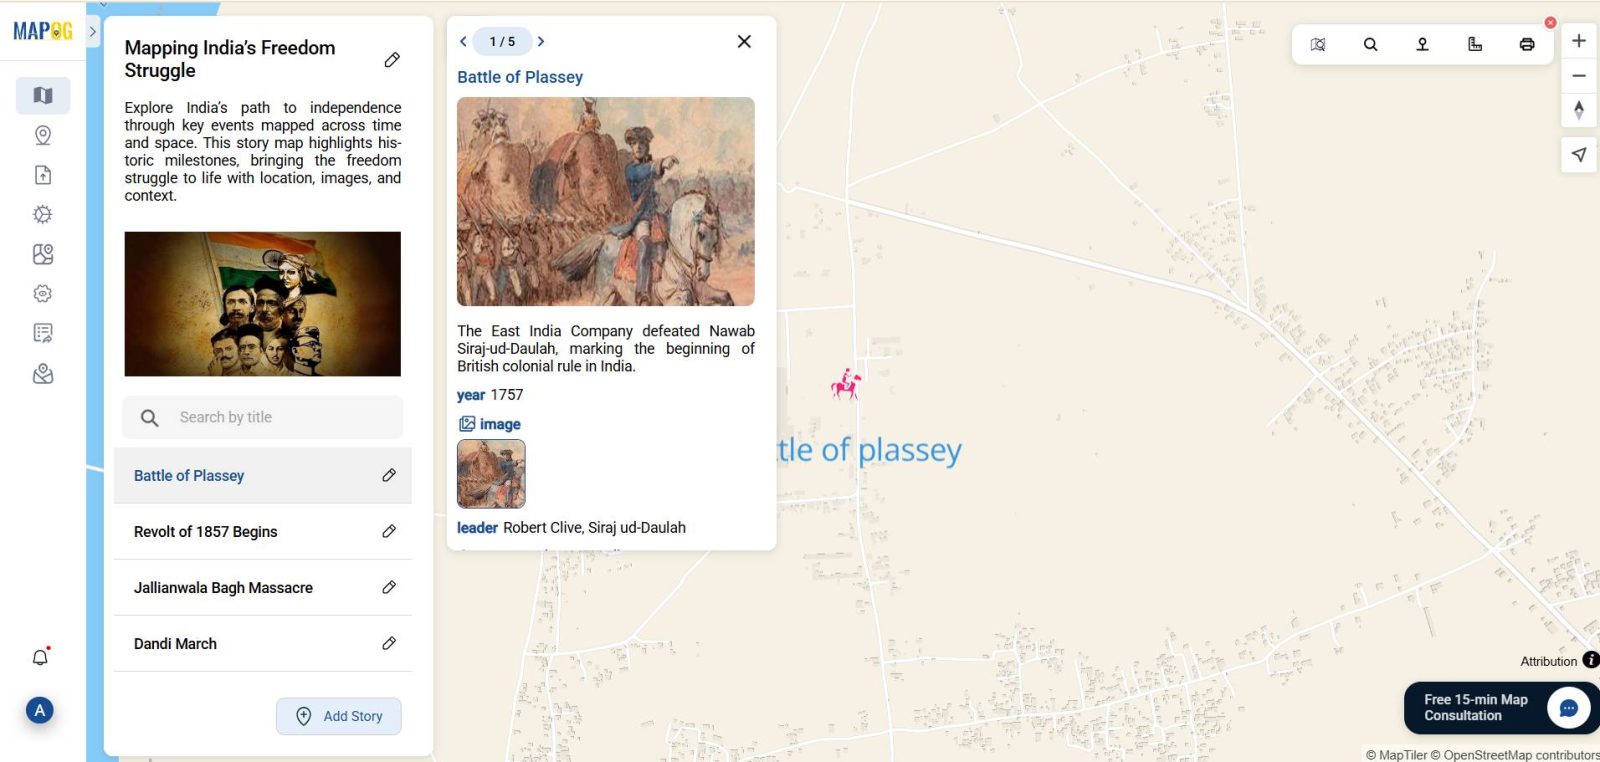
Use the “Add Story” option and add manually the points on the location you are choosing. Under “Location Type Management,” create a new type such as “Historical Event”. Add custom attributes like Event Name, Year, Leader(s), Description, Outcome, Visual Link, or Source. Manually enter the latitude and longitude into the map using the toolbox option.
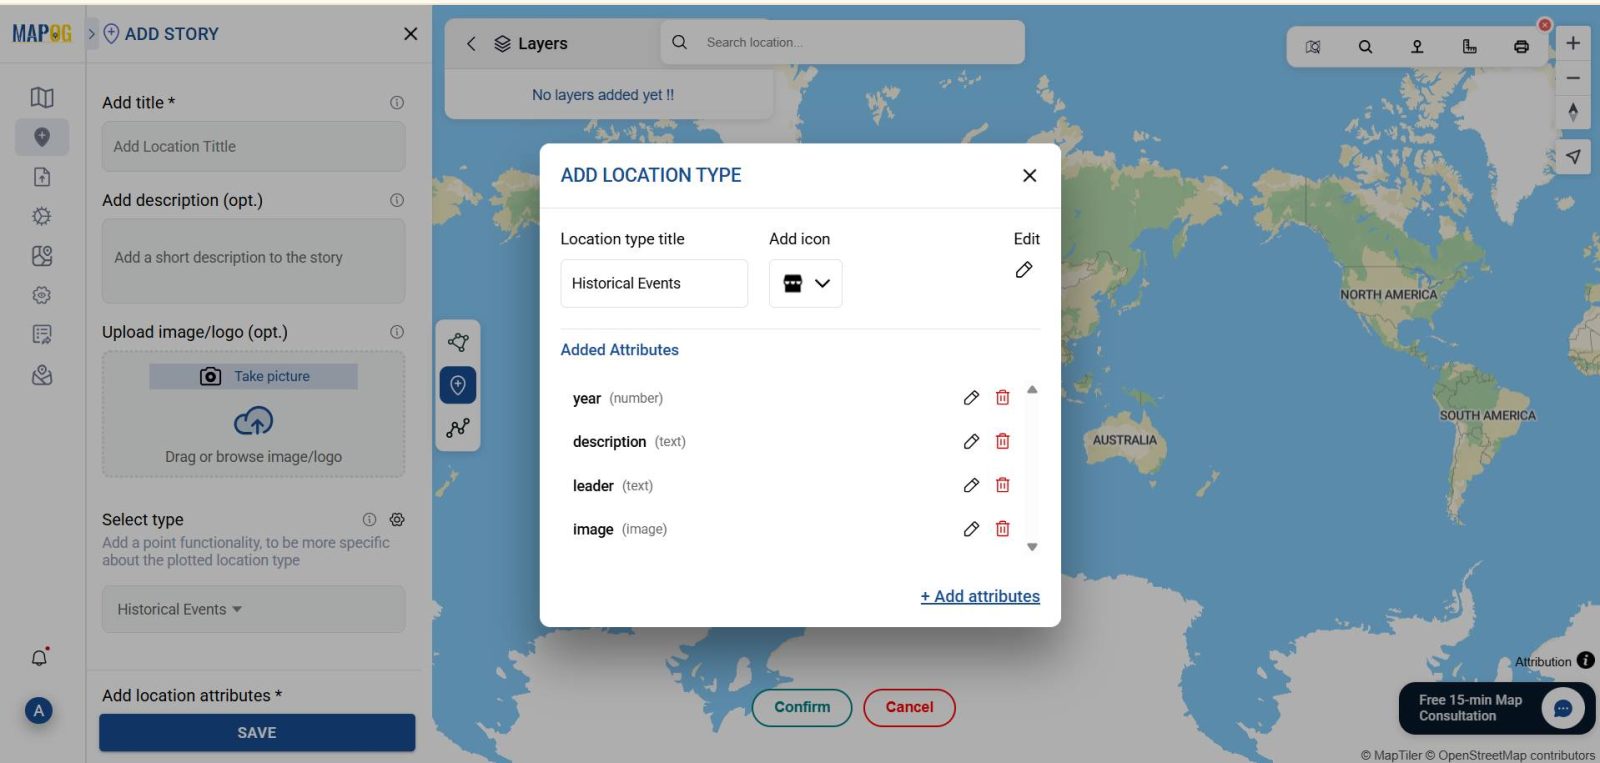
For each point:
- Label it with the event name
- Upload an image (optional)
- Include a brief but compelling description of the event
- Fill all the attributes information & hit save.
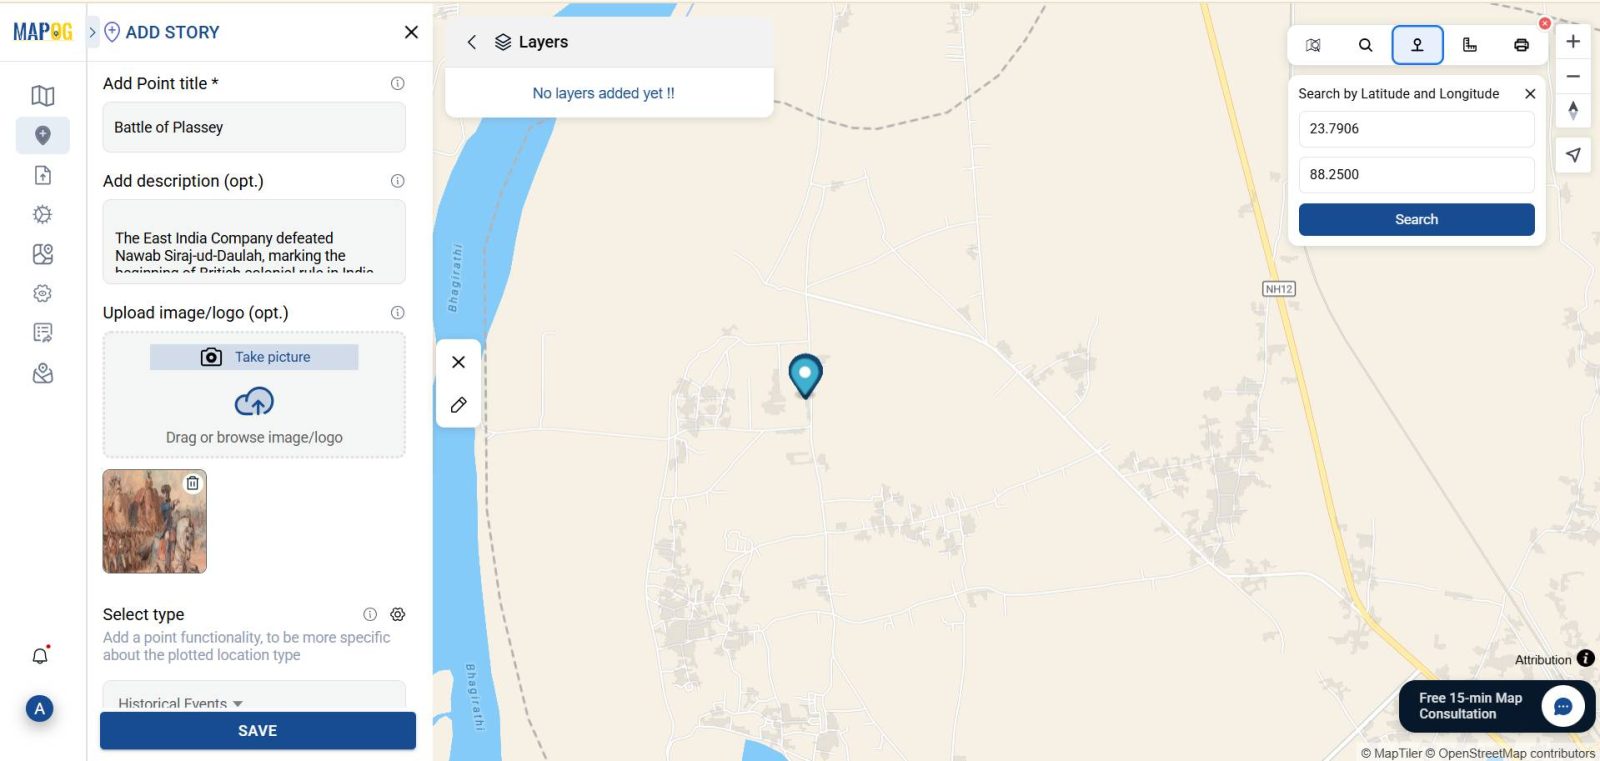
Repeat for all chosen historical events.
5-Styling and Timeline Visualization–
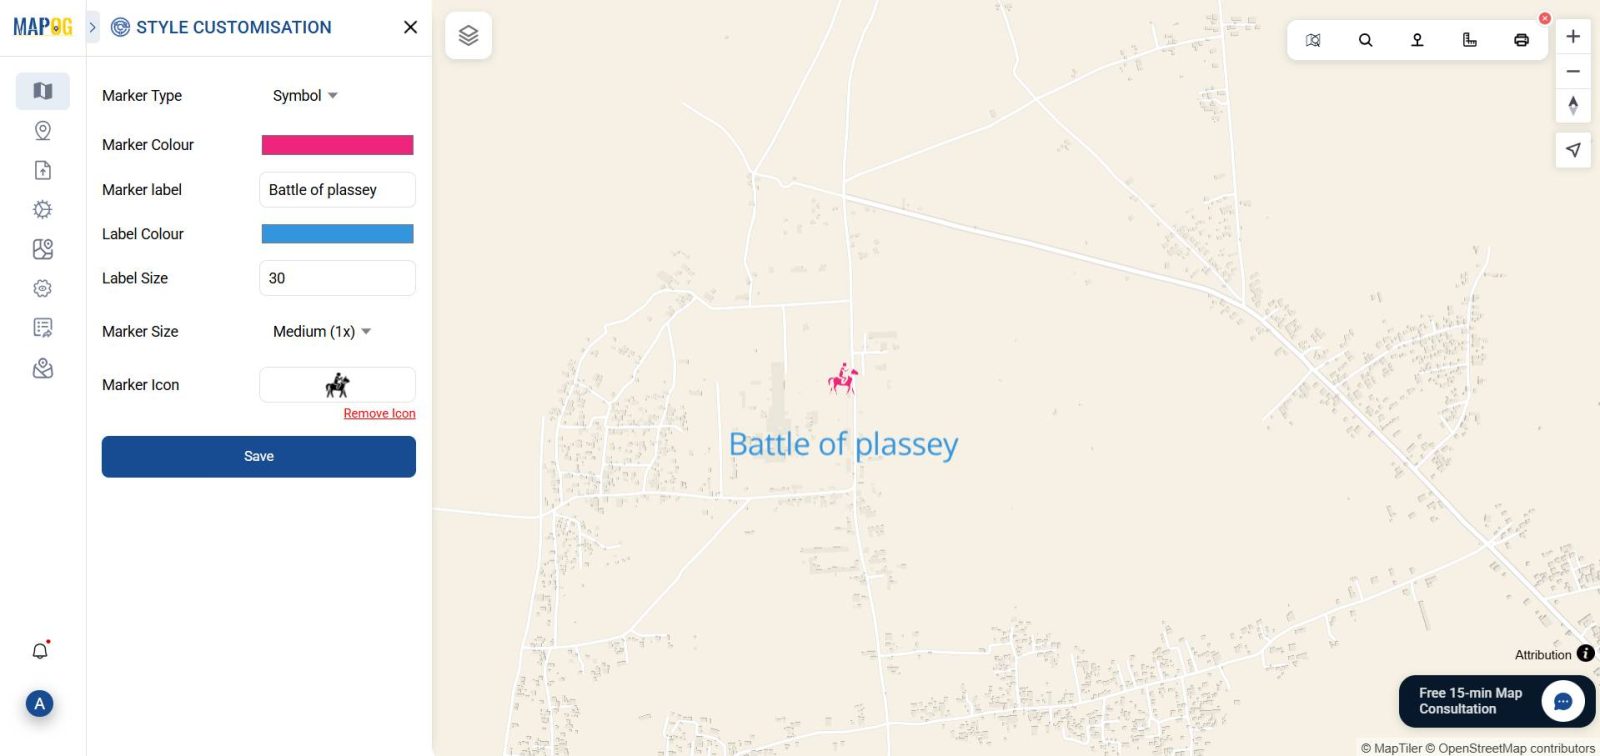
Finally Customize your map using the Point customization options:
- Use different icons or colors based on themes (revolts, marches, declarations)
- These enhancements make the story clearer and more compelling.
6-Publishing and Sharing –
Once satisfied with your story map, use “Share & Publish” option to make it private or public. You can embed the map into educational blogs, digital exhibits, classroom modules, or heritage apps.
7-Preview and Share
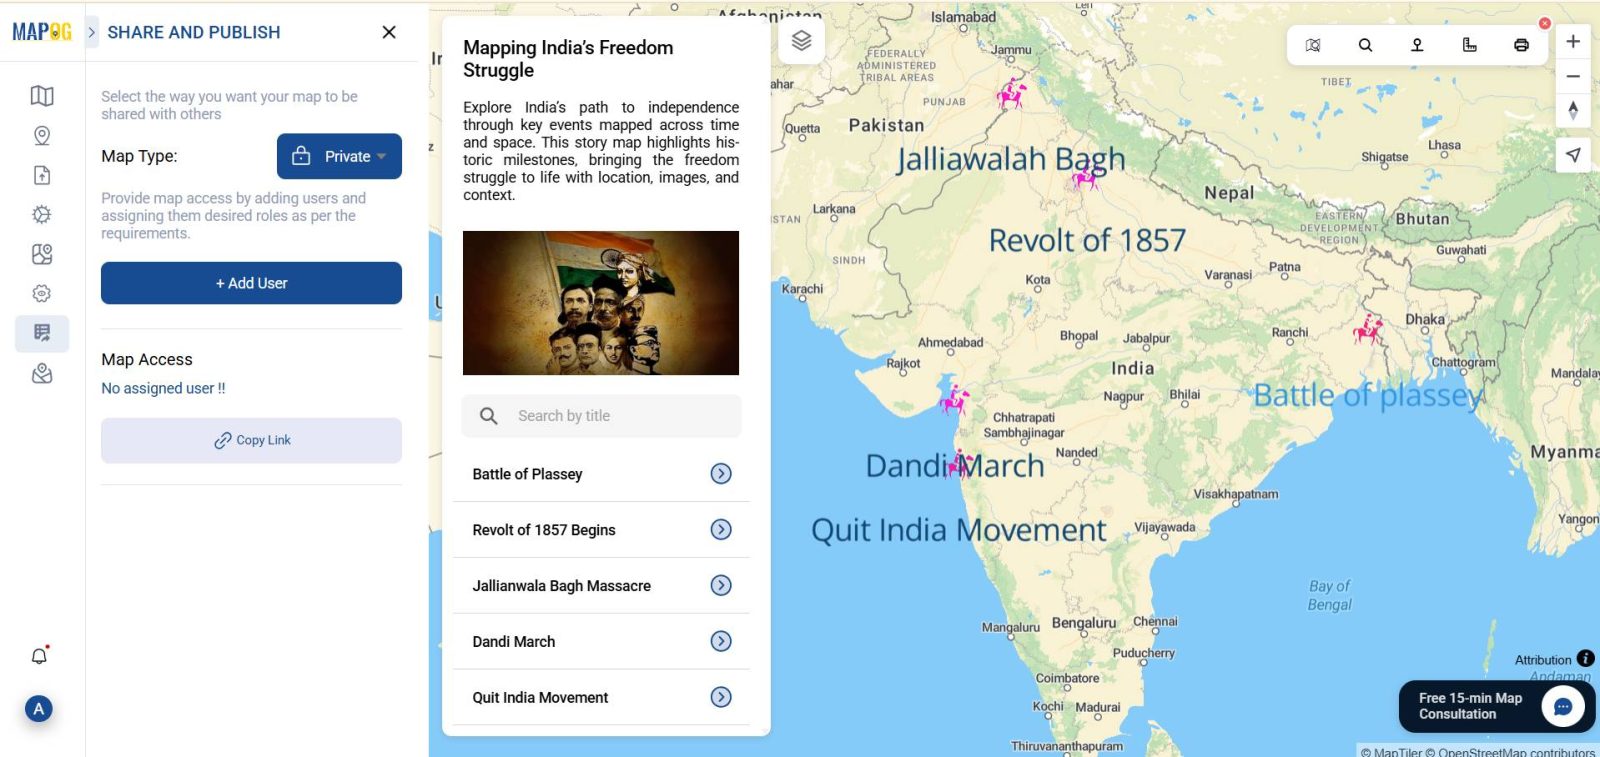
The final result is a map that helps users explore history visually and interactively.
Industry and Domain
Industry: Education, Journalism, Cultural Heritage, EdTech. In particular, historical mapping can support curriculum design, enhance museum narratives, enrich historical journalism, and strengthen documentary platforms.
Domain: Social Sciences, History, Geography, Heritage Conservation. Moreover, maps built on MAPOG are effective tools in classrooms, archives, and community initiatives, especially those aimed at preserving memory and fostering learning.
Conclusion
Additionally, mapping history using GIS brings static events to life—by placing them back in their real-world geographical context. Through MAPOG , learners, educators, and creators can therefore transform timelines into map-based visual journeys.
Exploring Our Previous Blogs
- How GIS and Smart Mapping Reduce Urban Heat Islands
- GIS in Infrastructure Development and Road Network Analysis
- Flood Risk Mapping with Interactive Web Maps: SaaS Approach
- Optimizing Warehouse Location Selection with GIS for Supply Chain Efficiency
- Role of GIS In Irrigation Planning and Water Resource Management