Interior design teams often struggle with multiple site visits, scattered updates, delayed follow-ups, and low project visibility. When data is spread across tools, coordination slows and decisions take longer. Manage Interior Design Site Visits with MAPOG by bringing all locations, visit status, tasks, timelines, and teams into one clear, interactive map with real-time data, improving coordination, visibility, accountability, and faster data-driven decisions.
Key Concept: Manage Interior Design Site Visits
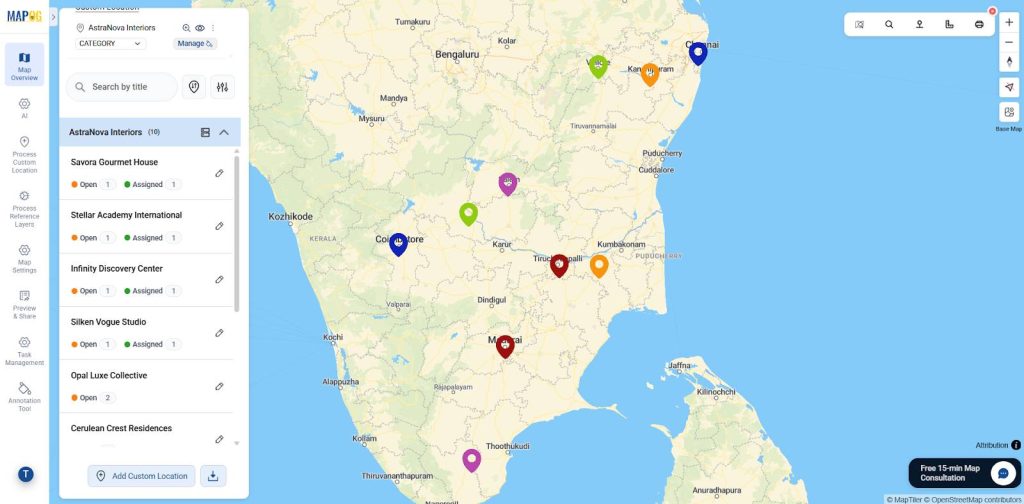
Interior design site visit mapping uses an interactive map to display exact project locations with linked details such as visit status, assigned designer, purpose, and timeline, enabling teams to track and manage visits visually instead of using spreadsheets or manual lists.
Methodology: Manage Interior Design Site Visits
Task Management Workflow
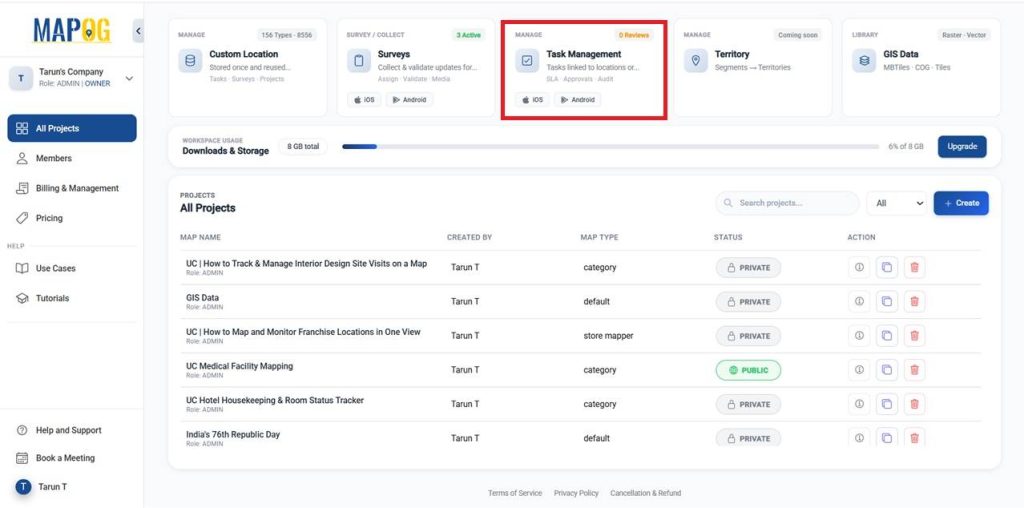
First, open MAPOG and go to the Task Management Dashboard to control all interior site visits and tasks in one place.
Create and Manage Custom Locations & Templates
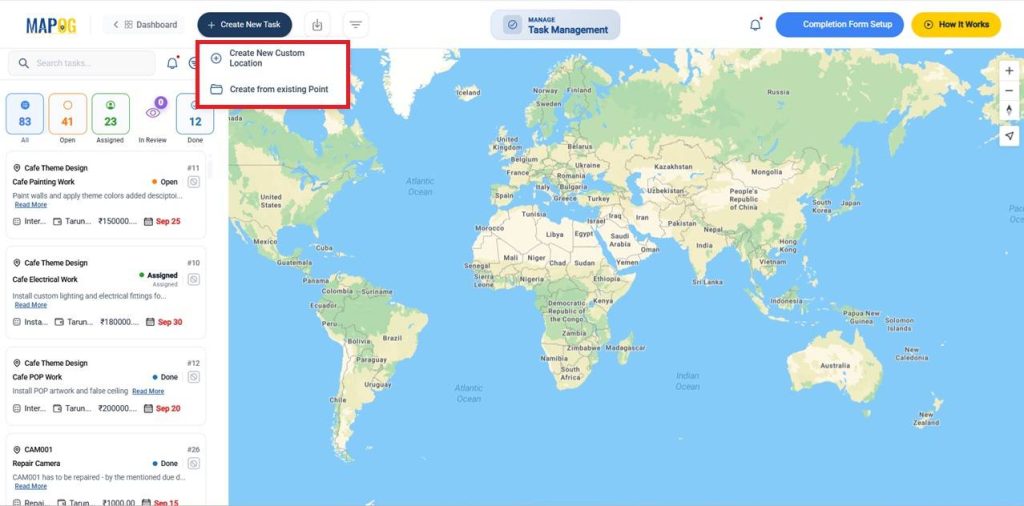
Click + Create New Task, then choose Create New Custom Location for a new site, or select Create from Existing Point to track work on an existing site.
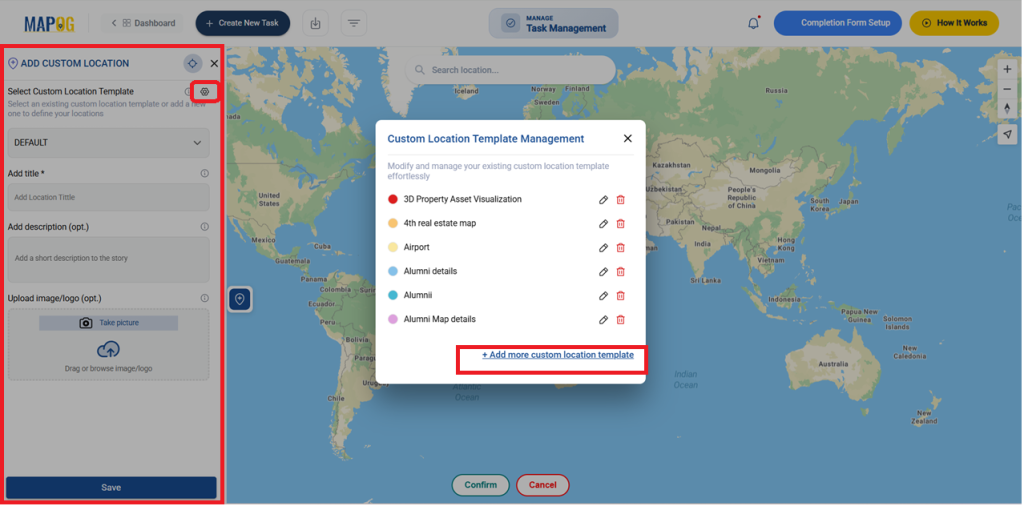
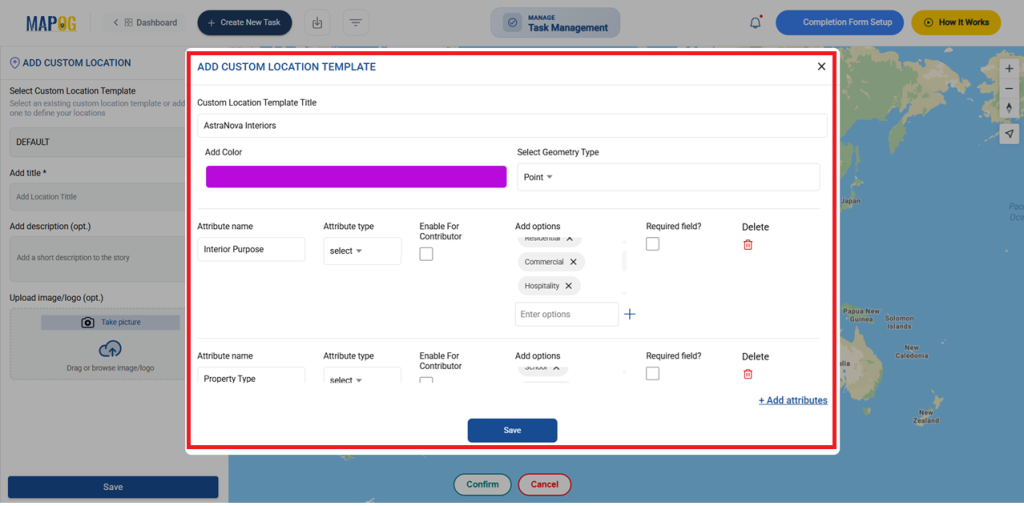
After selecting Create New Custom Location go to the settings of Custom Location Template, To standardize attributes and library data, reduce errors, and speed mapping. Then select + Add more custom location template.
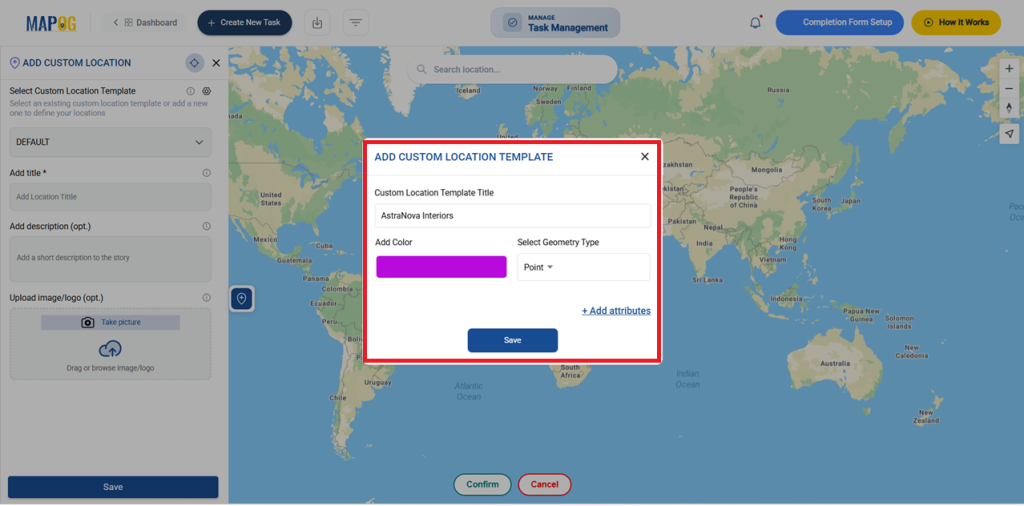
Enter the template title, choose a color, and set the geometry type as Point to mark the exact site location on the map. Then select Add Attributes to store location details to define reusable interior site attributes.
In Add location attributes, Add attributes like Interior Purpose, Property Type etc.., and type as text, select ,image, to structure attributes such as interior purpose and property type..After adding all attributes, click Save. The template will be stored.
Customize Your Task Completion Forms
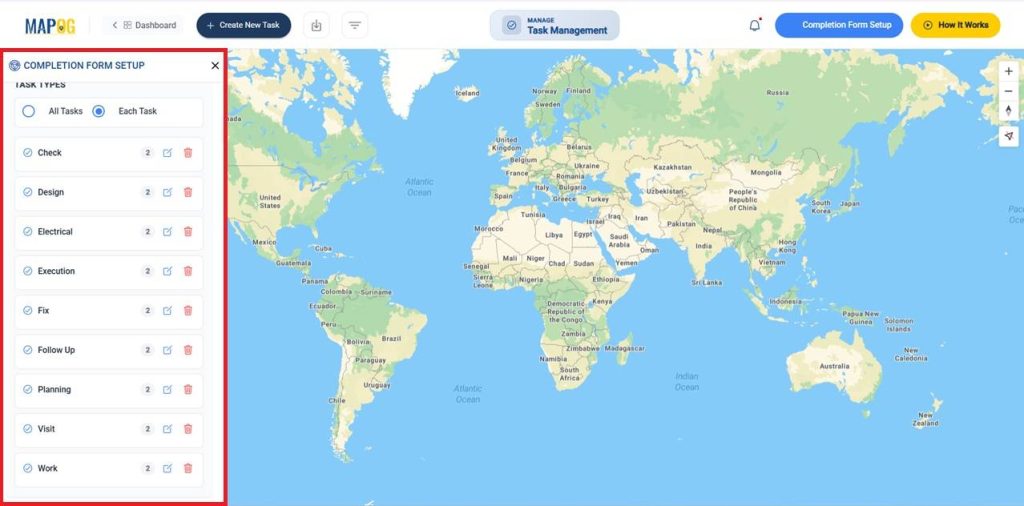
Go to the Completion form setup to record final details, confirm status, and ensure accurate task closure then select your created custom locations and give a Question for all or individual tasks.
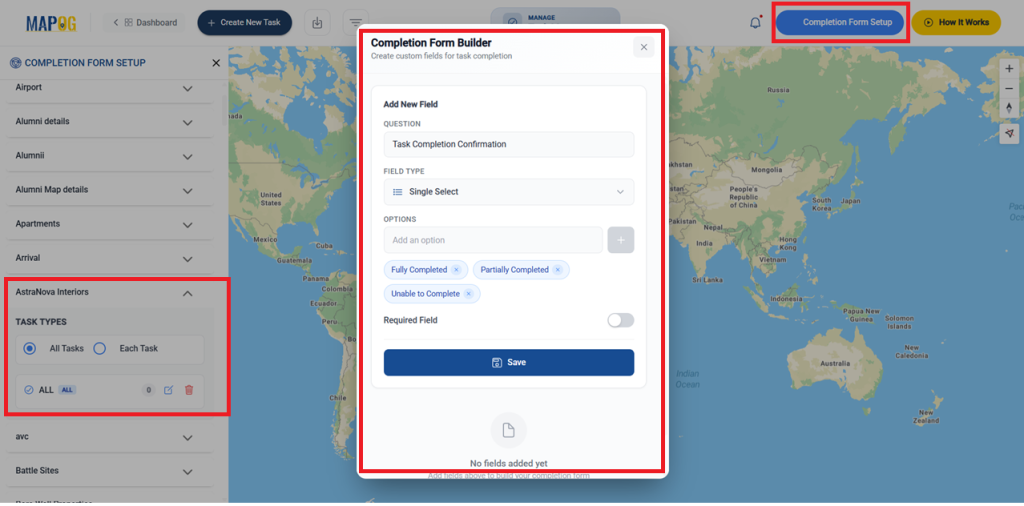
There are different field types like text, select, image, etc., to collect text, selections, and images as needed and enable Required fields when mandatory and save it. Add as many as needed; all questions are included.
Start a New Map Project
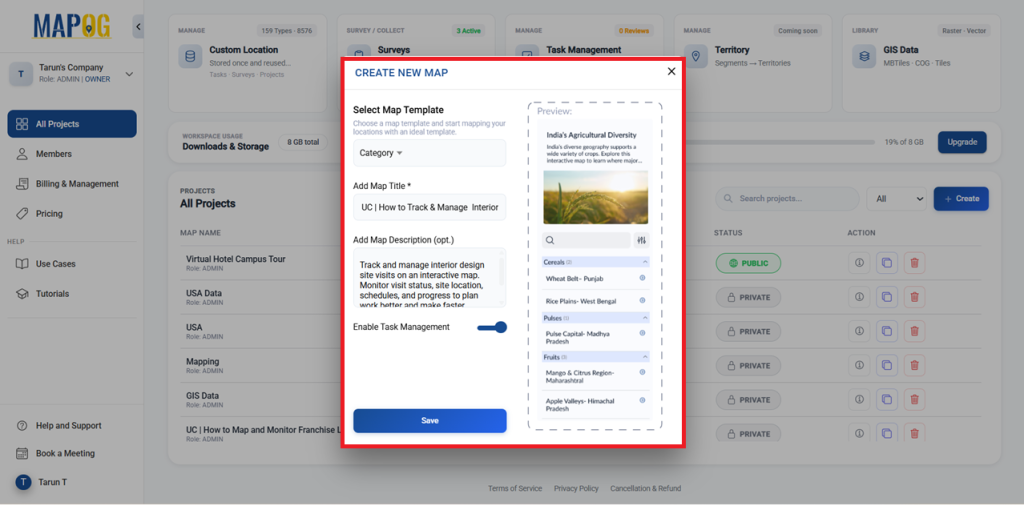
Go to MAPOG Dashboard, Click Create, choose the Category template, add a title and description, and enable Task Management to visualize all sites together.
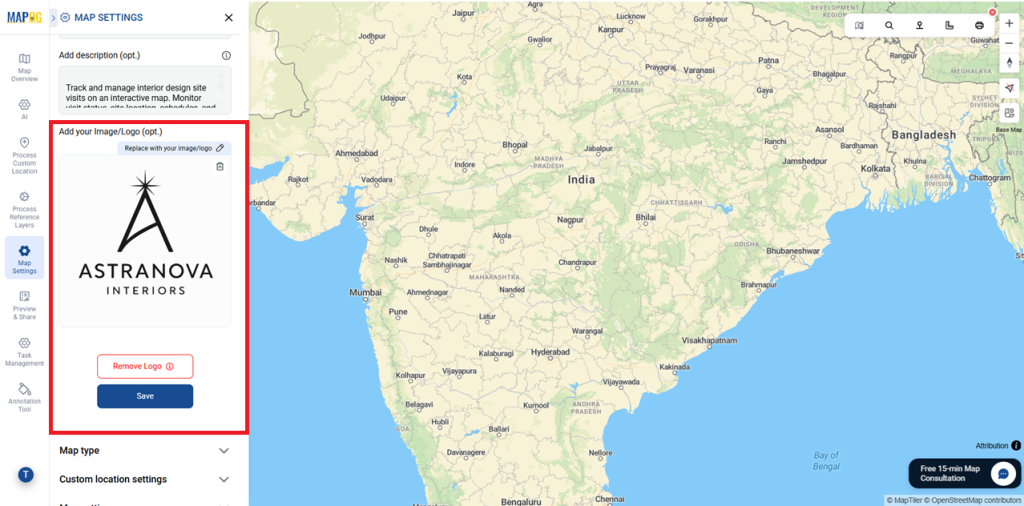
Add your Image/Logo
Use Replace to upload your image or logo, then edit and save it.
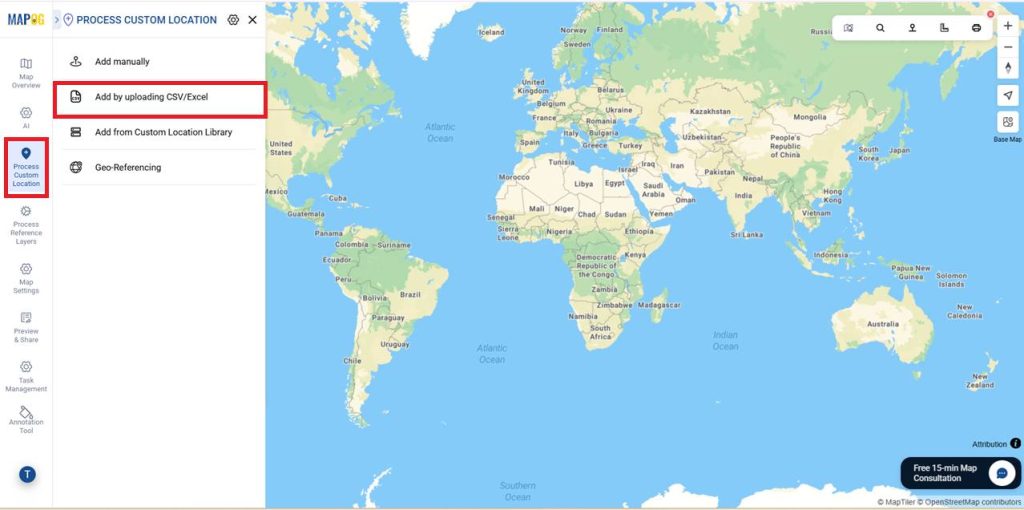
Importing Data from Excel
Now go to the Process Custom Locations to add multiple locations efficiently, then select Add by uploading CSV/Excel to upload the details from the Excel file.
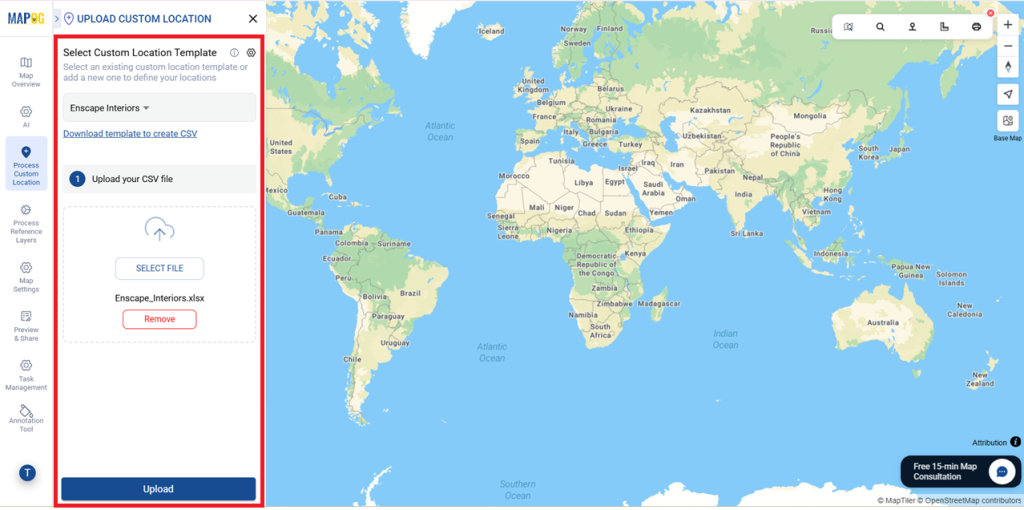
Then choose the recently created template under Select Custom Location Template to view and add all attributes. And click the Upload your CSV file and select your prepared file and upload it.
In Define Location Fields, match attributes with Excel columns and choose the fields to plot on the map.This ensures accurate data mapping. If you have a unique ID helps update or sync data accurately, match it directly, or select Auto-Generate ID to create one automatically and Match attributes with Excel.
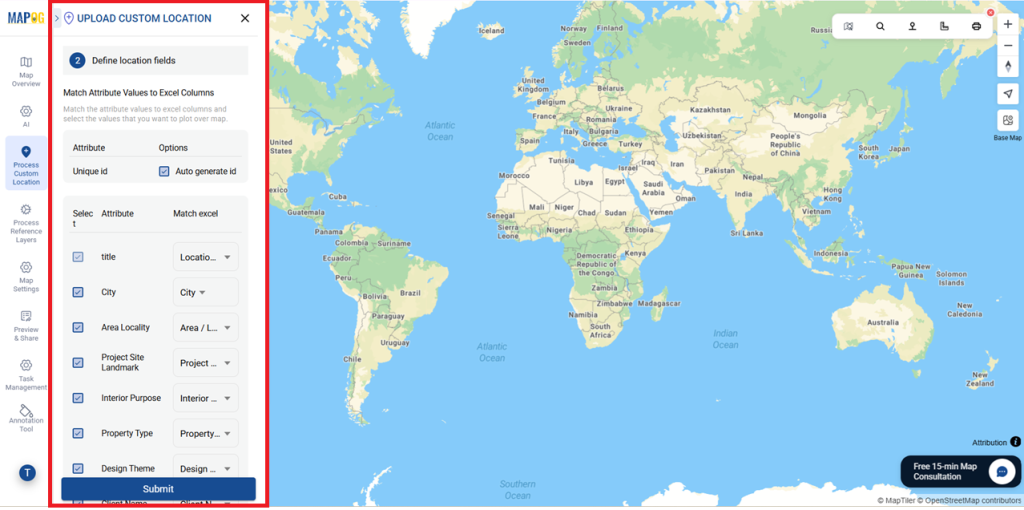
And select Latitude & Longitude to place locations correctly on the map, as the field type and select Submit once done.
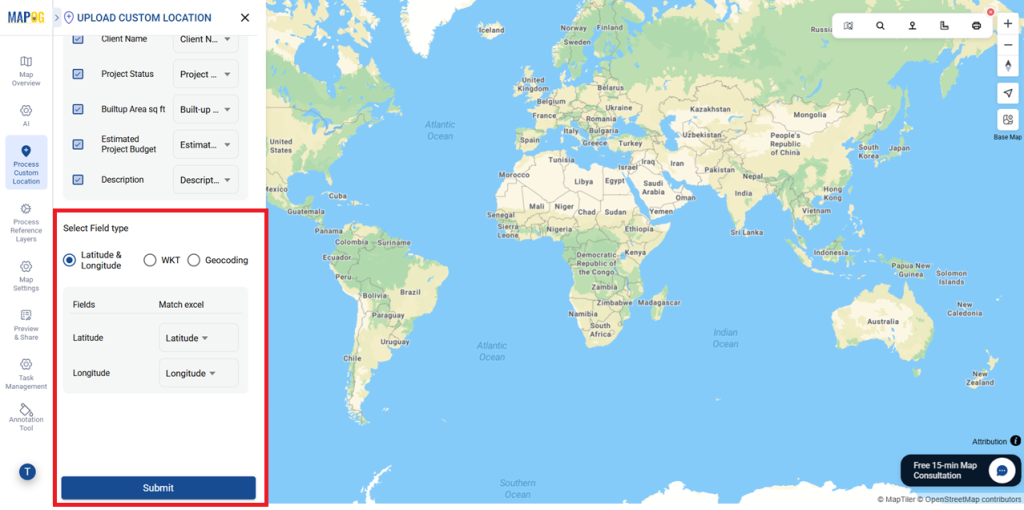
Now, all locations are automatically updated as points on the map.
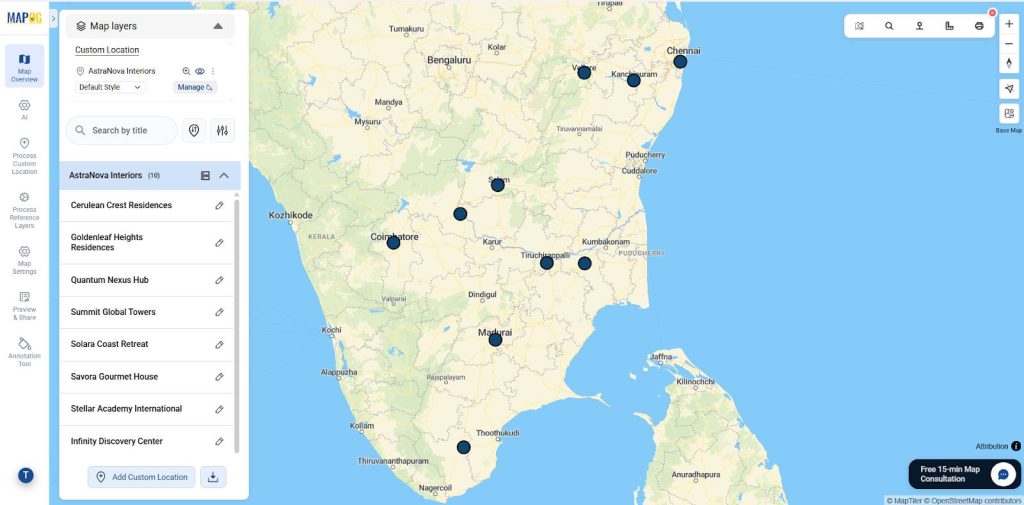
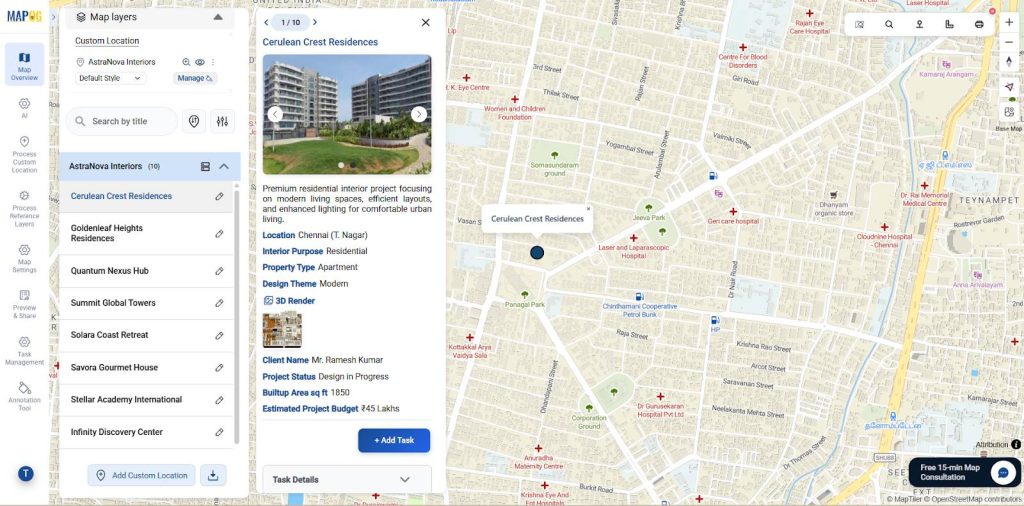
You can also add descriptions, upload existing images. This includes interior images for each location. For this, use Edit Custom Location Details and save it.
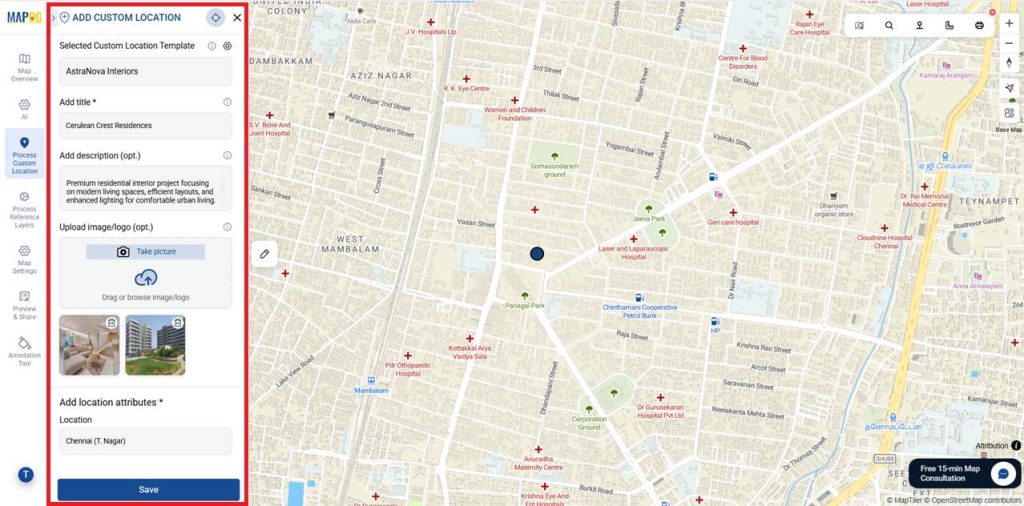
Similarly, you can upload all details for every location.
Task Management
First, select the location where the task needs to be added. Then, click +Add Tasks to continue.
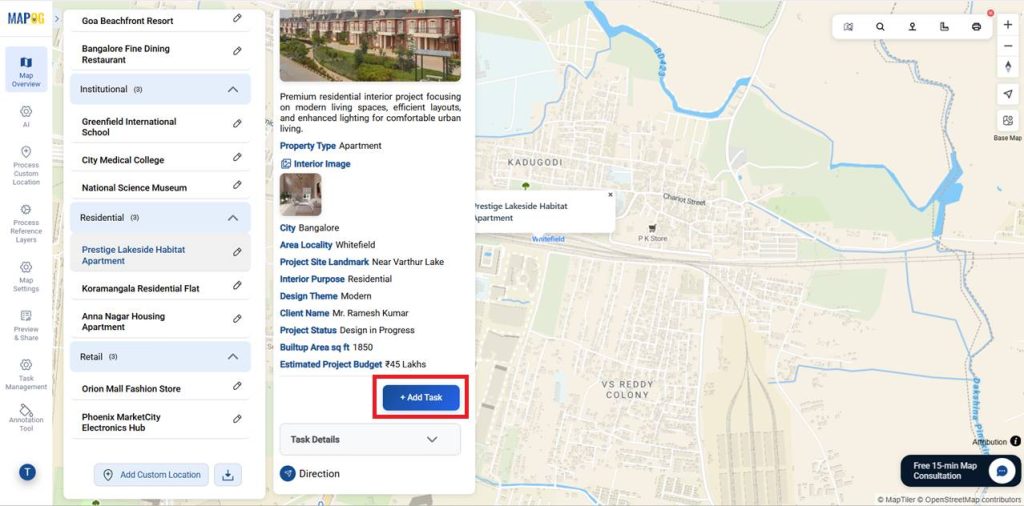
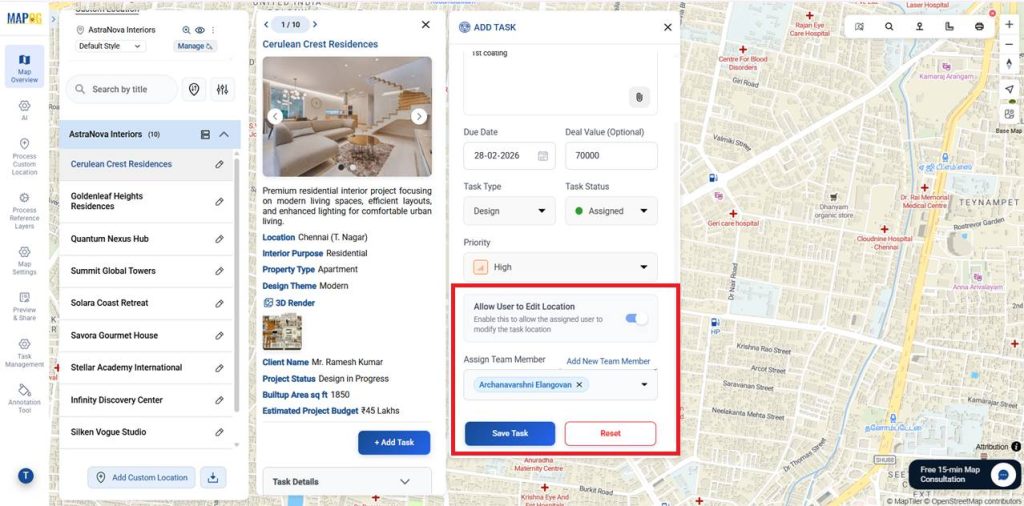
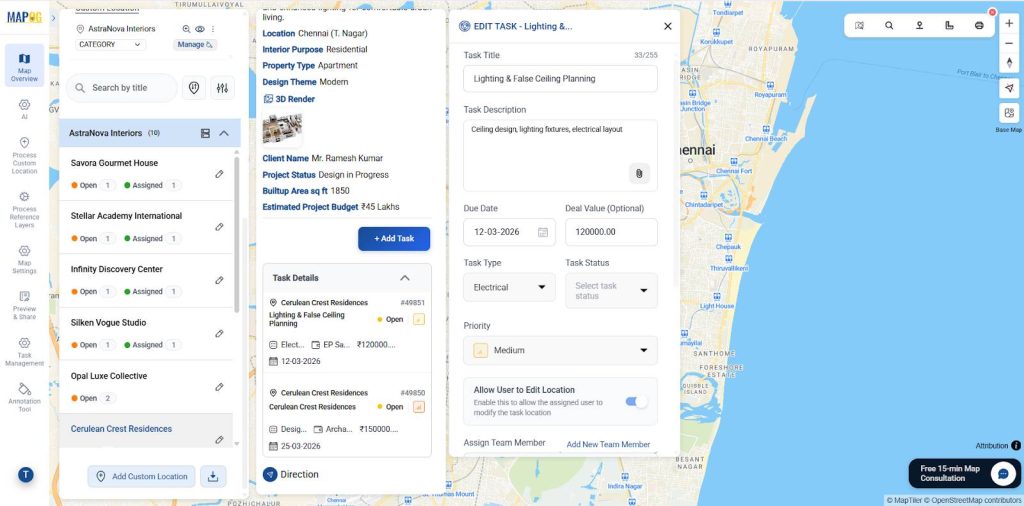
First, add the Task Title and Description. Next, set the Due Date, Deal Value, Task Status, and Priority.
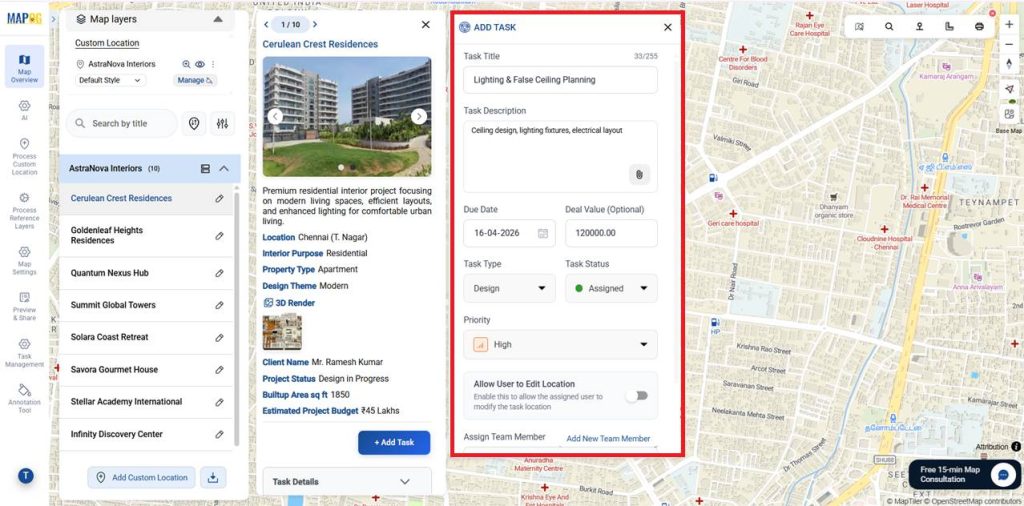
Then, select the Task Type ( you can select from existing or + Add more task typer), by selecting the existing or select the manage to add new one.
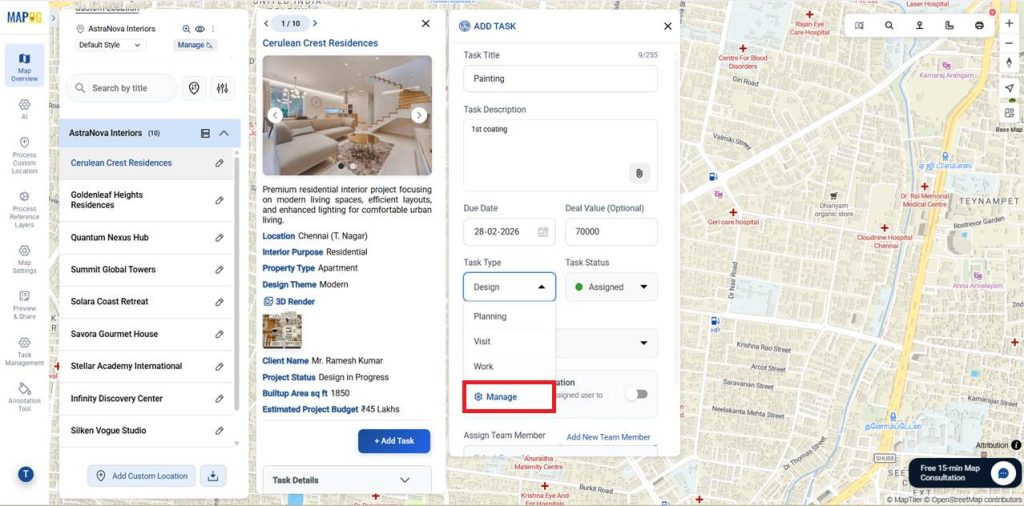
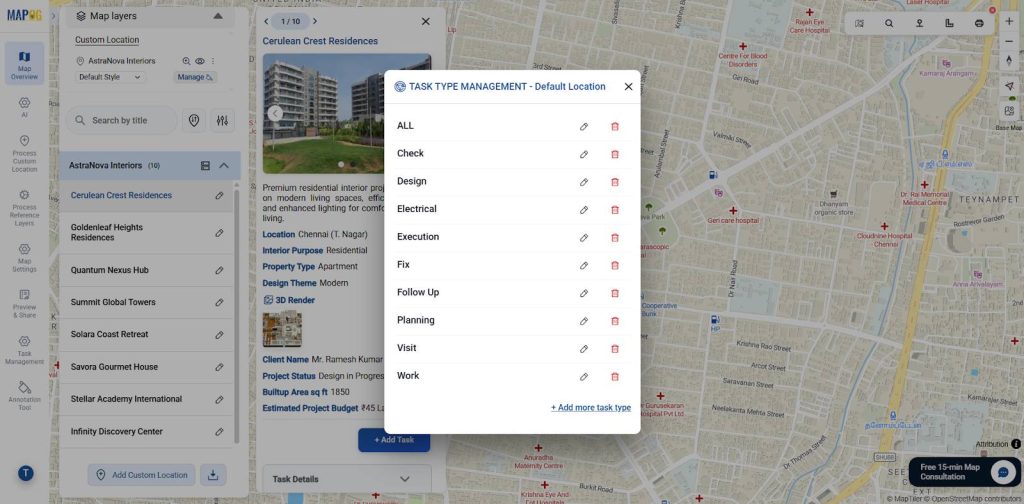
In this Task type Management select +Add more task type if required.
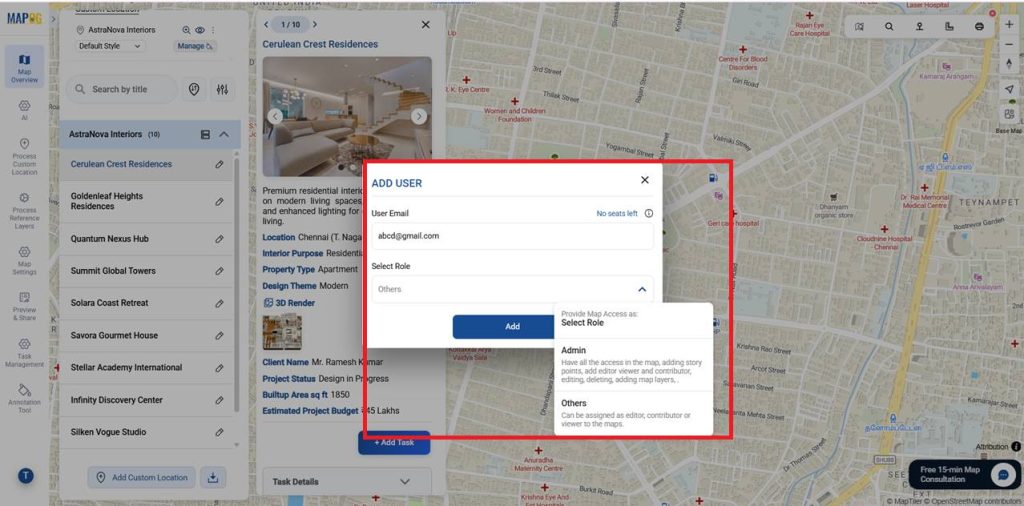
In this step, you can also add new team members by selecting Add New Team Member and assigning their user email and role such as admin or others.
Now, Assign a team member, allow users to edit location if needed, enable progress tracking, and save the task.
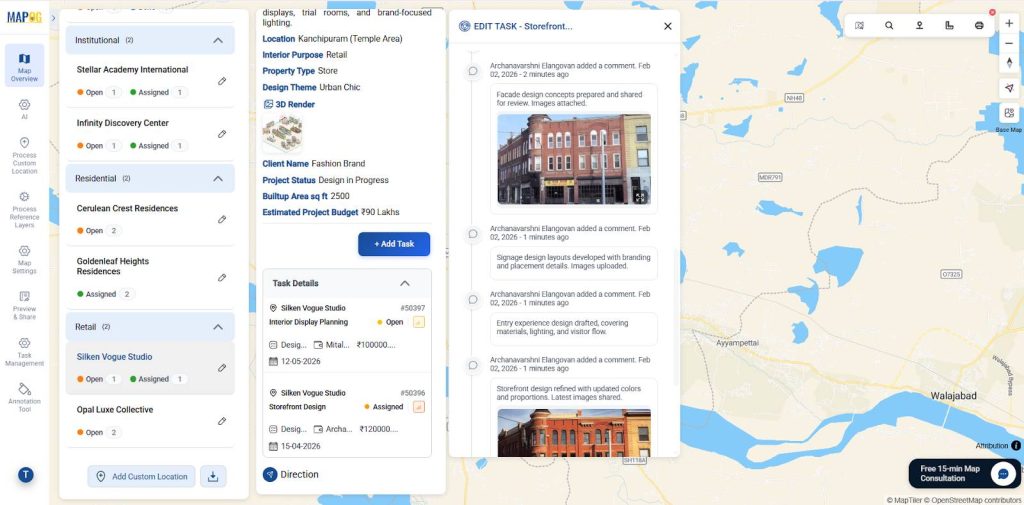
Similarly, you can add multiple comments for all locations as needed.You can also attach custom questions to your created task type using completion form setup, allowing structured inputs and consistent updates across every location.
Styling the Layer
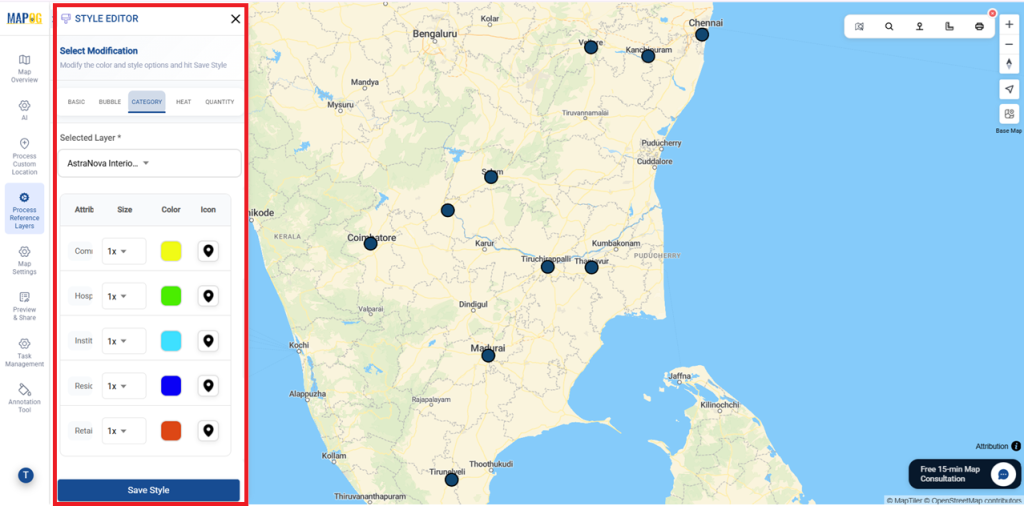
Go to Custom Location Settings and select Add Style Layer.
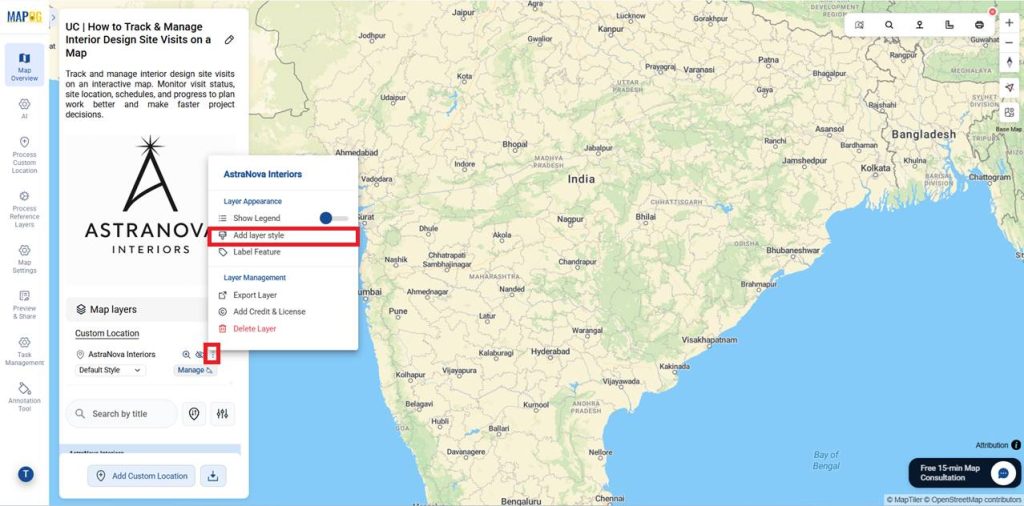
Select Style as Category and choose Uploaded Excel as the selected layer. Pick Interior Purpose as the attribute, set Category Icon, adjust marker size, color, and icon for each category, then save to view styled locations on the map.
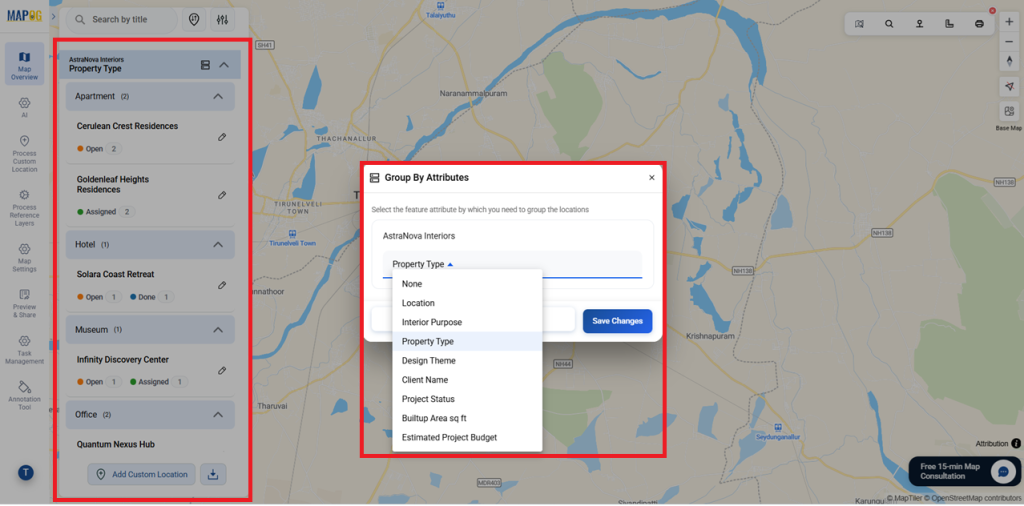
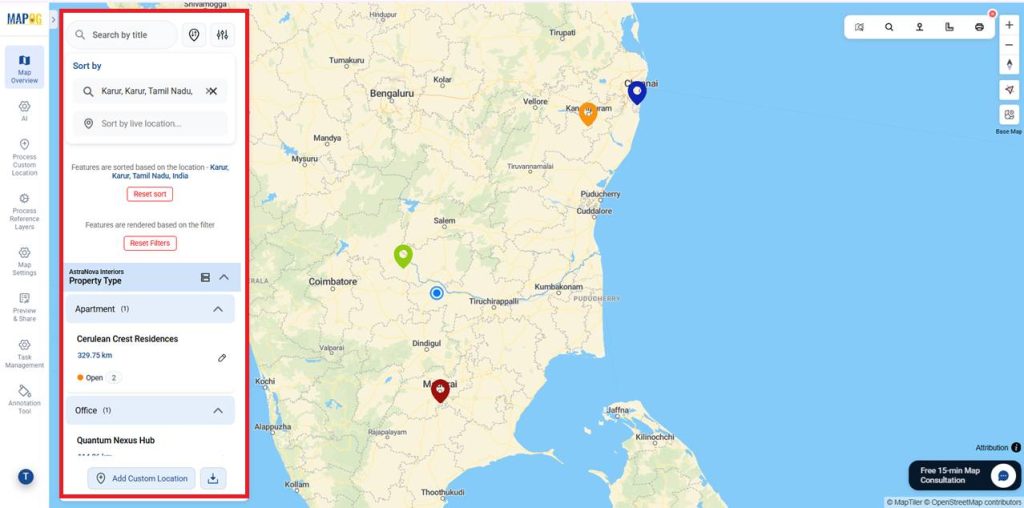
Group By Attributes
To organize similar locations we can use Group by attributes.
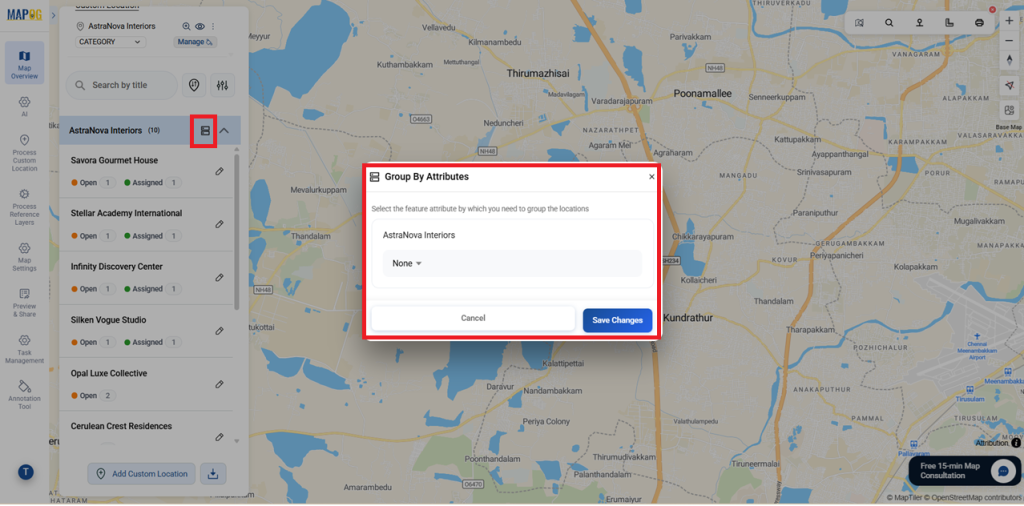
In this, choose the attributes you want to categorize and click Save Changes. You can now visually see the grouped results on the map.
Filters and Sorting Tool
Filters and sorting quickly refine interior projects by status, priority, budget, or stage. Use filters to match your needs.
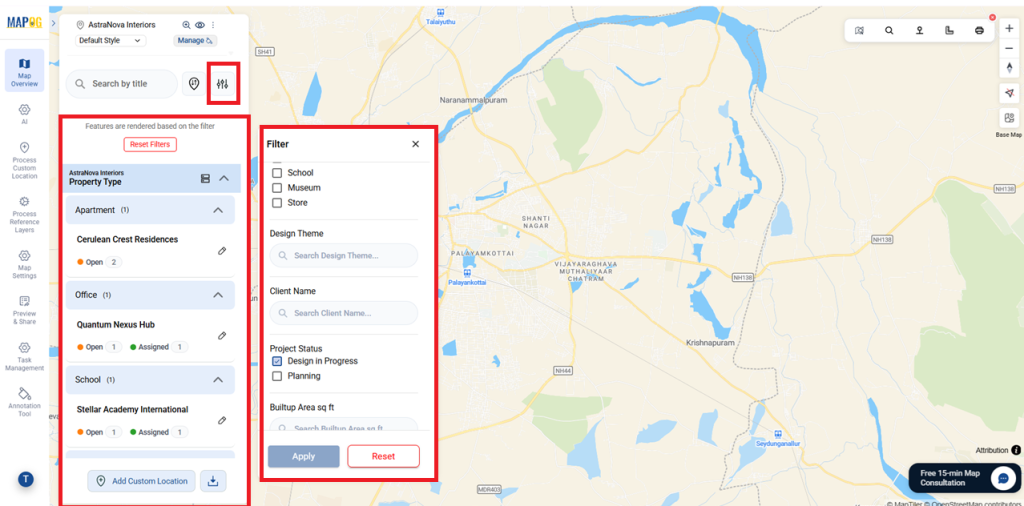
Use Sort to organize locations by name or live distance shown below each site.
Example: When you’re on a site visit, sort locations by distance from your current location to see which nearby sites are on your route, making it easier to plan and cover additional visits along the way.
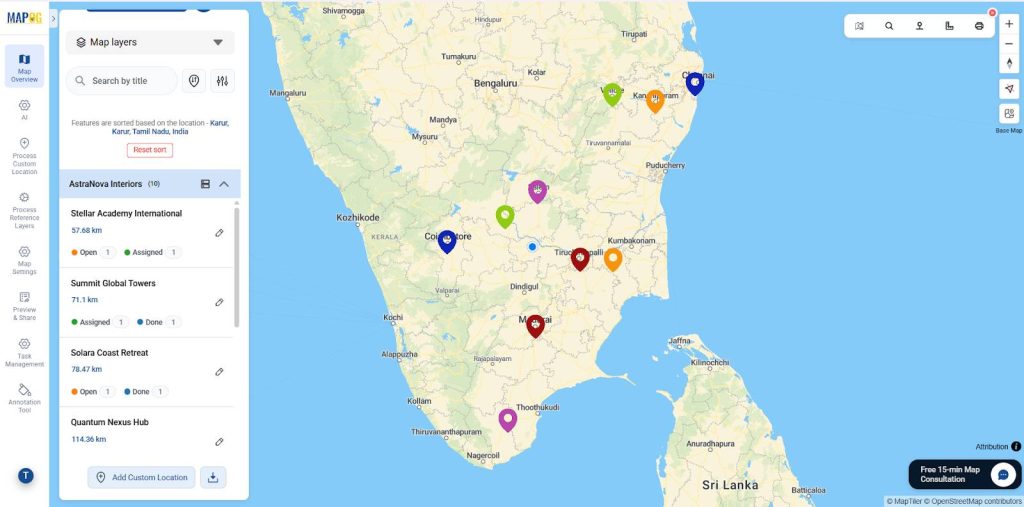
You can also combine Filter and Sort to get precise, well-organized results on the map.
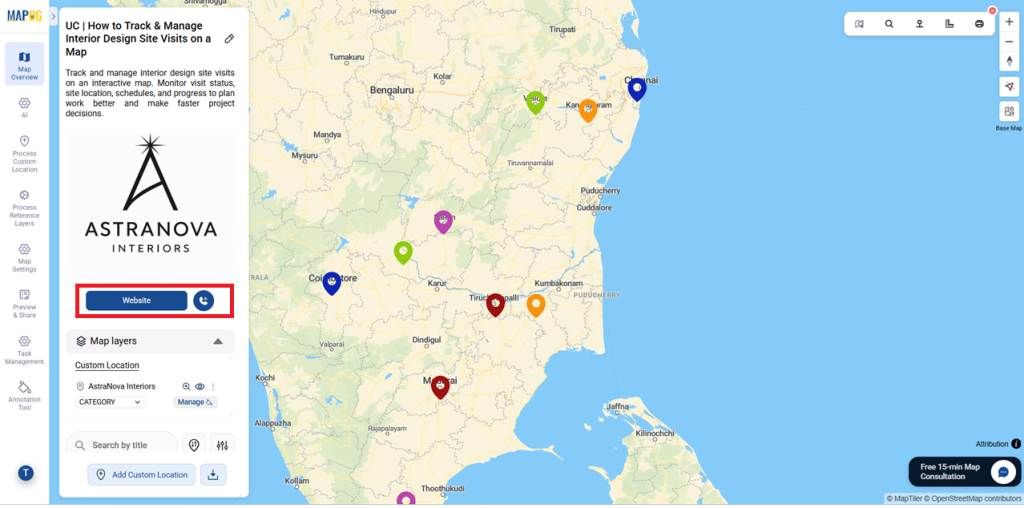
Use of Action Button
In Map Settings, select the Action Button to add details like a website link and phone number.
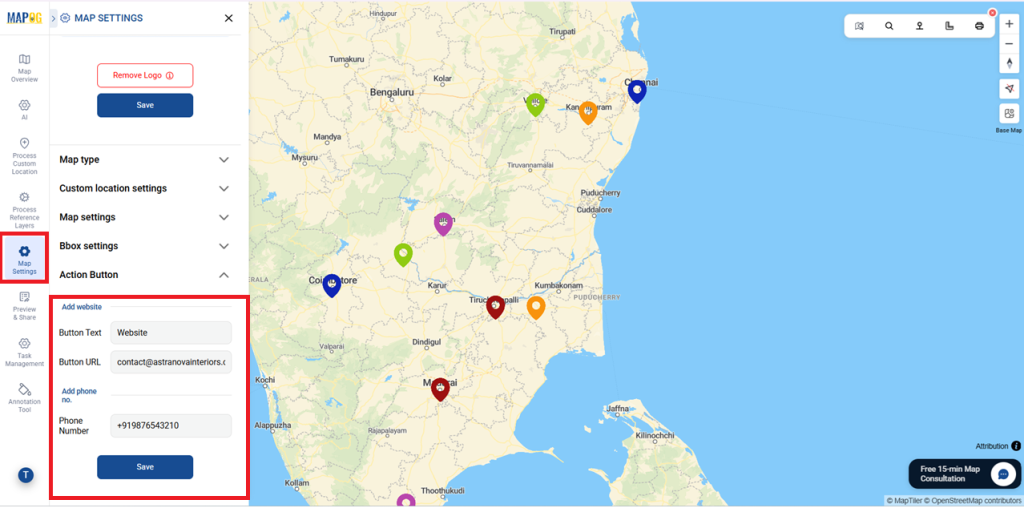
After adding the details, Save them. Selecting the button opens the website or places a call instantly.
Task Live Status Monitoring
Assignees can instantly receive their tasks in the MAPOG Contributor App. From the app, they can view task details, add comments, update the task status in real time and upload before-and-after images as proof of work, ensuring clear communication and accurate.
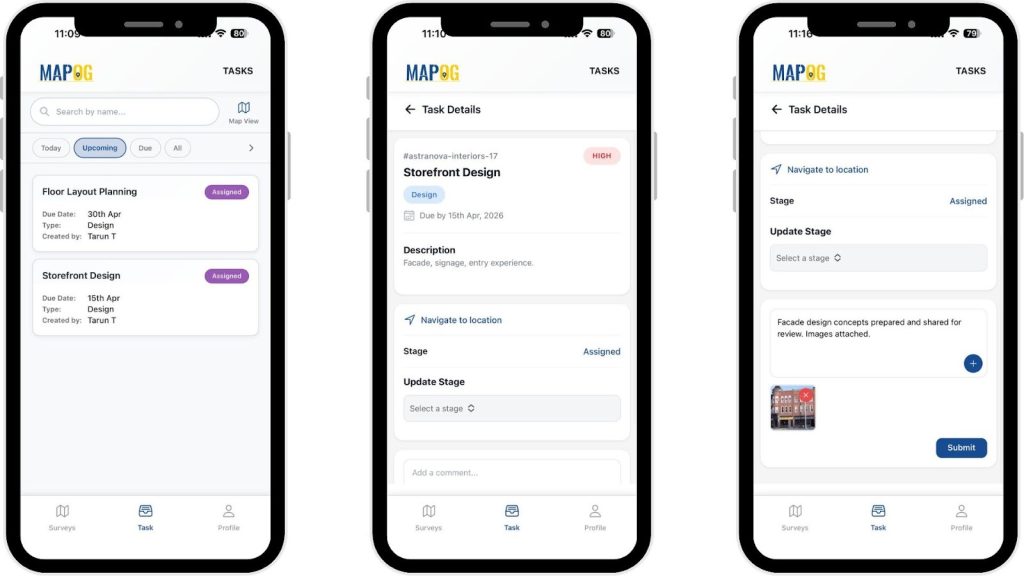
Move the status to “Completed” and fill out the completion form with the required details to close the task properly.
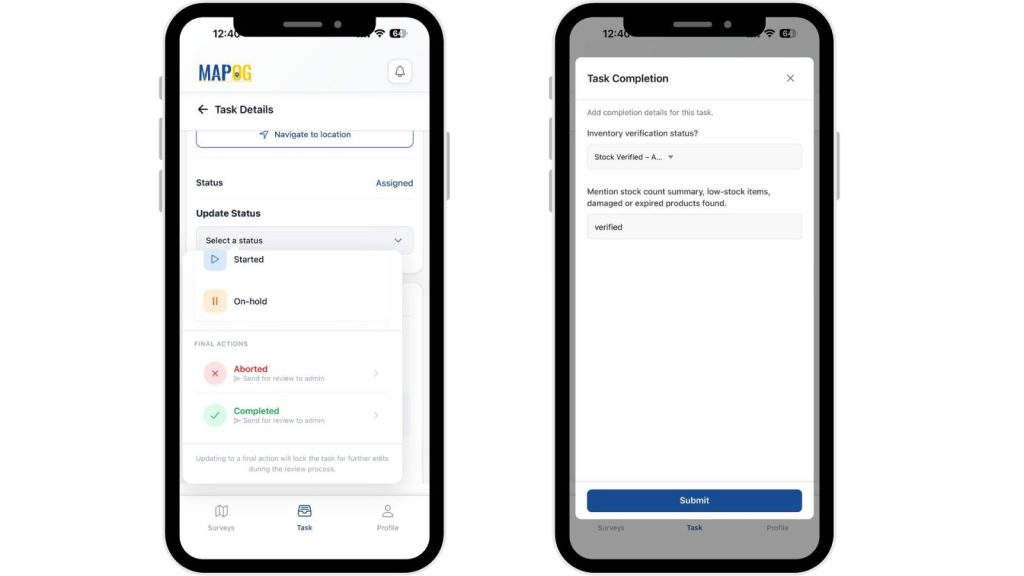
Meanwhile, progress updates appear live on the map dashboard, enabling real-time task tracking.
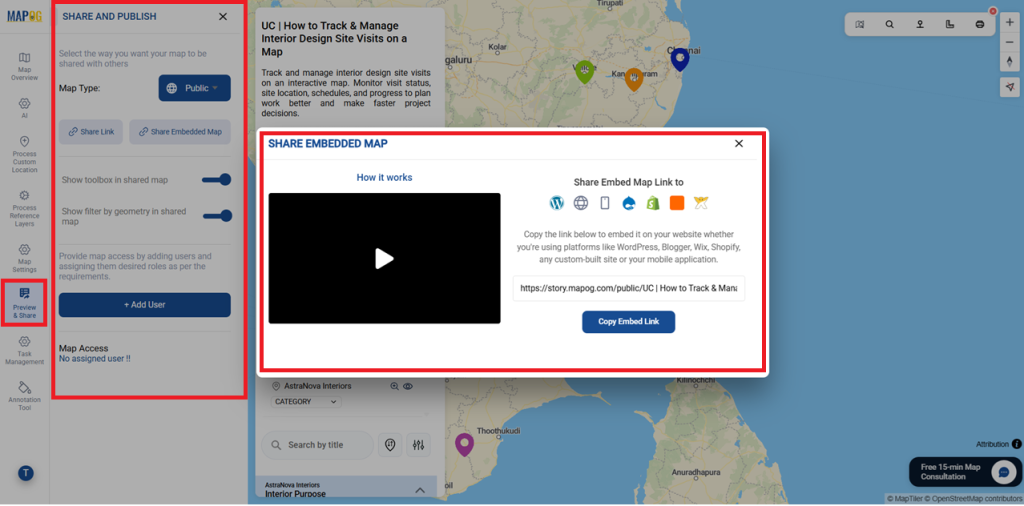
Publish and Share Map
After completing, use Preview & Share to make the map public and generate a shareable or embeddable link, allowing insights to be easily accessed, so you can share your portfolio with clients and work updates with your team.
Industry Use Cases and Benefits
Interior design maps help track site visits, monitor tasks, and coordinate teams from one view. They enable easy progress comparison, clear client reporting, and early issue detection. This improves planning, reduces delays, and supports faster, more confident decisions across interior projects.
MAPOG Mobile App: Android (Play Store) and iOS (App Store)
Conclusion
In conclusion, MAPOG turns interior site visit data into a clear, interactive map. This supports confident, data-driven planning from one visual platform.It improves team coordination, task tracking, and real-time progress visibility. This helps interior projects stay organized, efficient, and on schedule.