Many organizations struggle to identify where maintenance issues arise and how they spread across neighborhoods. As a result, teams often rely on scattered reports, which in turn cause delays and uneven service. Consequently, it becomes difficult to provide maintenance to customers consistently across all areas. However, by integrating structured field surveys with MAPOG , teams can capture problems at the source, visualize them geographically, and therefore transition toward balanced, efficient interventions.
Key Concept: Why Provide Maintenance to Customers Area‑Wise
At first glance, maintenance records may seem complete; however, without area‑wise surveys, hidden gaps persist. As a result, recurring issues in clusters get overlooked, while other zones receive excess focus. This leads to misallocated resources, delays, and uneven service. By contrast, structured field surveys capture customer issues, visualize distribution, and therefore enable balanced, timely interventions.
Step‑by‑Step Guide: Provide Maintenance to Customers through Survey
1. Begin with Mobile Data Collection
To start with, head to the MAPOG and navigate to the Mobile Data Collection section. From there, select Create New to initiate your survey project.

2. Define Survey Basics
Next, provide a suitable title and description for your survey. Go to select point type and create a location type by adding a name and selecting geometry type as point and add attributes that will later help in assigning customer points through filtering.

3. Add Questionnaire Fields
Moving forward, click on Add Question, lets say for a use case such as a water supply maintenance questionnaire. Start with basic fields like name and address. Then, add drop-downs for water connection type and multi select options for issues (pipe leak, low pressure, contamination). Finally, include date and boolean yes/no fields to capture detailed responses, ensuring structured and efficient data collection.

4. Upload Customer Location Data
After that, choose Add new location by uploading CSV/Excel and upload the file containing attributes and coordinates.

Assign a unique ID and match attributes with the corresponding Excel columns.

For location placement, choose either coordinates or WKT format and then submit your customer points will be visible on the map.

5. Assign Members and Points
Subsequently, click on Add users and then go to Add Member and fill up members email addresses and assign roles such admin or others according to the work.

Then select member from the drop down that you added and invite them into the survey.

Through the Map tab, draw polygons to assign specific points to each member. You can also apply color coding for clarity.

Another option is to use filters to assign locations from unassigned or all points.

Once done assigning points, launch the survey.

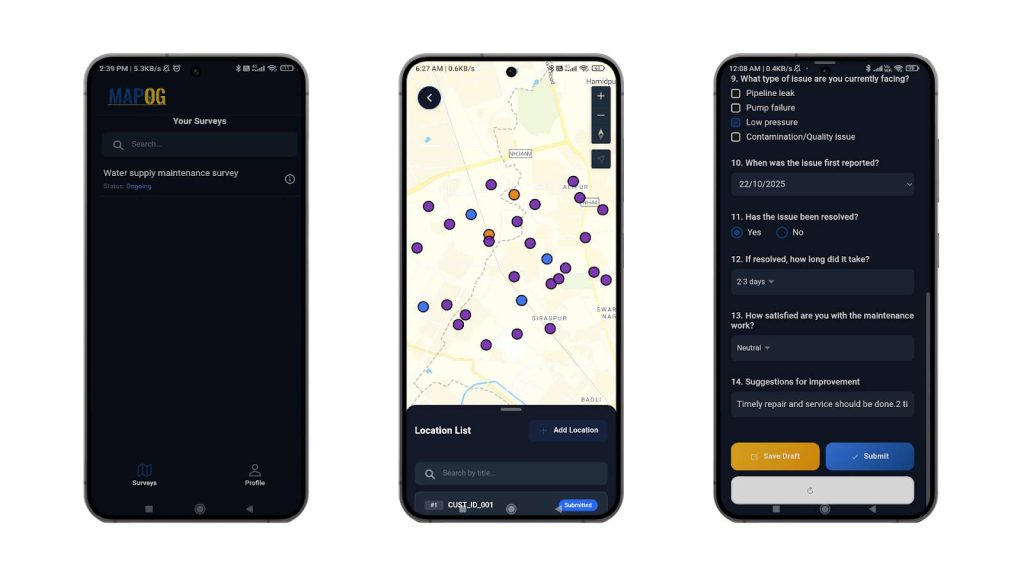
6. Conduct Surveys via Mobile App
Then, on the MAPOG Contributor mobile app, assigned members log in to view the ongoing survey. They fill out customer forms linked to their IDs, save drafts or submit directly, and responses sync automatically with the MAPOG browser dashboard.
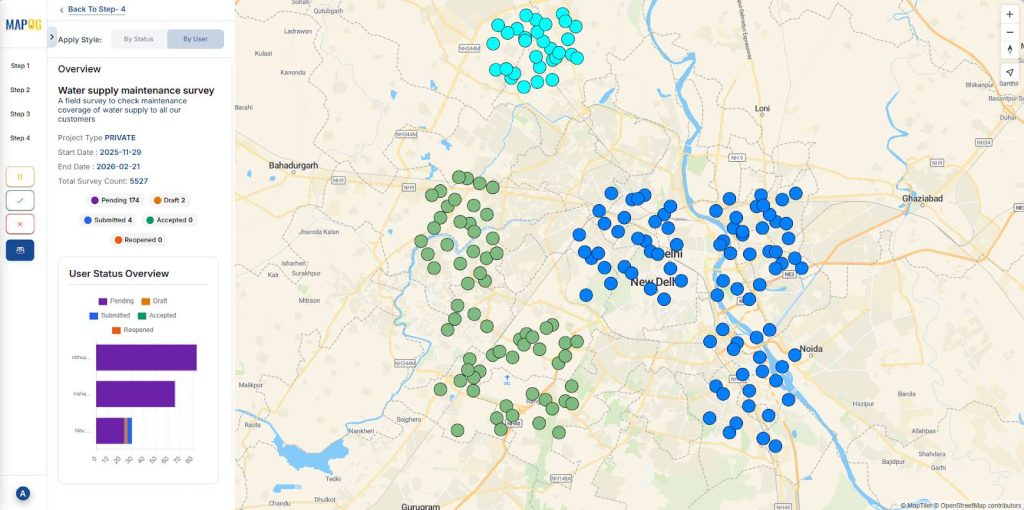
7. Monitor and Analyze Results
Finally, use the overview panel to monitor survey progress. You can view statistics such as submitted, pending, and drafted responses.

Moreover, filters allow you to sort customers by submitted and pending status with its assigned member.

As a result, managers gain a clear picture of survey performance and can make timely, data‑driven decisions.
Industrial Use and Benefits
Industries benefit by providing area‑wise maintenance through field surveys and questionnaires, making data collection seamless. Utilities map can complaint and assign staff to zones; telecoms can capture weak signals and respond geographically; transport can track delivery issues and allocate teams; healthcare teams can filter patient feedback and facility gaps. Consequently, industries gain structured insights, faster responses, and improved customer satisfaction.
Conclusion
In summary, providing maintenance to customers area‑wise using field surveys turns scattered reports into clear, actionable insights. Moreover, structured questionnaires and clear assignments ensure balanced interventions across neighborhoods. With MAPOG’s mobile data collection enhancing the process through task clarity and real‑time monitoring, industries achieve faster responses, greater reliability, and stronger customer trust.
Tap below to download the MAPOG Contributor app:
Here are some other blogs you might be interested in: