In water resource projects, visualizing borewell data is crucial for informed decision-making. Manual plotting, however, is tedious and error-prone. The ability to plot borewell data on a map simultaneously, without manual entry, makes the process faster and more reliable. MAPOG simplifies this through features like “Add by uploading CSV/Excel” and integrated task management. This then enhances efficiency and improves organization in borewell projects.
Key Concept: Plot Borewell data
The concept of plotting borewell data in bulk involves preparing a dataset and allowing the platform to automate the plotting process. Users can upload a structured file, such as a CSV or Excel, containing essential attributes like coordinates, depth, water quality, and status. This functionality streamlines the workflow by plotting all borewell points simultaneously, thereby enhancing consistency, accuracy, and visualization for project reporting and decision-making.
Step-by-Step: How to Plot Borewell Data Efficiently
Step 1: Create a New Map Project
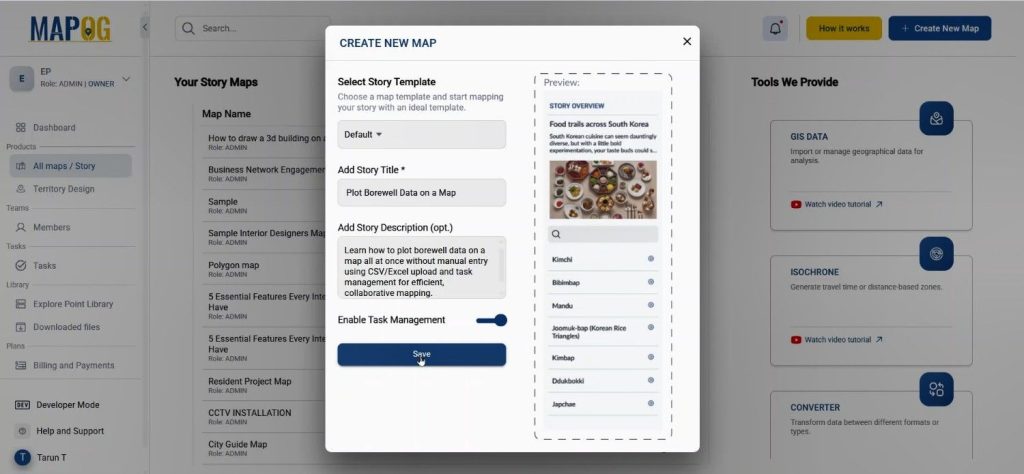
First, visit MAPOG and click on “Create new map.” Choose the default story template, give your project a title and description, enable the task management and save it.
Step 2: Add Borewell Data Using CSV/Excel
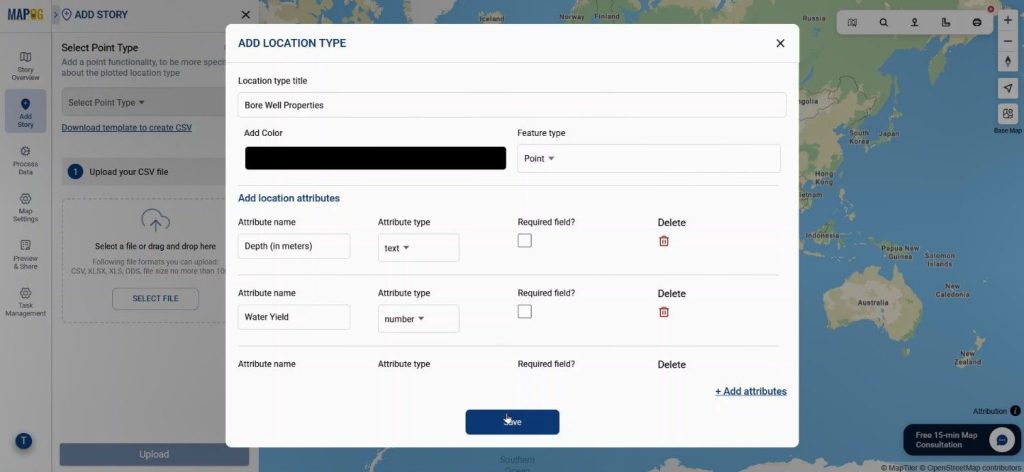
Now comes the time-saving part — instead of entering points manually. Go to the “Add Story” option and choose “Add by uploading CSV/Excel. Here, go to the select point type settings option & create a new location type called “Bore Well Properties”. Set the feature as a point. Include essential fields such as Depth, Water Yield, Water Quality, and Status.
Step 3: Match Attributes and Plot Automatically
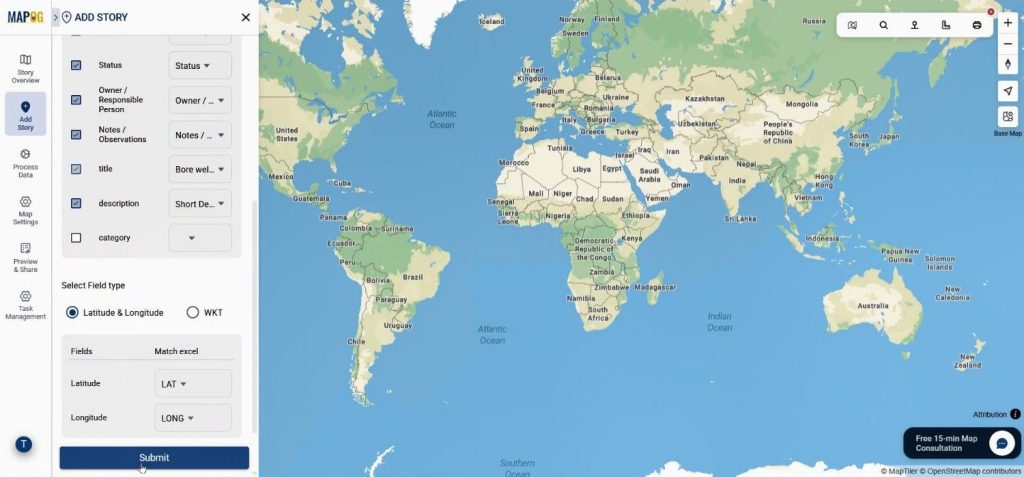
Once your CSV is ready, upload it and match your Excel columns with the attributes you defined. Use the Borewell ID as the unique identifier and map the latitude and longitude columns. After submission, all borewell points will automatically plot on the map — no manual clicking required.
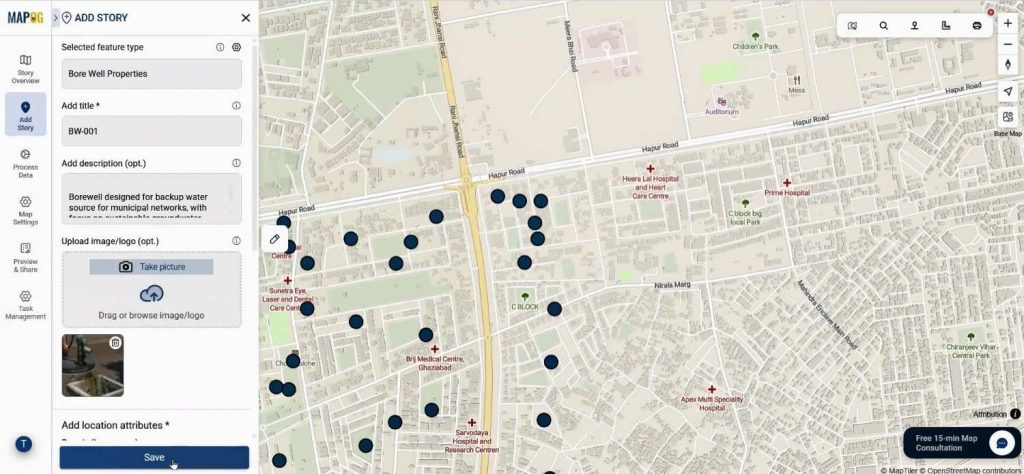
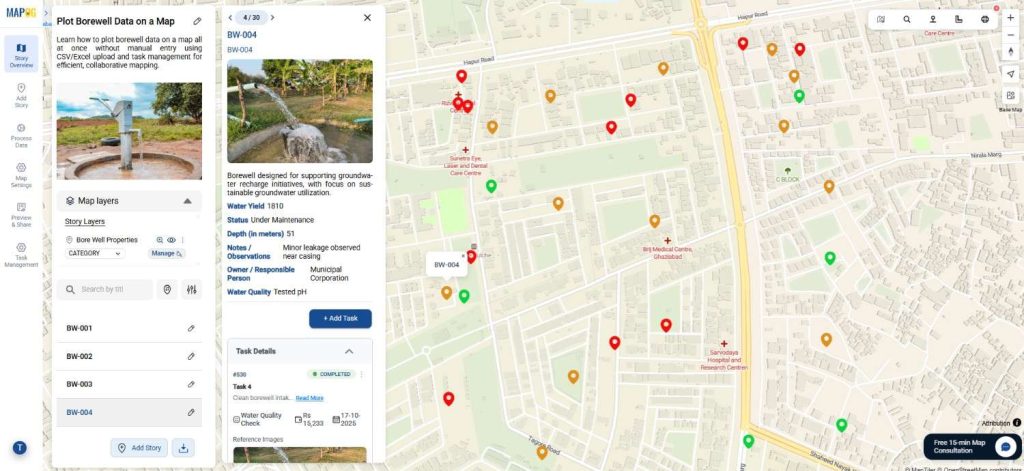
Step 4: Add Details and Images to Each Borewell
To make your map more informative, go to the point details section and add images or additional notes to each borewell entry. This enriches your map and makes it easier for others to understand the data visually.
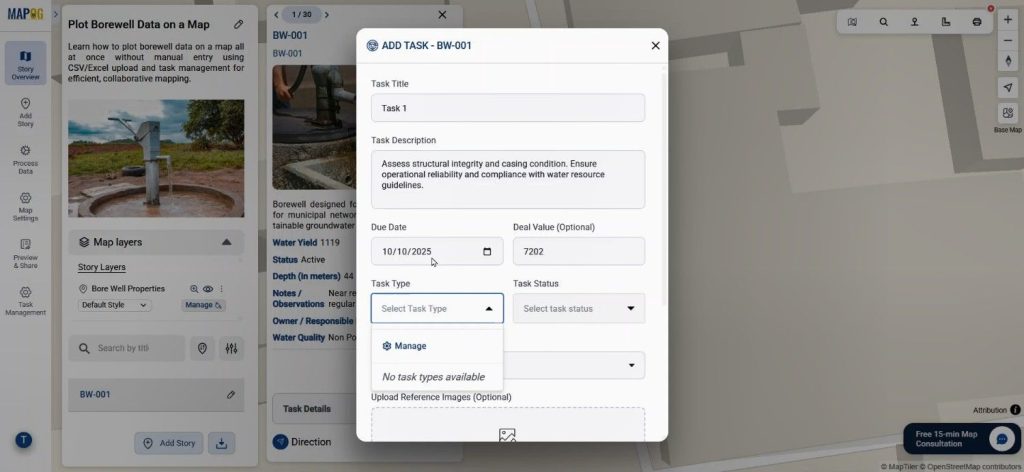
Step 5: Manage Tasks and Team Activities
One of the most powerful features of MAPOG is its task management system. Click on a borewell point popup and add tasks with a title, description, due date, and even deal value if needed.
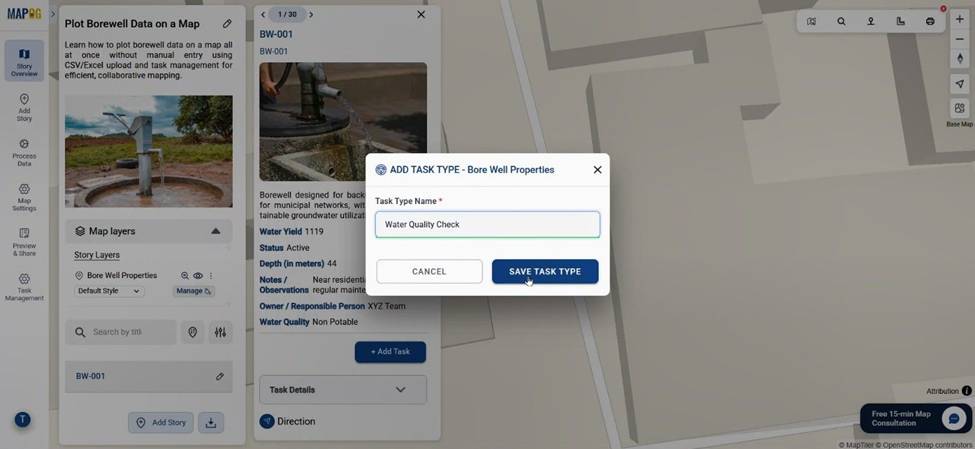
By going to the task type manage option you can create a new task type & save them.
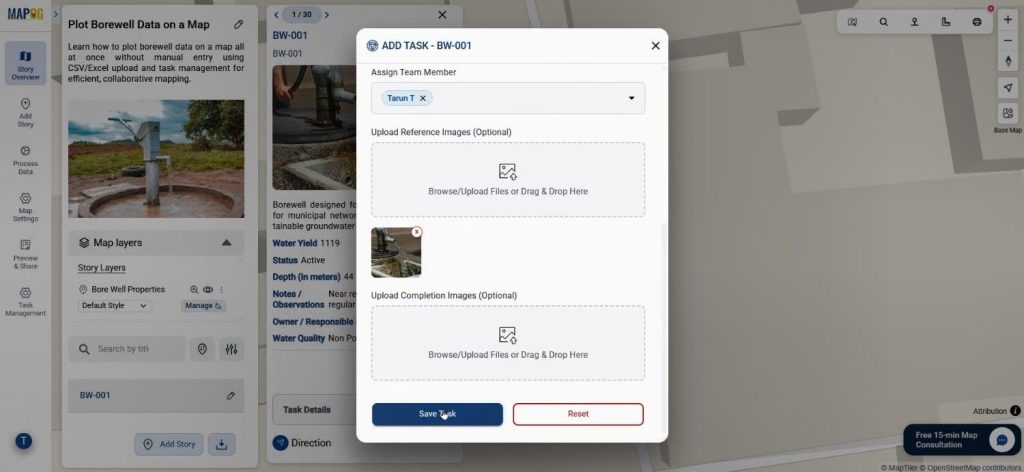
You can assign tasks to team members, set task types and statuses, and attach field photos — turning your map into a collaborative project dashboard.
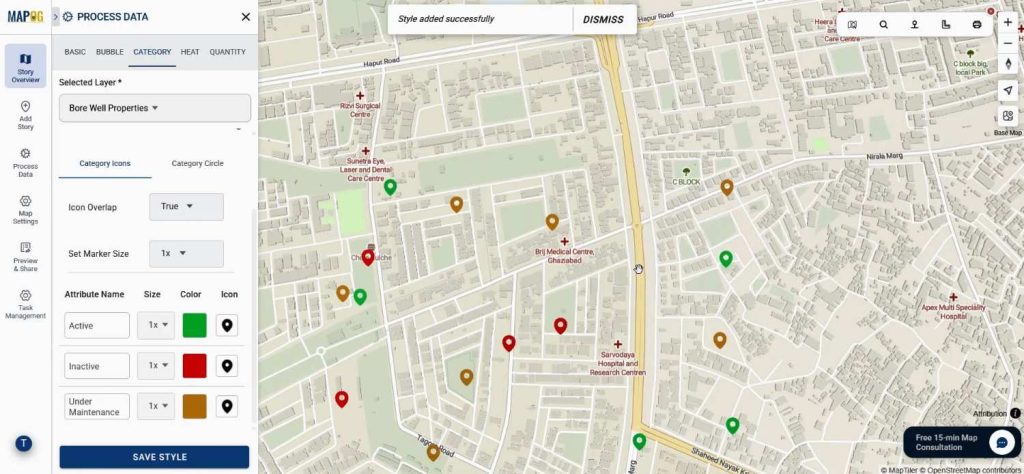
Step 6: Visualize by Status and Share Your Map
Lastly, head to the “Add Style Layer” section and categorize borewells based on status or water quality, assigning different colors for better visual analysis.
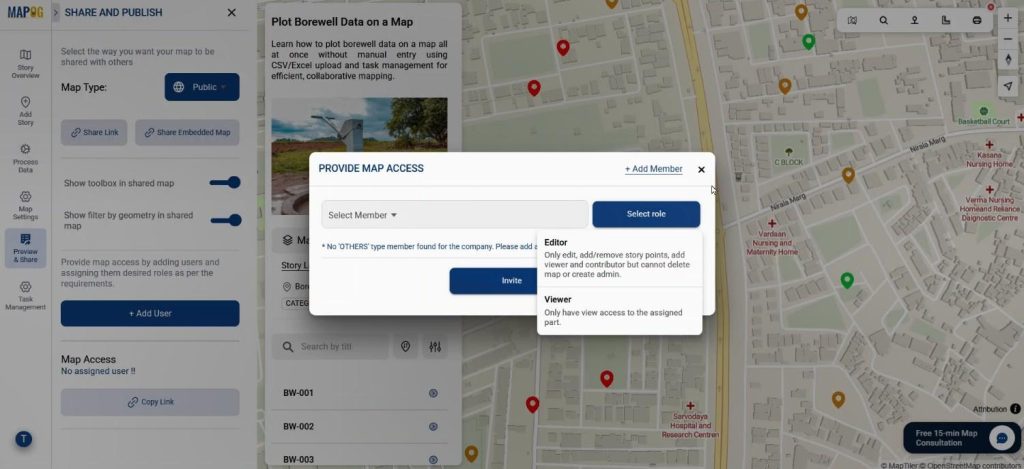
Then, use the “Preview and Share” option to make the map public and share it with stakeholders or field teams.
Industry Applications & Benefits
Learning how to plot borewell data on a map all at once without manual entry has practical benefits across industries. For example, water resource departments can track drilling progress, environmental agencies can monitor water quality trends, and private contractors can manage project timelines — all in one interactive dashboard. Moreover, bulk data plotting ensures faster analysis, reduces human errors, and makes reporting significantly easier.
Conclusion
Whether you’re dealing with dozens or thousands of borewell records, automating the process of plotting borewell data is the smartest move you can make. With MAPOG ‘s “Add by uploading CSV/Excel” and built-in task management, you can move from raw data to actionable insights in just a few clicks.