As cities evolve into smarter, data-driven ecosystems, interactive 3D building visualizations are transforming the way we explore and understand urban spaces, and learning how to draw 3D buildings has become an essential skill in this transformation.
Whether used for dynamic urban planning, immersive real estate showcases, or engaging educational projects, 3D models turn ordinary maps into interactive experiences filled with depth, detail, and clarity.
Unlike static maps, these interactive visual tools capture the true scale, height, and structure of buildings, empowering users to analyze, explore, and present spatial data in a more engaging and meaningful way. With MAPOG, users can easily draw 3D buildings on interactive maps, customize their design, and explore realistic perspectives—transforming static maps into dynamic tools for planning, learning, and storytelling.
Key Concepts
Process of How to Draw 3D Building on an interactive map goes beyond sketching simple shapes. It’s about creating a realistic spatial representation that adds depth and context to geographic data. With MAPOG, users can model building heights, customize structures, and visualize their relation to surrounding features. This interactive approach supports smarter urban planning, enhances real estate presentations, enriches educational projects, and brings storytelling to life through immersive, data-driven mapping.
Steps involves How to Draw 3D Building:
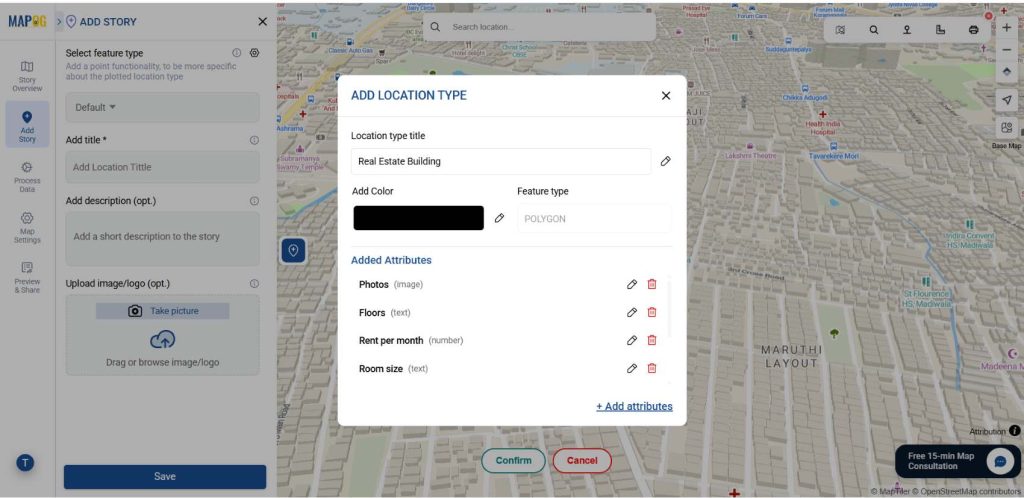
1. Add building polygon manually
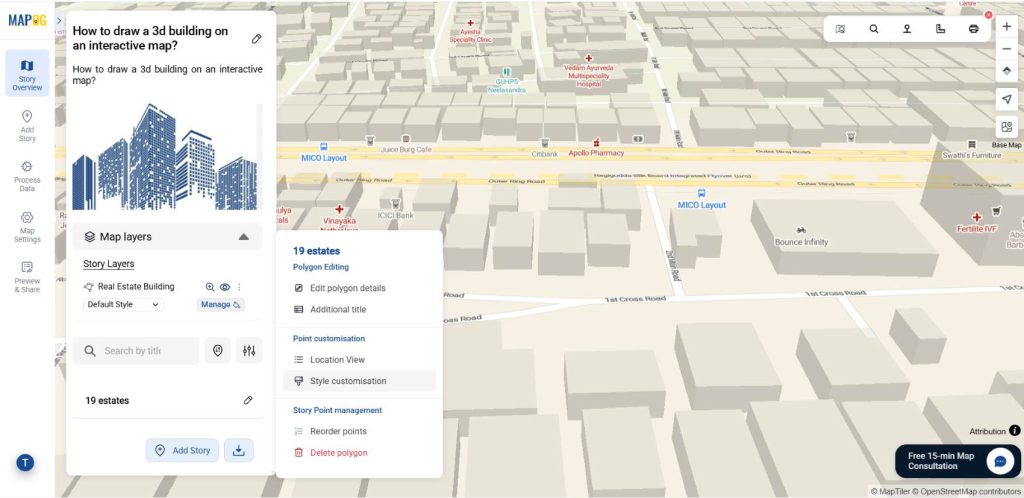
First log into MAPOG & create a map. Use the “Add story” then select “add manually” option then Using the select feature type settings option, create location type such as “Real estate building”. Then change feature type to polygon to draw polygon & add different relatable attributes such as address, number, photos, floors, rent per month and room size. Then save it.
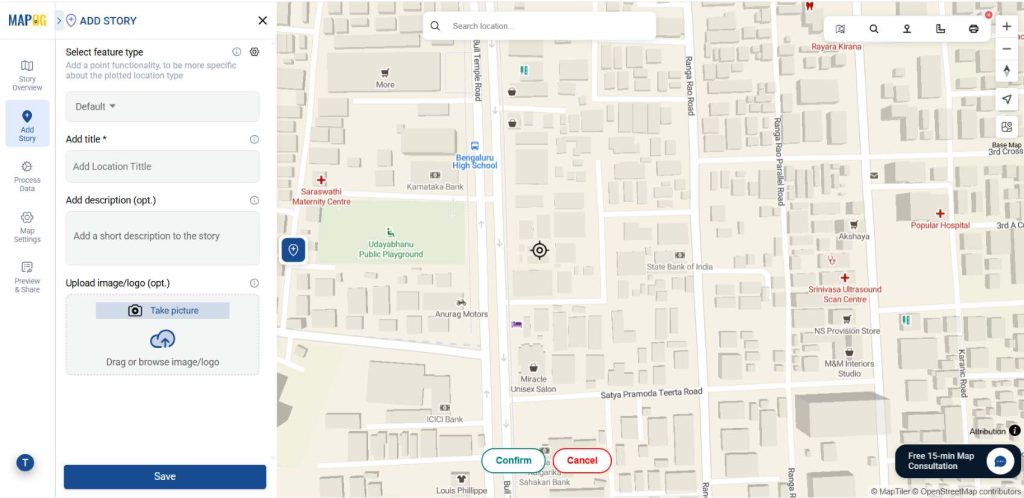
2. Choose your area
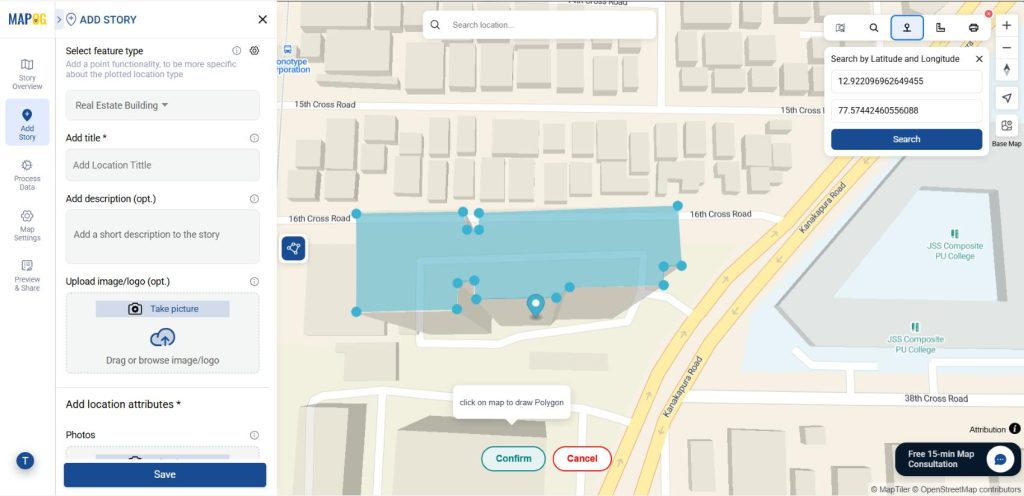
Then select Real estate buildings you want to plot by using Search by Latitude and Longitude.
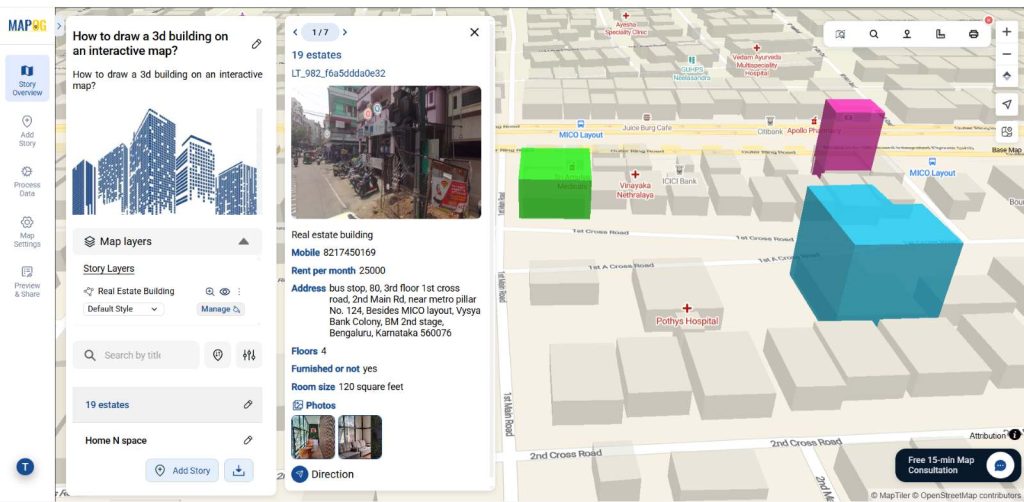
After that select the building in which you want to draw a polygon. Then carefully click around its perimeter. Every time a vertex is clicked, MAPOG automatically creates a straight line connecting them. After drawing it conform it to save the polygon. Now you have finally created a polygon for building.
Then give the title for your polygon, write a short description about it, and upload a suitable image. After that fill required attributes. Then save the point.
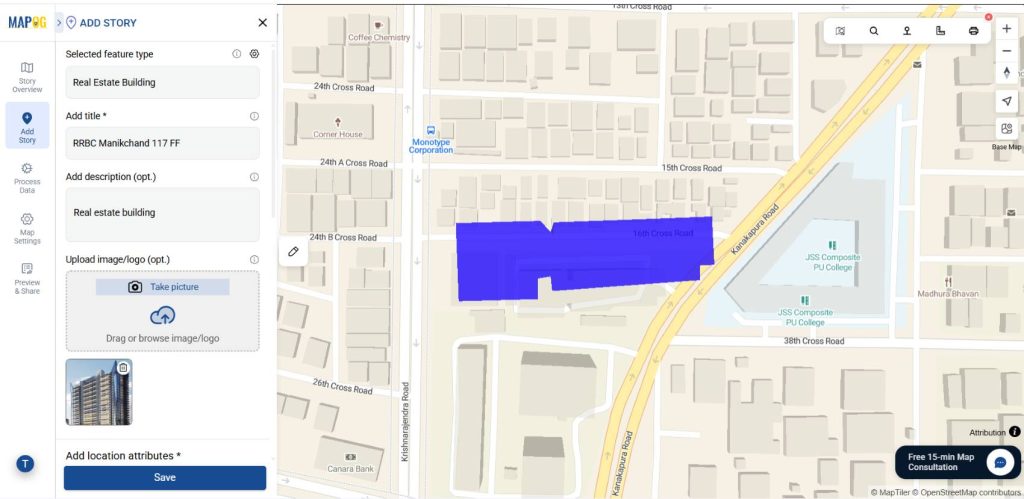
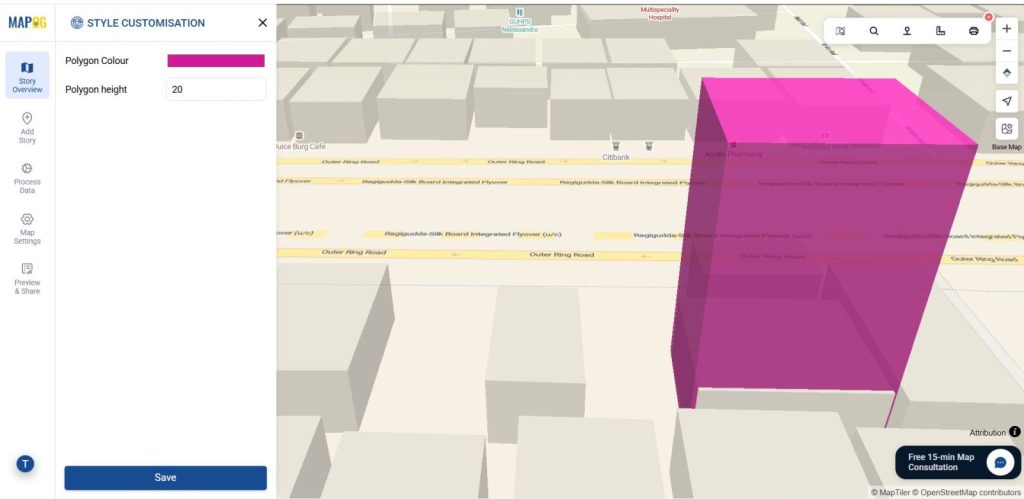
3. Customize Points for Visual Appeal
Then provide a suitable colour and give a proper height for your building polygon using Style customization.
This will provide your building a 3d look.
Applications of Drawing a 3D Building on an Interactive Map
Urban Planners and Architects can seamlessly visualize building heights, layouts, and spatial relationships, thereby enabling data-driven city planning and smart infrastructure design with real-time insights.
Meanwhile, Real Estate Developers can present interactive 3D project models, allowing potential buyers or investors to explore scale, perspectives, and neighborhood context through highly immersive visual experiences.
In addition, Educators and Students can engage with 3D interactive maps to explore geography, architecture, or environmental design, thus transforming learning into a hands-on, exploratory experience.
Finally, Tourism and Cultural Heritage Managers can build immersive, interactive 3D maps showcasing landmarks, monuments, and historic buildings.
Conclusion:
Drawing a 3D Building on an Interactive Map becomes intuitive and impactful with the power of MAPOG. In fact, you can bring flat maps to life and visualize structures with realistic depth. As a result, urban planners, real estate developers, educators, and tourism managers can explore spatial relationships and make smarter.
Here are topics related to this topic: