In the world of digital mapping, the concept of 3D mapping has changed how we visualize spaces. MAPOG is a mapping tool which allows users to draw realistic 3D buildings with ease, specifically for urban planning, real estate visualization, or educational use.
Key Concepts of 3D Buildings You Should Know
Drawing 3D buildings on a map becomes highly effective by enhancing Visualization and improving spatial understanding. Therefore, they are Ideal for city planners or real estate developers so as to simulate designs before construction.
- Base Map and Coordinate System– Every project begins with a base map which the terrain, boundaries, and urban areas where 3D buildings will be added.
- Outline of the structure- It is the 2D outline of a structure, represented as polygons on the map. These base shapes are later extruded into 3D forms. Which certainly can be drawn directly on the base map.
- Height Data- This height can be manually entered or can be additionally derived from building attribute data, or based on real-world measurements. Height value determines how tall each building appears on the map.
- Visualization- You can also tilt, rotate, and additionally zoom to view structures from different angles. As a result, this visual styling helps differentiate land and highlight specific zones.
How to Draw 3D Buildings in MAPOG
1. Adding ‘story’ to the Map
- Firstly, open MAPOG and click on create a new map and select Category as the new template.
- Go to Add Story & and select Add Manually.
- Open Category Settings and either choose or create by clicking on +Add More Categories.
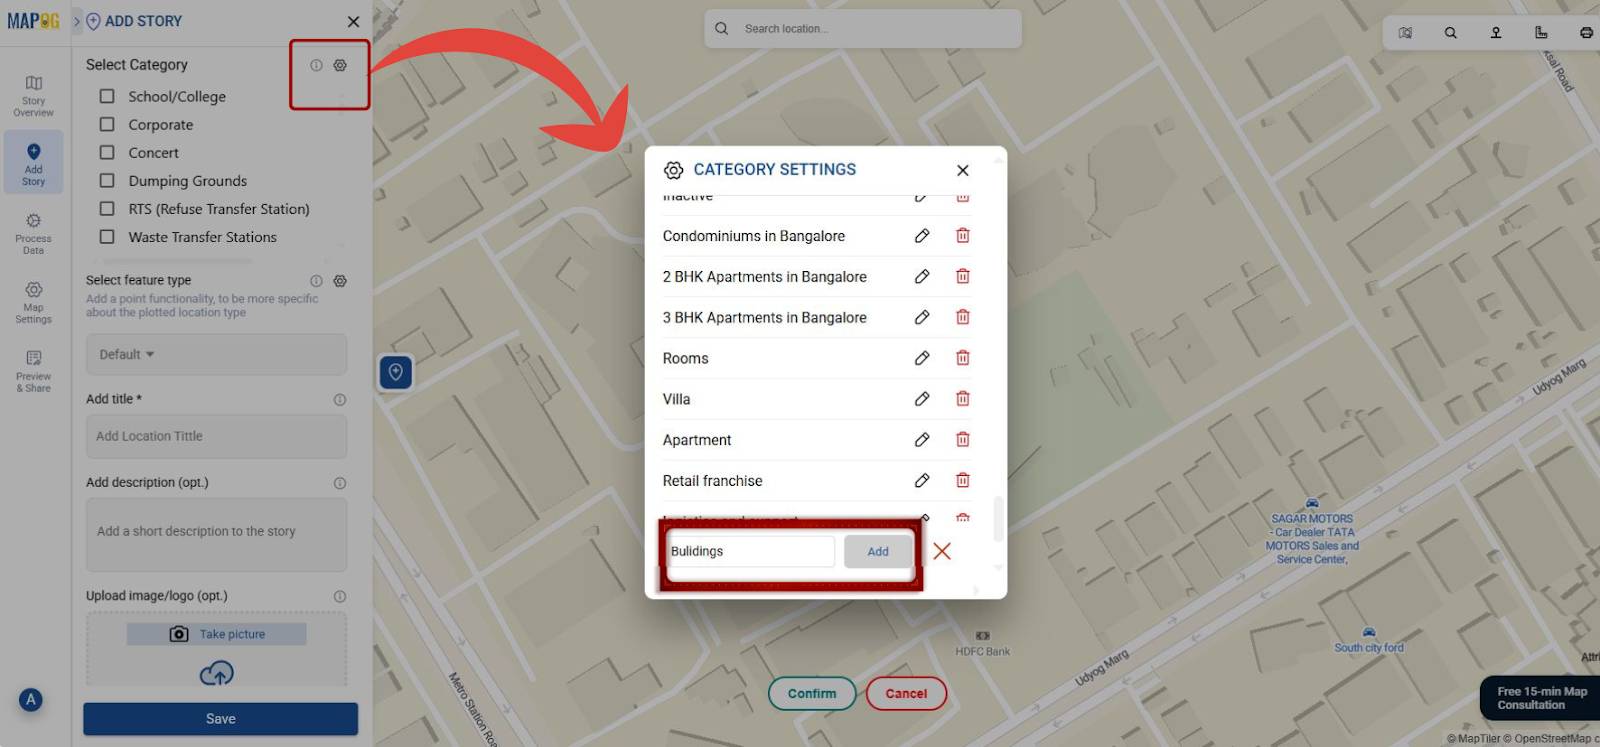
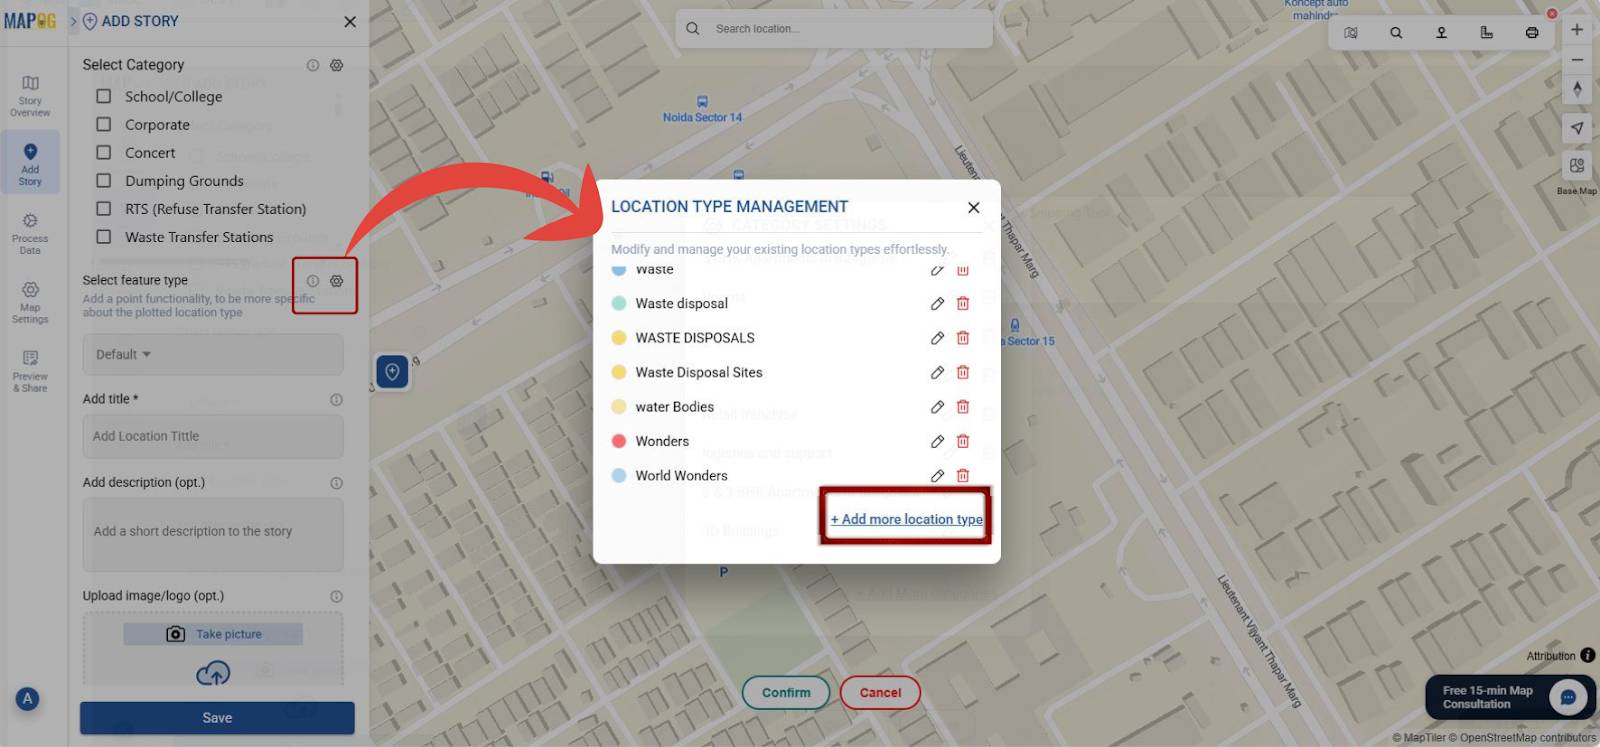
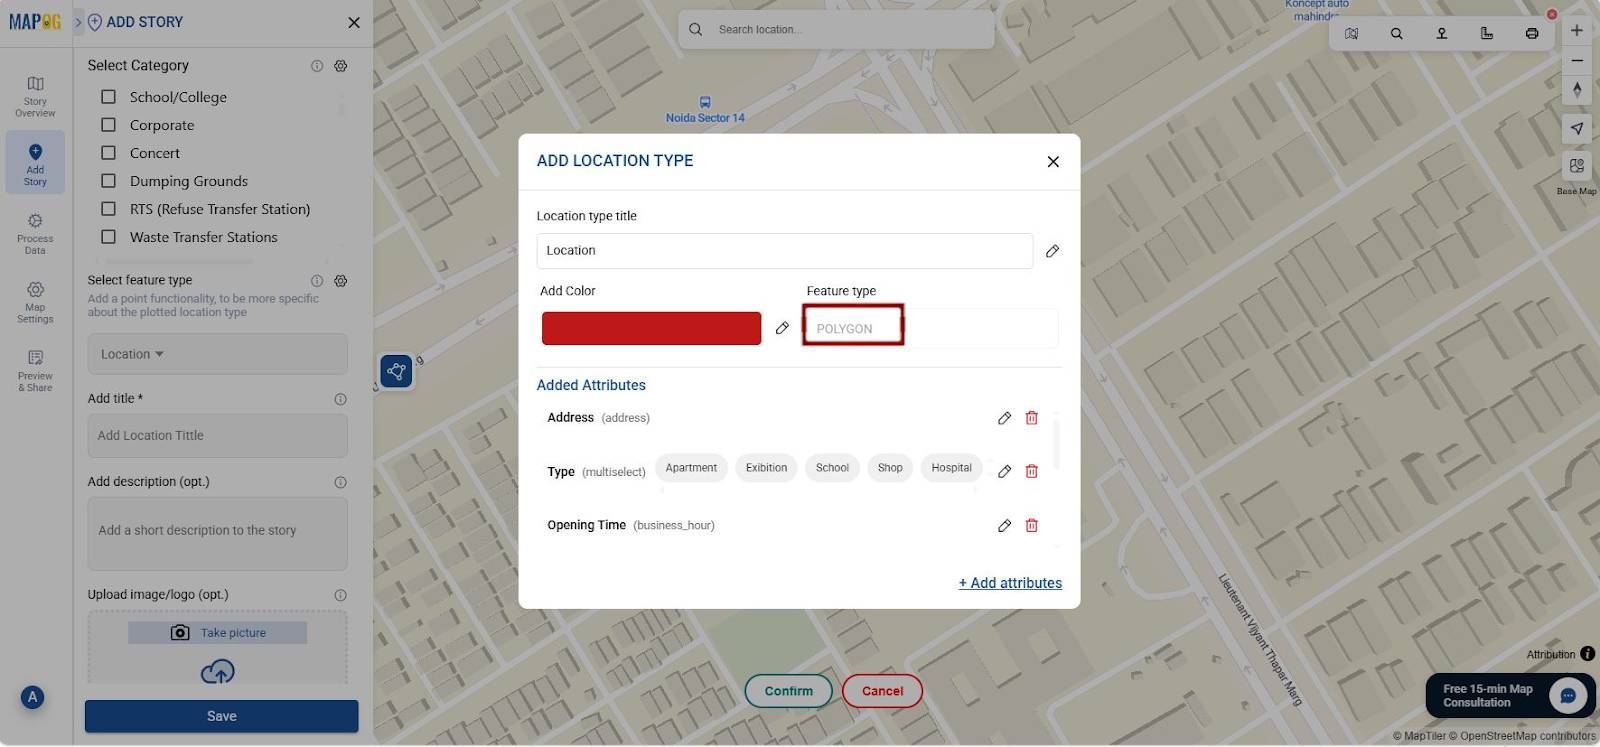
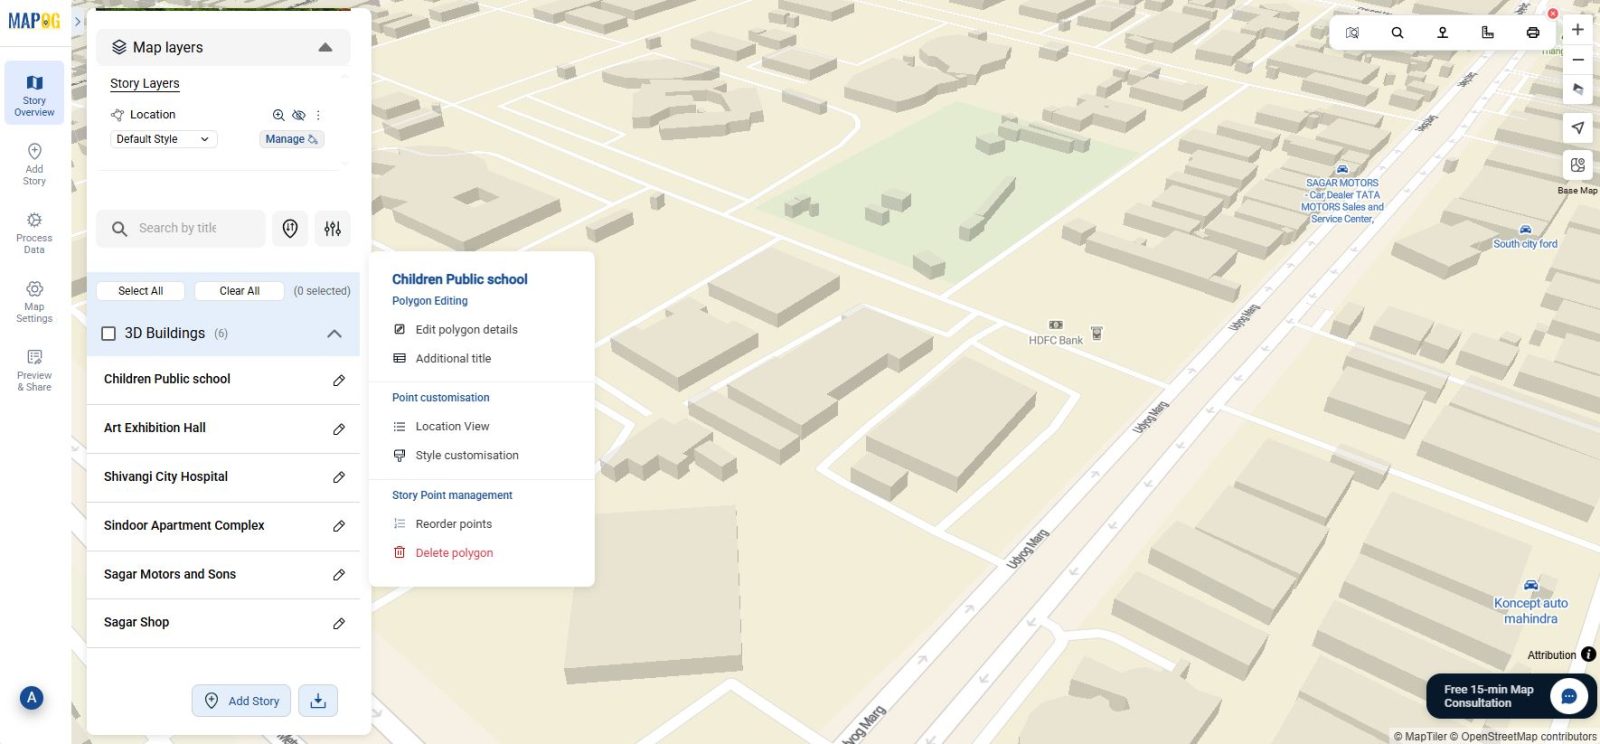
- Click on Select feature type settings option and then +Add more location type. Here you can add Location Type Title, add color and select Feature Type as Polygon. For true 3D accuracy, always use “polygons”, they capture real spatial extent for further analysis, which usually require enclosed spaces and cannot be achieved by point or polyline feature.
- Click on +Add Attributes to add location attributes as needed (Eg. Address, contact, email, opening hours, etc.).
2. Search and Add the Location to draw 3D Buildings
- Additionally, you can add location through search option or by giving the area’s latitude and longitude, otherwise simply type the name in the search bar.
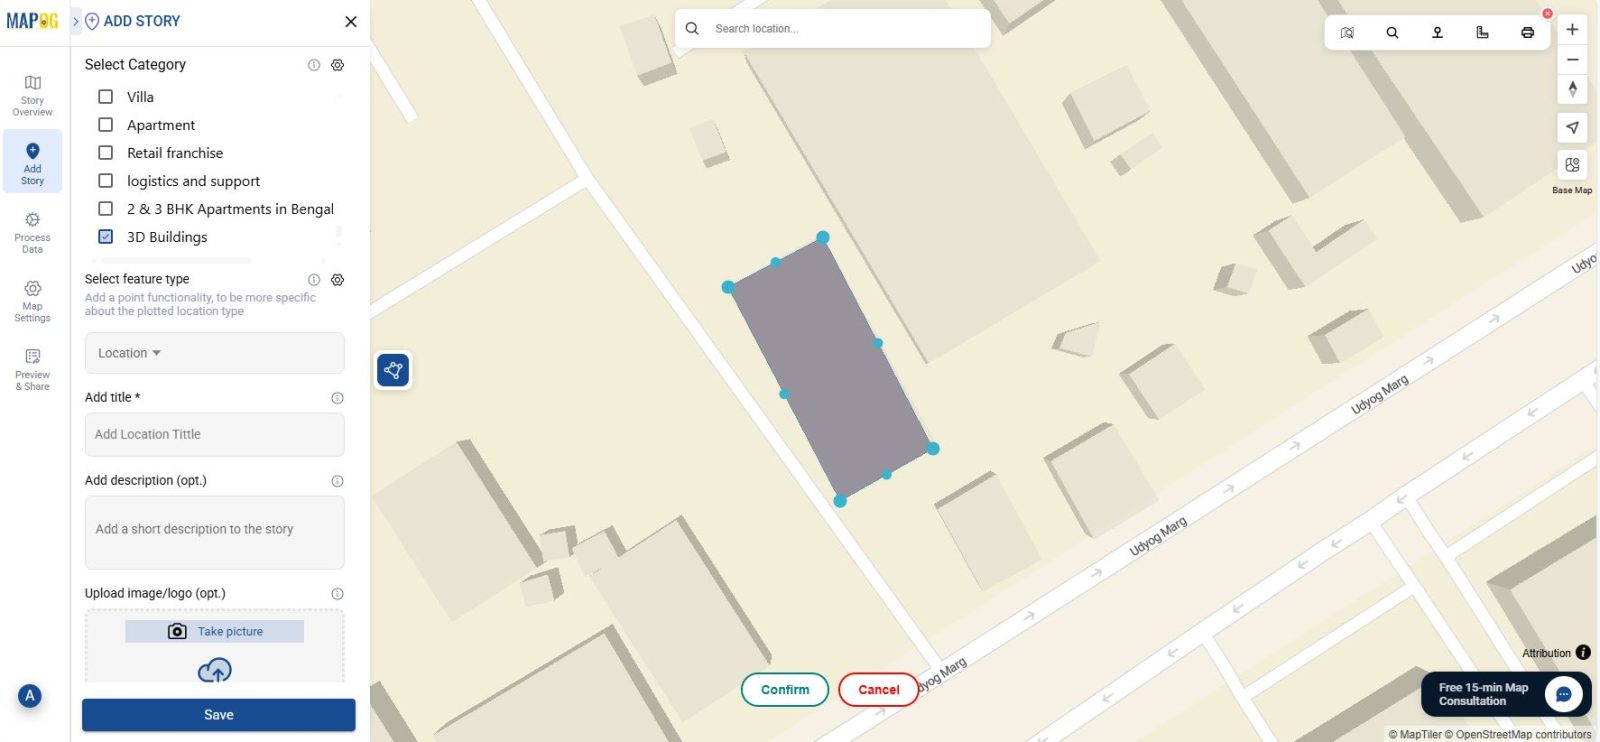
- Click on the polygon tool to draw the area on the map accordingly. It will thus define the base shape of a structure and the accuracy will directly affect how the 3D model will appear.
- Zoom in to the specific block and click on the map to mark the corners of the building. Each click will create a new vertex and will form a closed shape of the polygon. Click confirm to save.
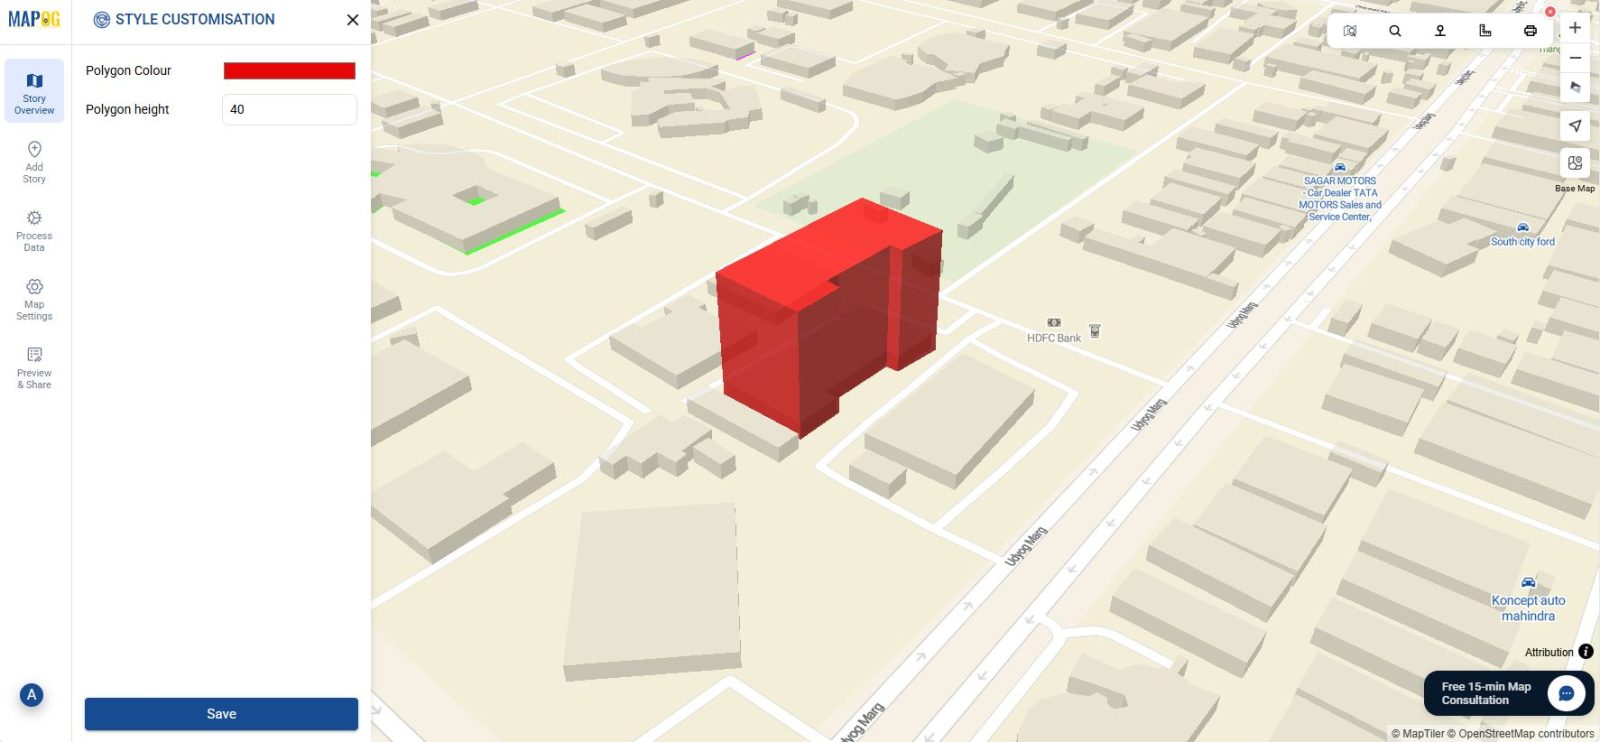
3. Customize Properties
- You can also customize your building by going to Style Customization.
- Change the building height or color accordingly. In general height proportions help in realistic visualization.
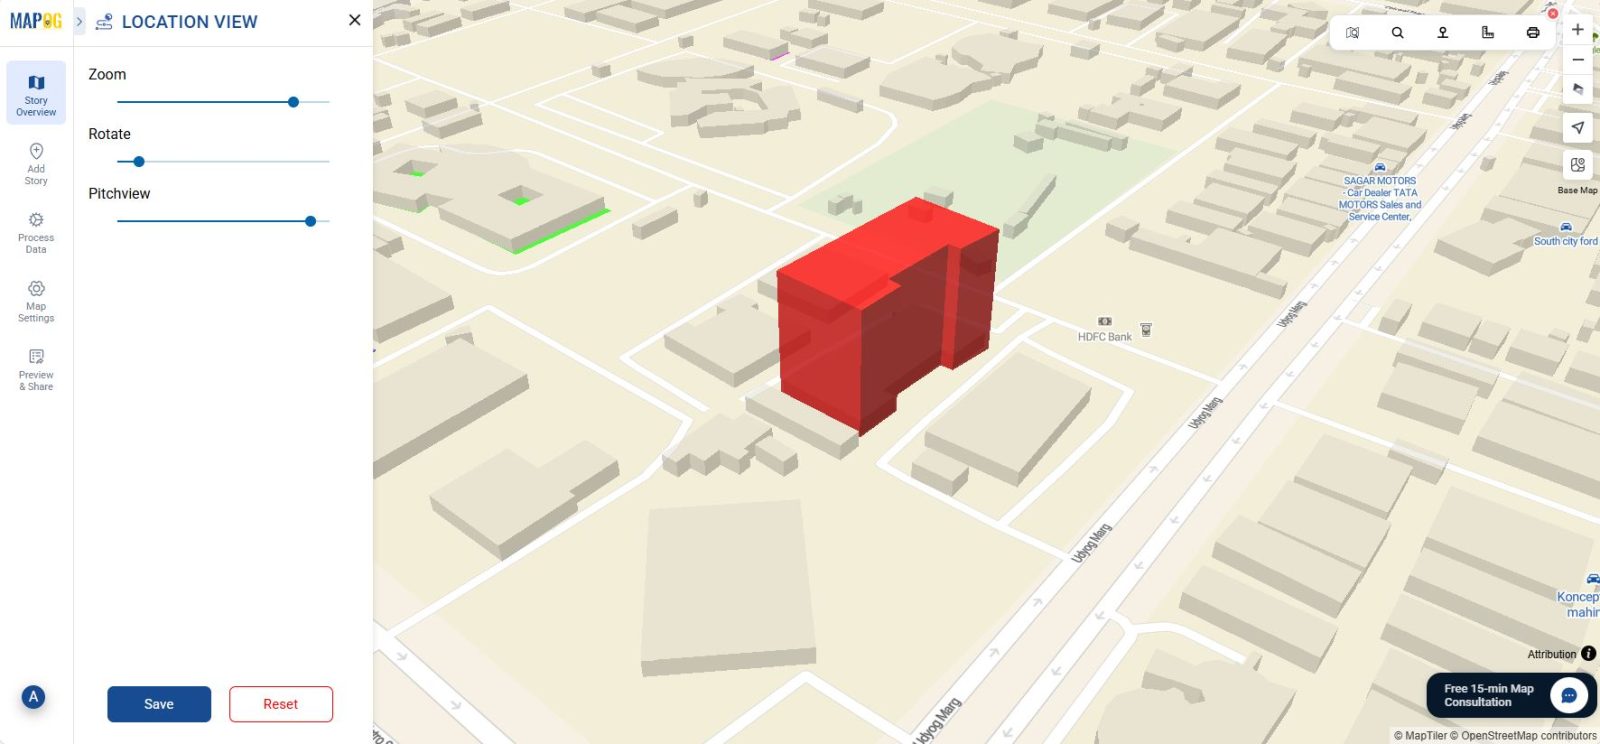
- Additionally you can click on Location View to adjust Zoom, Rotate and Pitch view, for better 3D visualization.
Industry Benefits of 3D Buildings
Without doubt 3D buildings in MAPOG have transformed how different industries plan, visualize, and present spatial information.
- Urban Planning and Smart Cities– 3D mapping allows visualization of city layouts by evaluating building heights and simulate new developments before construction. This leads to better urban design and efficient land use management.
- Real Estate and Property Development– Developers can not only showcase residential or commercial buildings in realistic 3D environments, but also additionally highlight nearby facilities.
- Infrastructure Management– 3D maps make it easier to identify spatial relationships between infrastructure, as a result, enhancing maintenance planning.
Final Thoughts
To conclude, drawing 3D maps in MAPOG is a smarter way to understand the spatial data. Thus, by combining simplicity, accuracy, and visualization power, MAPOG helps professionals across sectors bring their projects to life.
Have you ever created polygons in maps? Share your experience in the comments!