In today’s urban landscape, GIS for public transport optimisation is basically transforming how cities tackle congestion and improve mobility. By integrating spatial data with transit planning altogether, Geographic Information Systems help planners design smarter, more efficient transport routes that reduce traffic, improve accessibility, and enhance commuter satisfaction.
Understanding GIS for Public Transport Optimization and Why It Matters
GIS is a powerful tool for visualizing and analysing geographic data. When applied to public transport, tools like MAPOG help integrate traffic patterns and infrastructure data to support strategic planning. As a result, planners can identify underserved zones, optimize road networks, and predict traffic flow more efficiently.
Key Concepts of GIS for Public Transport Optimization:
- Enhanced Route Planning: GIS helps in designing optimal routes significantly by analyzing traffic density, population clusters, and road conditions. Similarly this minimizes delays and improves punctuality.
- Traffic Reduction: By optimizing public transport routes, more people are encouraged to use buses and trains instead of private vehicles, reducing overall traffic congestion.
- Environmental Impact: Reduced traffic and also improved route efficiency lower carbon emissions, contributing to cleaner urban environments.
How to Use GIS for Public Transport Optimization Through Interactive Mapping
Creating a traffic flow or route optimization map using GIS involves the following steps:
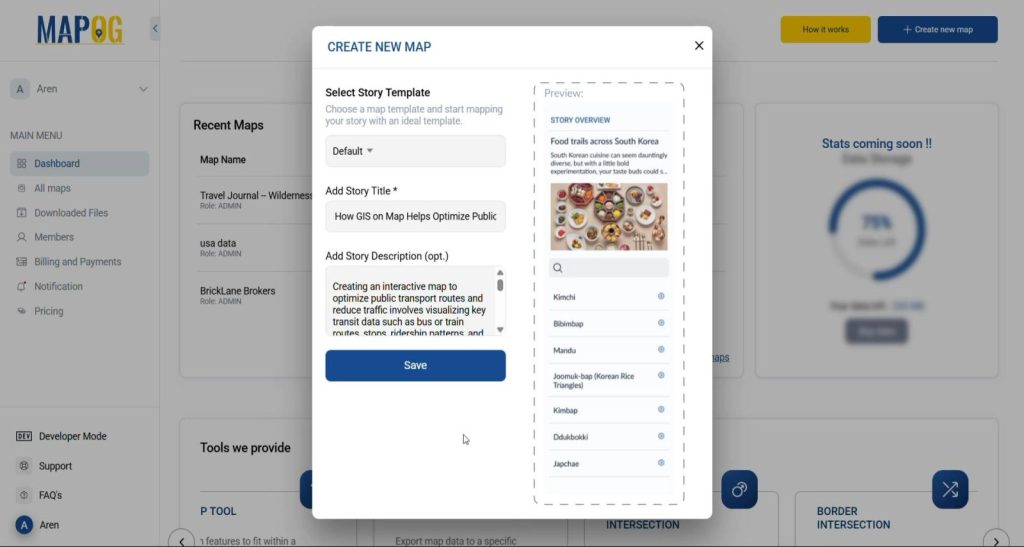
1. Create New Map on MAPOG’s Mapping Platform:
Click on “Create New Map” in the top- right corner of MAPOG to start creating your own map.
Place the following details on your map:
- Add the title of your map. Description telling us about the map. And a nice Image to symbolize your traffic map for that reason.
- After that, click Save.
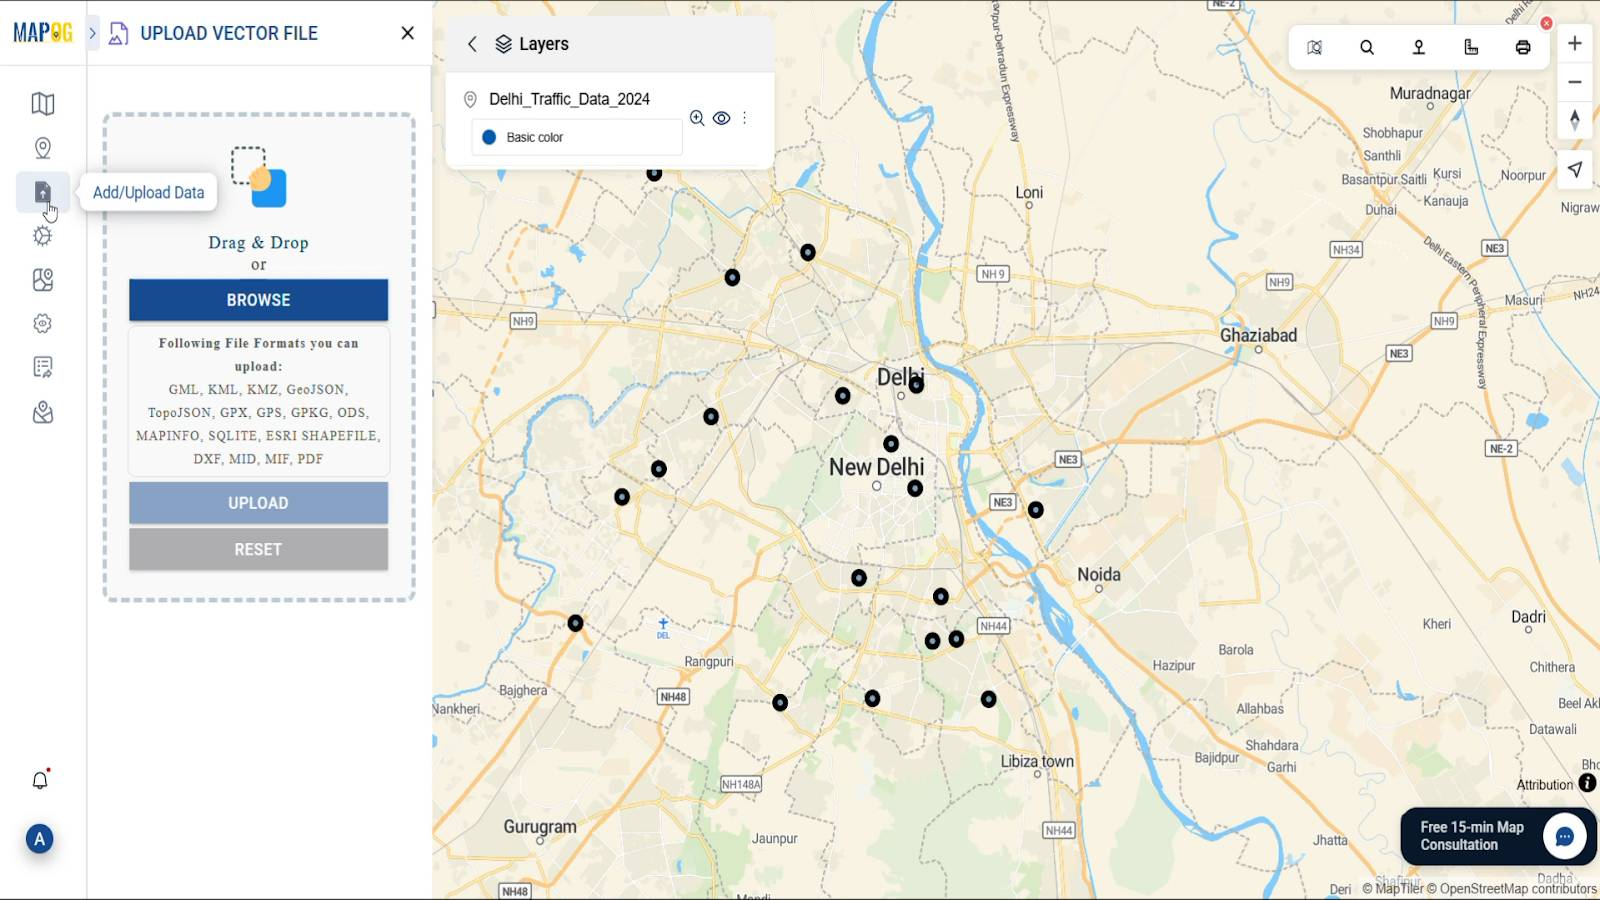
2. Add Data for Public Transport Optimization :
Subsequently, Click on the “Add/Upload Data” button to add the necessary data.
- Use Upload Vector data to upload transportation data containing particularly the description of the place.
- Upload different traffic rates using Upload CSV/Excel table.
After selecting the data, click Upload.
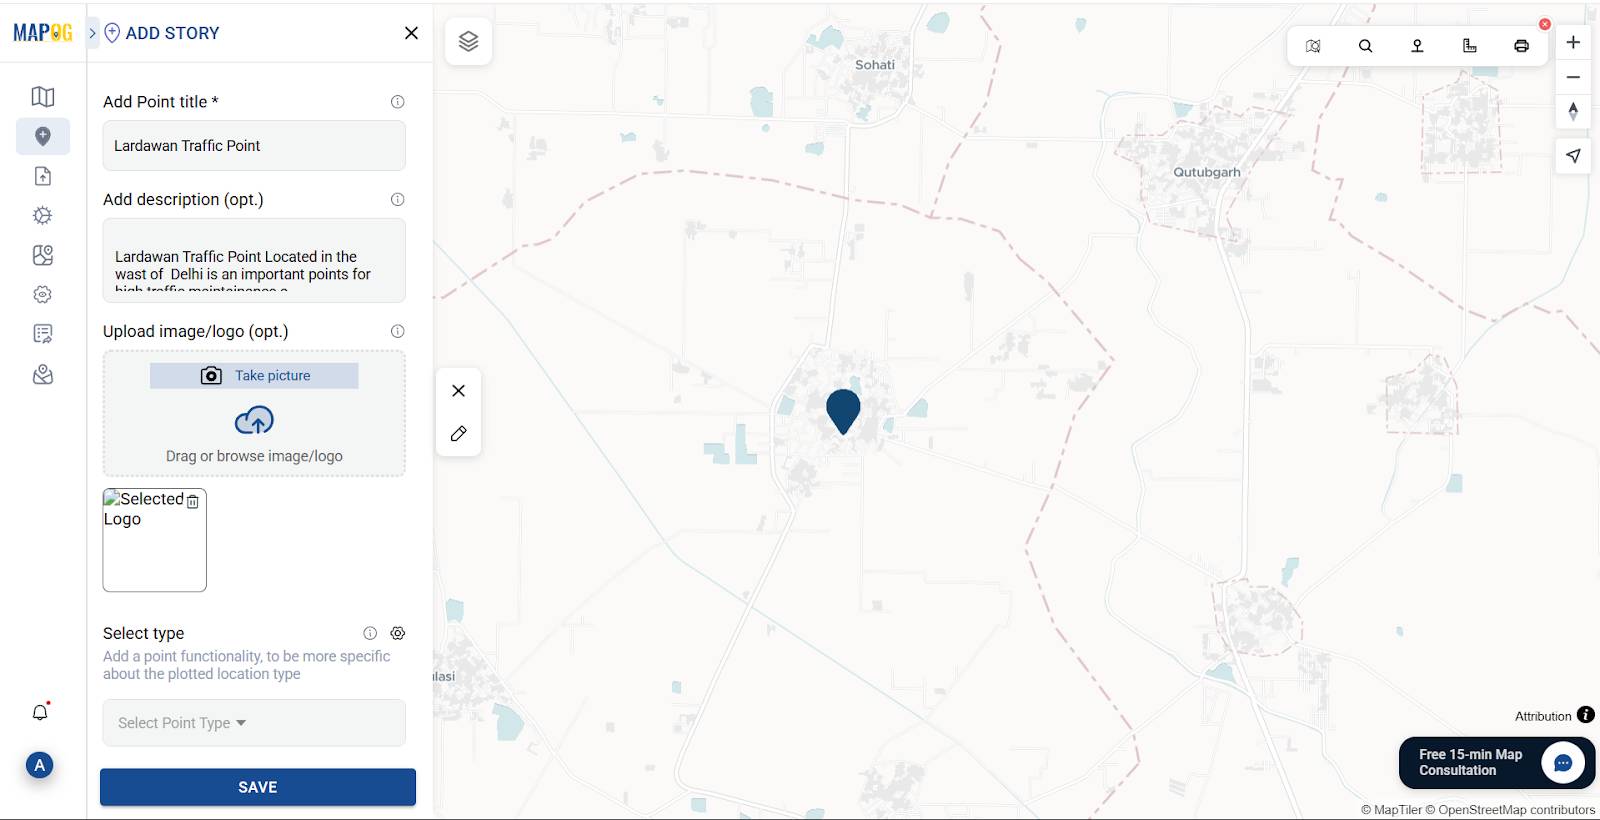
3. Add Different Traffic Points using Add story:
Click on “Add Story” and then click on “Add Manually”
- Select “Add Point“.
- Search the point using manual location i.e. pointing or by entering the coordinates of the point.
Stick with the default settings and enter the following for proper travel route planning :
- A Title for the point i.e. (like the name of the destination),
- A Description about the location for suitable travel route,
- And a clear Image representing that place.
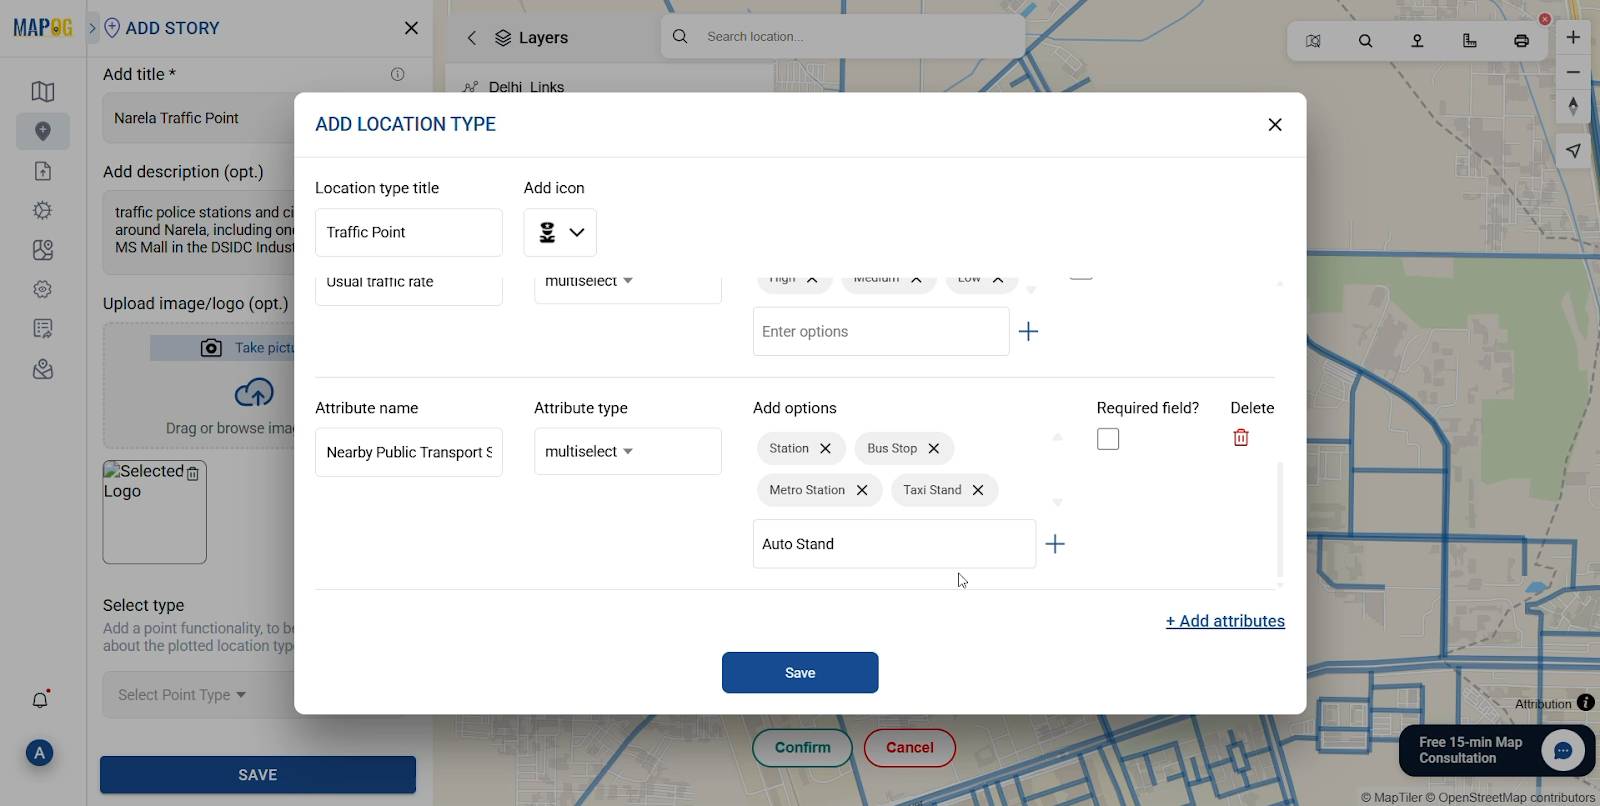
4. Add attributes to the story point:
Click on “Select Point Type” to add the attributes of the Map;
Add attributes like:
- Traffic Point names.
- Traffic Description.
- Nearest Police Station
- Contact information.
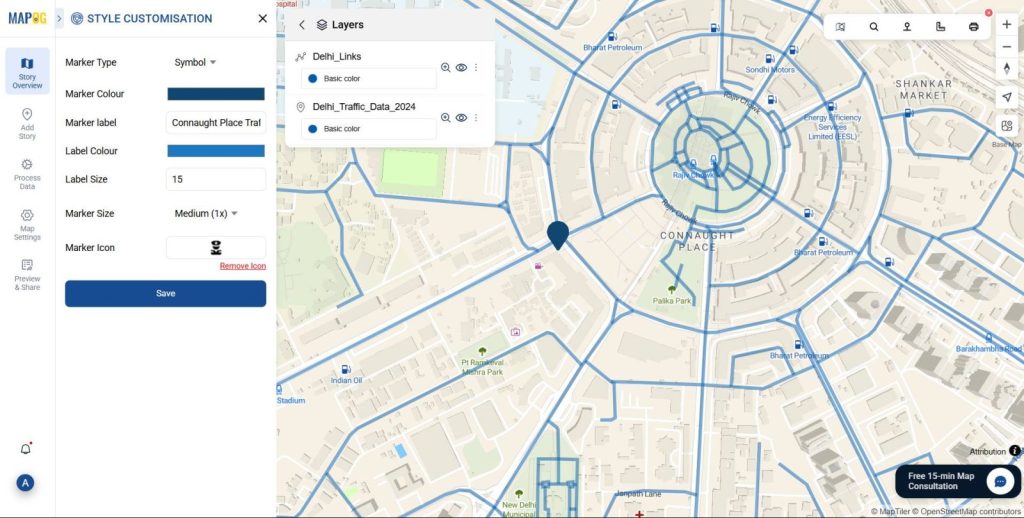
5.Use Point Customisation:
Customize the Points by:
- Adding Point Icons for proper visualisation.
- Adding Labels to the Points.
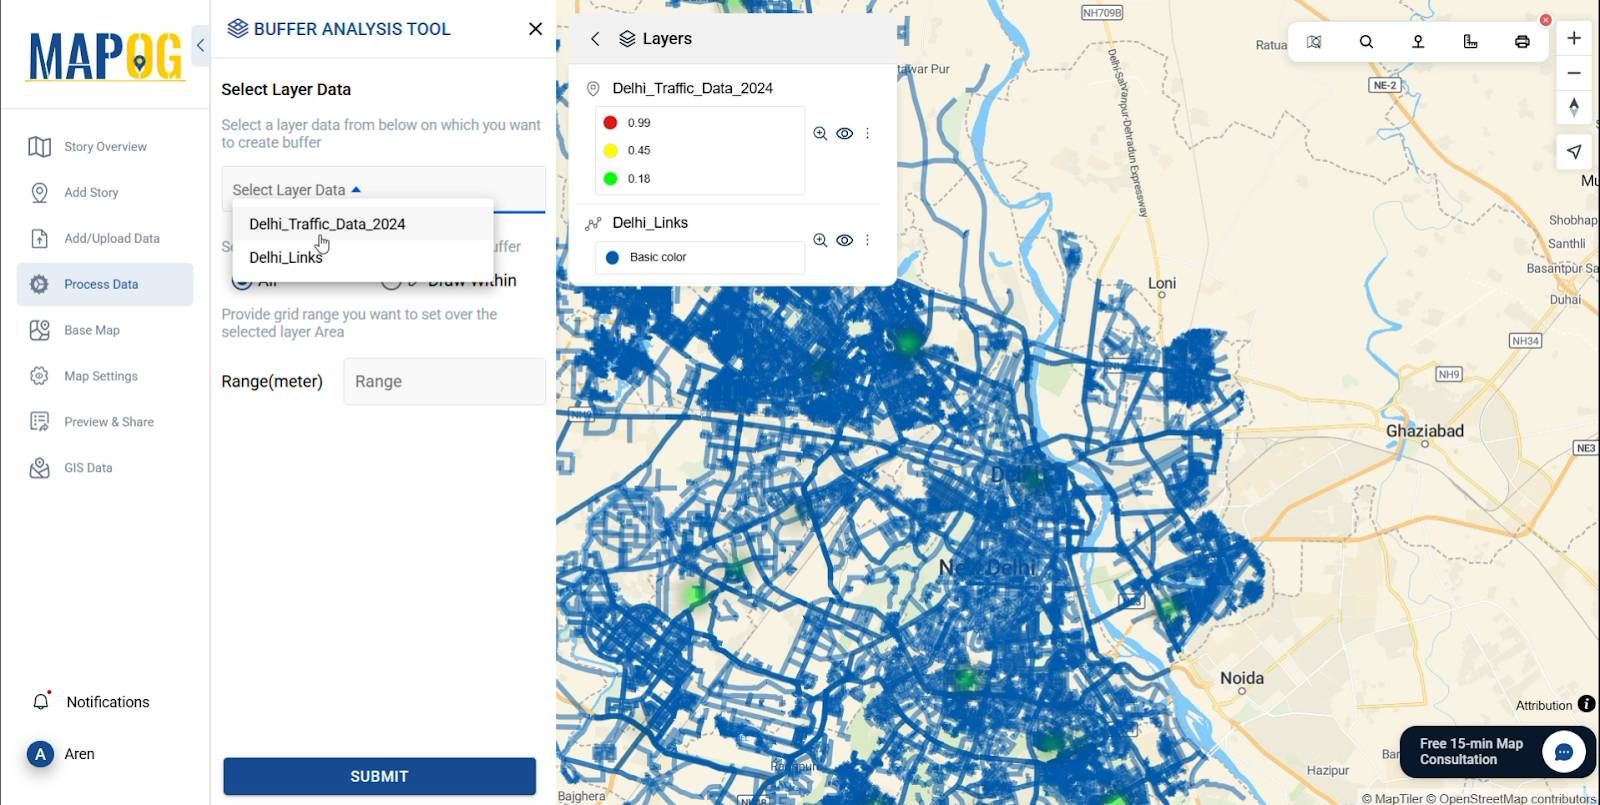
6. Add a Buffer layer to Determine the roads near the points:
Create a Buffer layer to get overall a visualization of the traffic involved areas near the junctions boots. Using Buffer tool in Process Data to create a Buffer layer of 2-5 Kms within the traffic points.
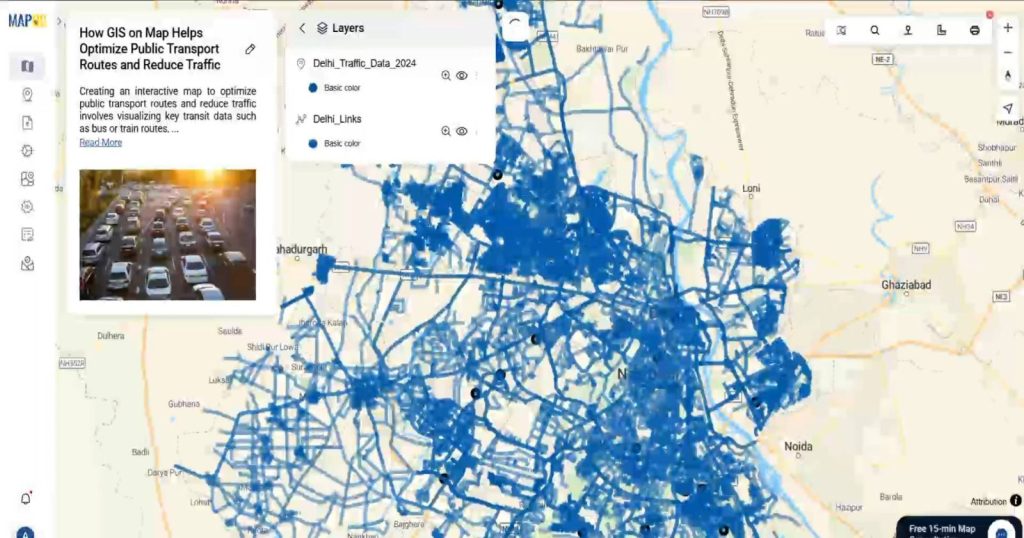
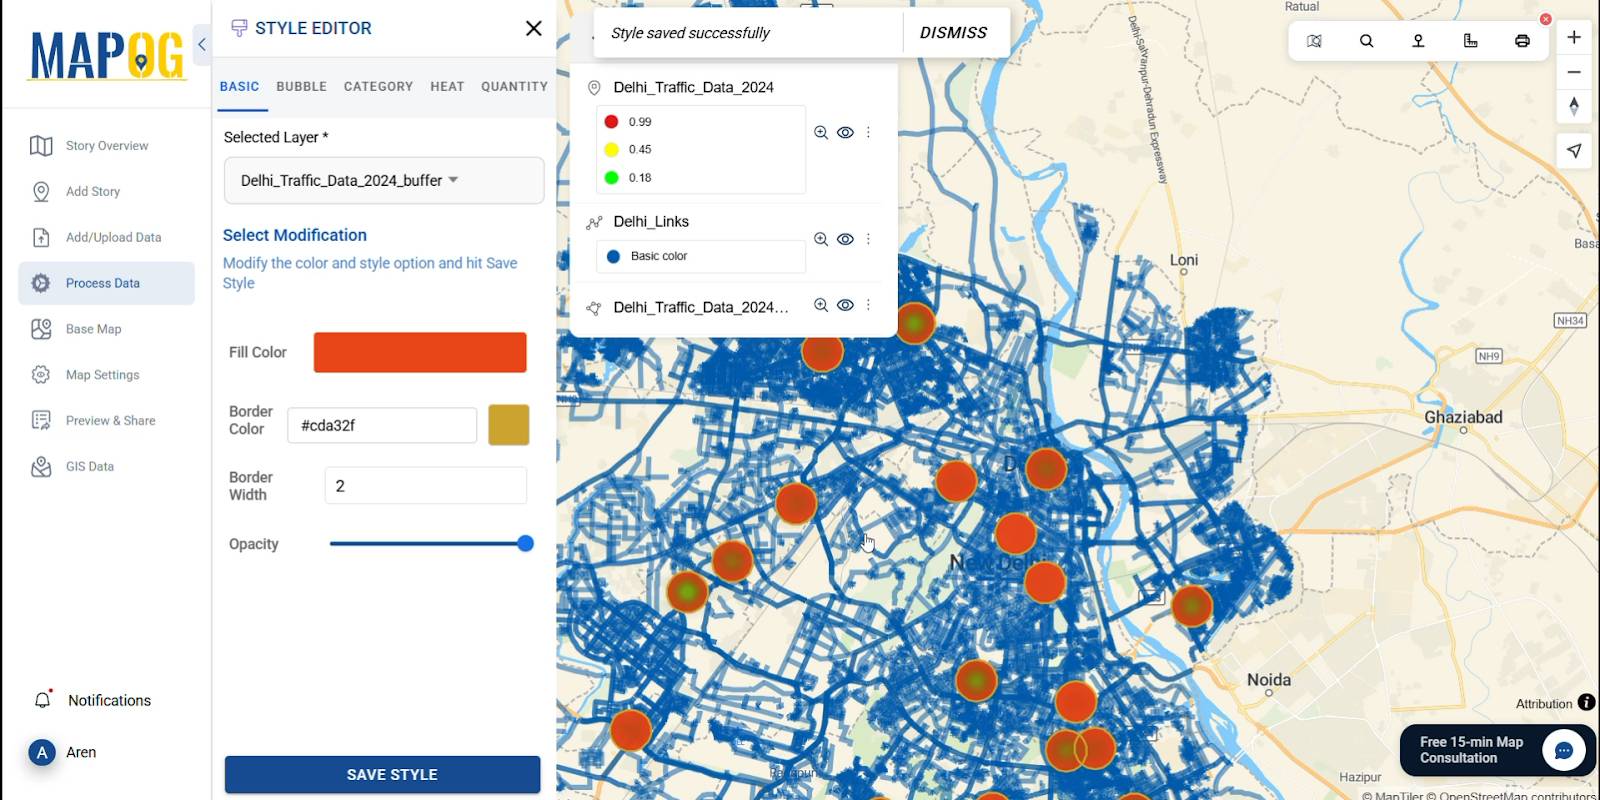
6. Style Layers in the map:
Style the layers according to the visualisation criteria and necessities for the different map elements like;
- Road Pattern: Use different colours to distinguish between different road patterns.
- Traffic Rate: Use suitable colours to describe the traffic rate.
- Road Density: It can be visualised using colour mediation among the places.
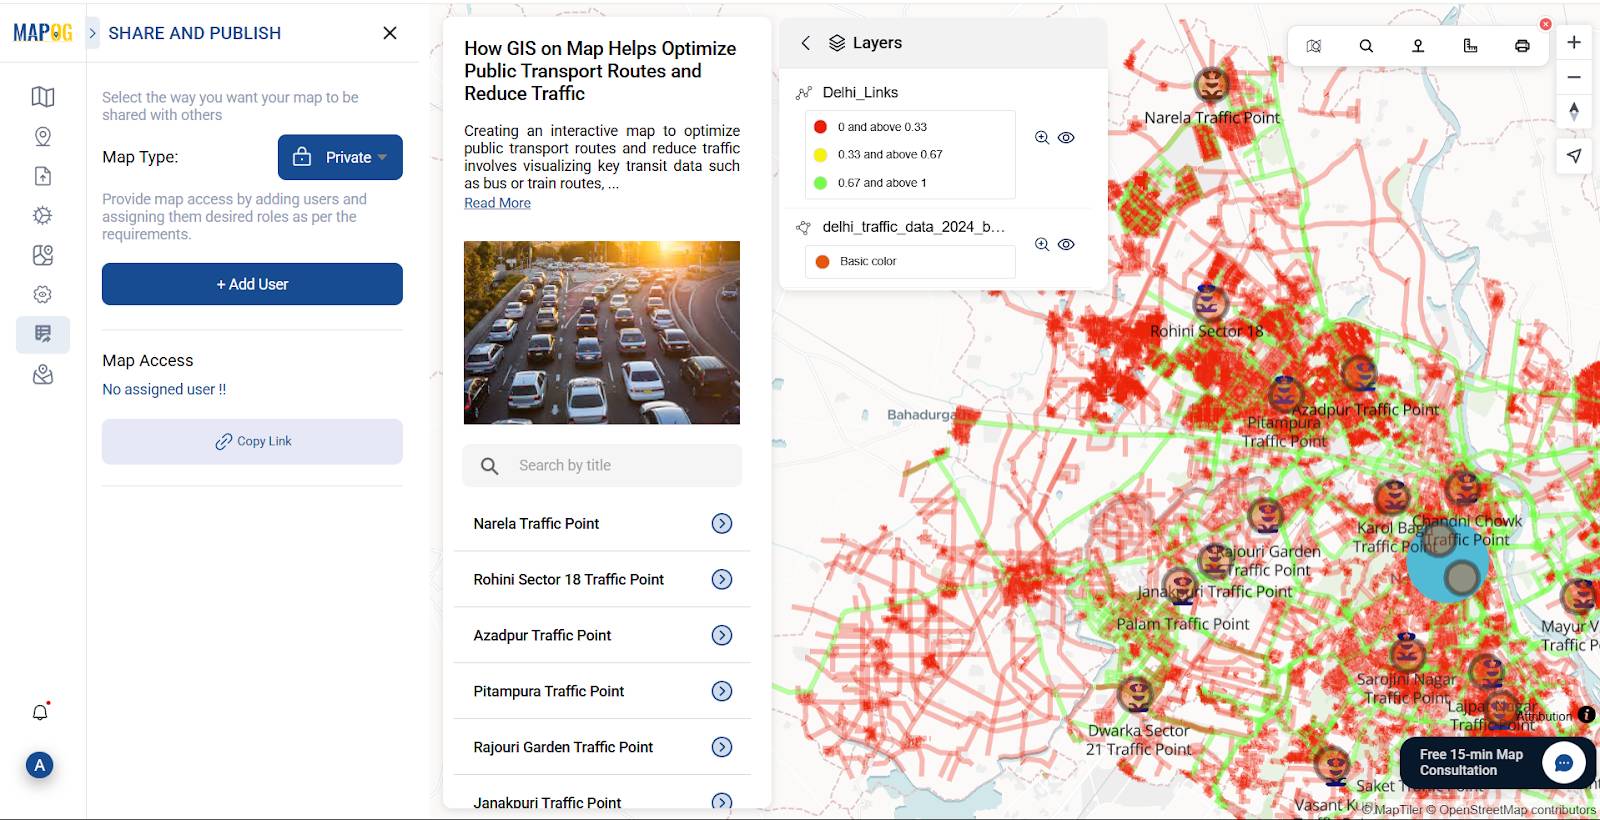
Publish and Share:
With the help of the publish and share option, you hence can share it and distribute it to anybody.
Industry & Benefits:
The different metro cities experience significant traffic congestion due to high population density and car dependency. In 2024, average commute times often exceeded 60 minutes during peak hours. GIS analysis can simultaneously identify congestion hotspots, assess commuter behaviour.
Conclusion:
GIS for public transport optimization is transforming how cities manage mobility. With tools like MAPOG, planners can visualize routes, identify traffic issues, and make data-driven decisions. This leads to reduced congestion, better commuter experiences, and smarter, more sustainable urban transport systems—essential for growing cities.
Try It Now and Share your thoughts and experiences in the comments below.
You can check more Articles from the MAPOG links given by: