Traffic congestion and road accidents are major challenges in urban areas, leading to economic losses, increased pollution, and safety risks. As a result, Geographic Information Systems (GIS) have emerged as a powerful tool for analyzing, visualizing, and optimizing traffic flow while enhancing road safety. As a result of integrating spatial data, traffic authorities can identify high-risk zones, optimize signal timings, and implement data-driven solutions using this maps, GIS traffic management mapping and road safety tools like MAPOG helps reduce accidents, improve mobility, and optimize planning.
This article will explore how MAPOG, an advanced GIS platform, enables urban planners and traffic management teams to create detailed traffic analysis maps. We will provide a step-by-step guide on mapping high-traffic areas and accident-prone zones, followed by real-world applications of GIS in improving road safety.
Key GIS Concepts for Traffic Management
How GIS Platforms Like MAPOG Help in Traffic Congestion Analysis
The term “mapping traffic safety and congestion zones” refers to the spatial process of plotting key urban mobility data, such as accident locations, road types, and signal points, onto an interactive map. In particular, Hotspot and buffer analysis help identify areas with frequent collisions or congestion. Furthermore, they clarify how these incidents overlap with infrastructure like intersections or pedestrian zones. Combined with traffic volume data, this layered approach brings clarity to where and why road safety risks are concentrated.
Furthermore GIS Approach explores how modern platforms like MAPOG are transforming how we visualize, monitor, and solve traffic challenges. This quick read uncovers how interactive maps turn raw data into insights essential for city planners, road engineers, and public safety teams. Don’t miss how technology is driving smarter, safer streets through spatial intelligence.
Step-by-Step Guide to Mapping Traffic Hotspots and Accident Zones Using MAPOG
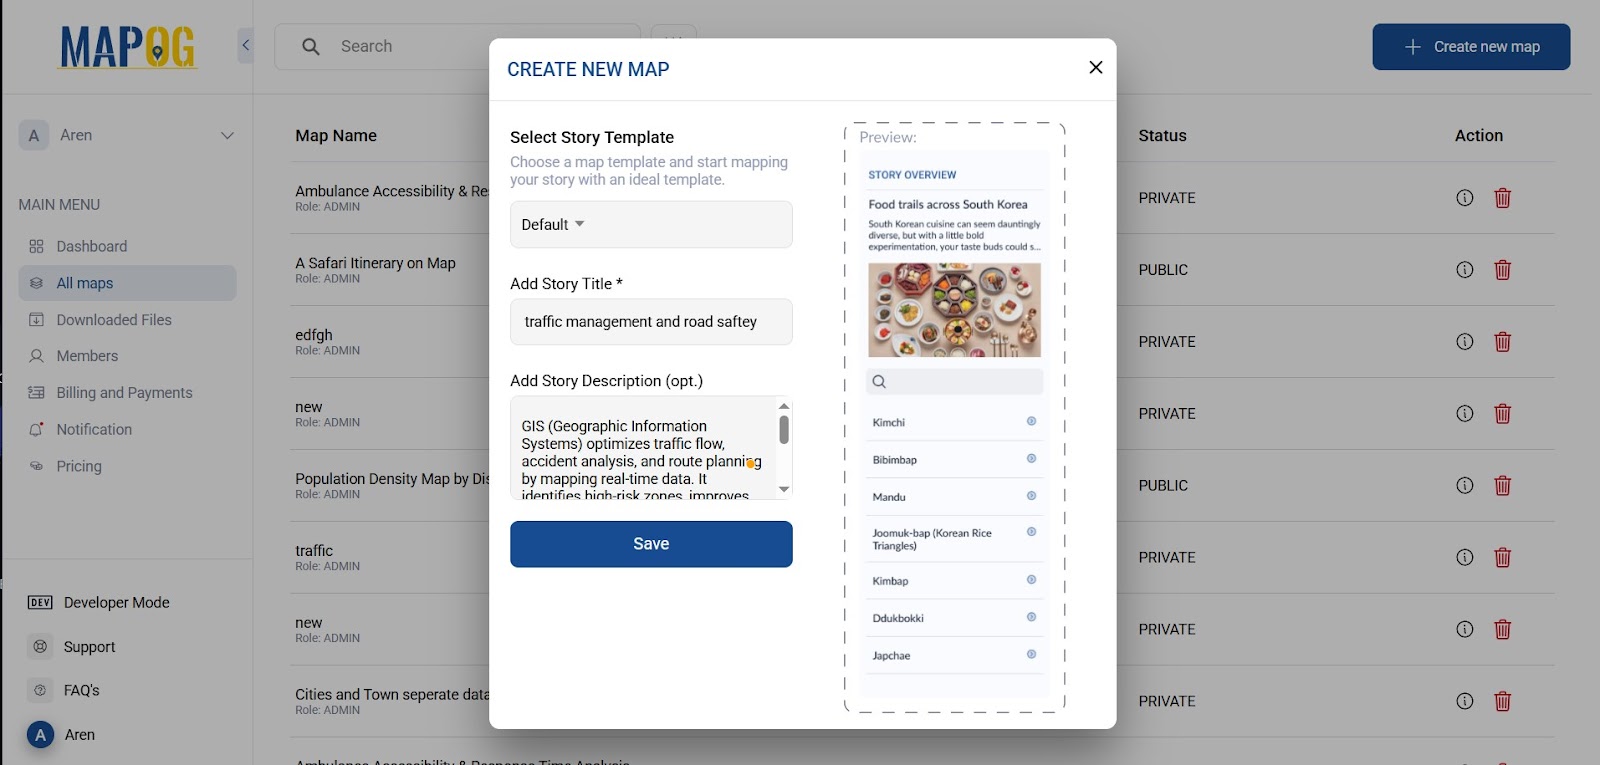
Step 1: Setting Up a New Traffic Analysis Map
Start by logging into the MAPOG platform. Once you’re in, click on “Create New Map.” Enter a relevant title such as Traffic & Accident Analysis and write a short description about the objective of your map. After that, simply save the map.
Step 2: Importing Road Network Data for Detailed Analysis
With your new map set up, next, import road network data for detailed analysis.”Go to the “Upload Data” section and select “GIS Data.” Choose the appropriate administrative levels—Country, then State, District, and finally Block. From the available layers, select “Transport Roads” to load all major and minor roadways onto your map.
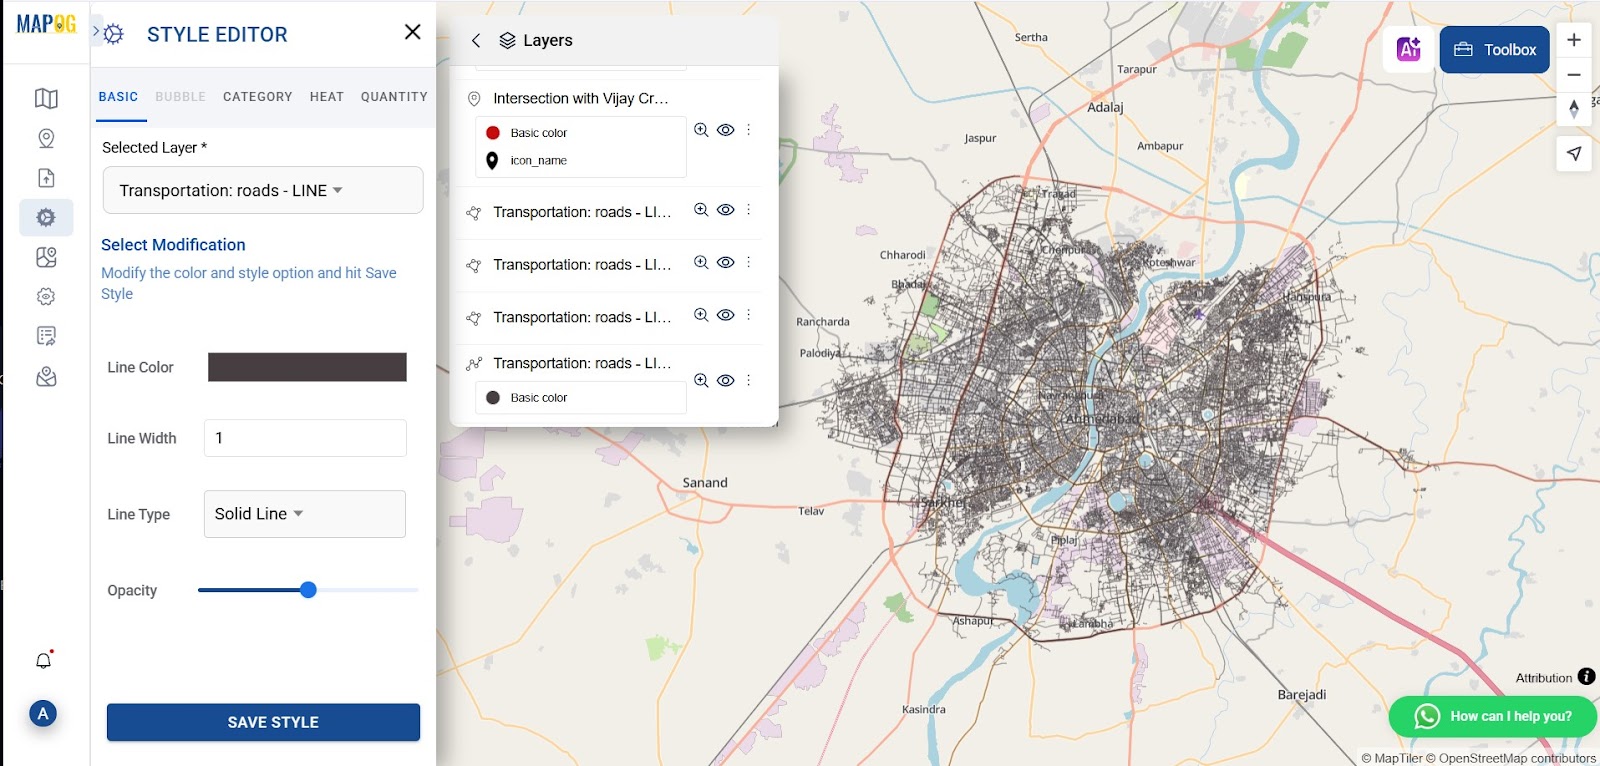
Step 3: Customizing Road Layers for Better Clarity
To make your road data more readable, head to the “Style Editor.” Here, you can enhance visibility by adjusting the opacity (setting it around 70% allows other layers to show through). You can also change the width of the lines—make highways appear thicker and local streets thinner. If needed, use solid lines for operational roads and dashed lines for under-construction ones to visually differentiate them.
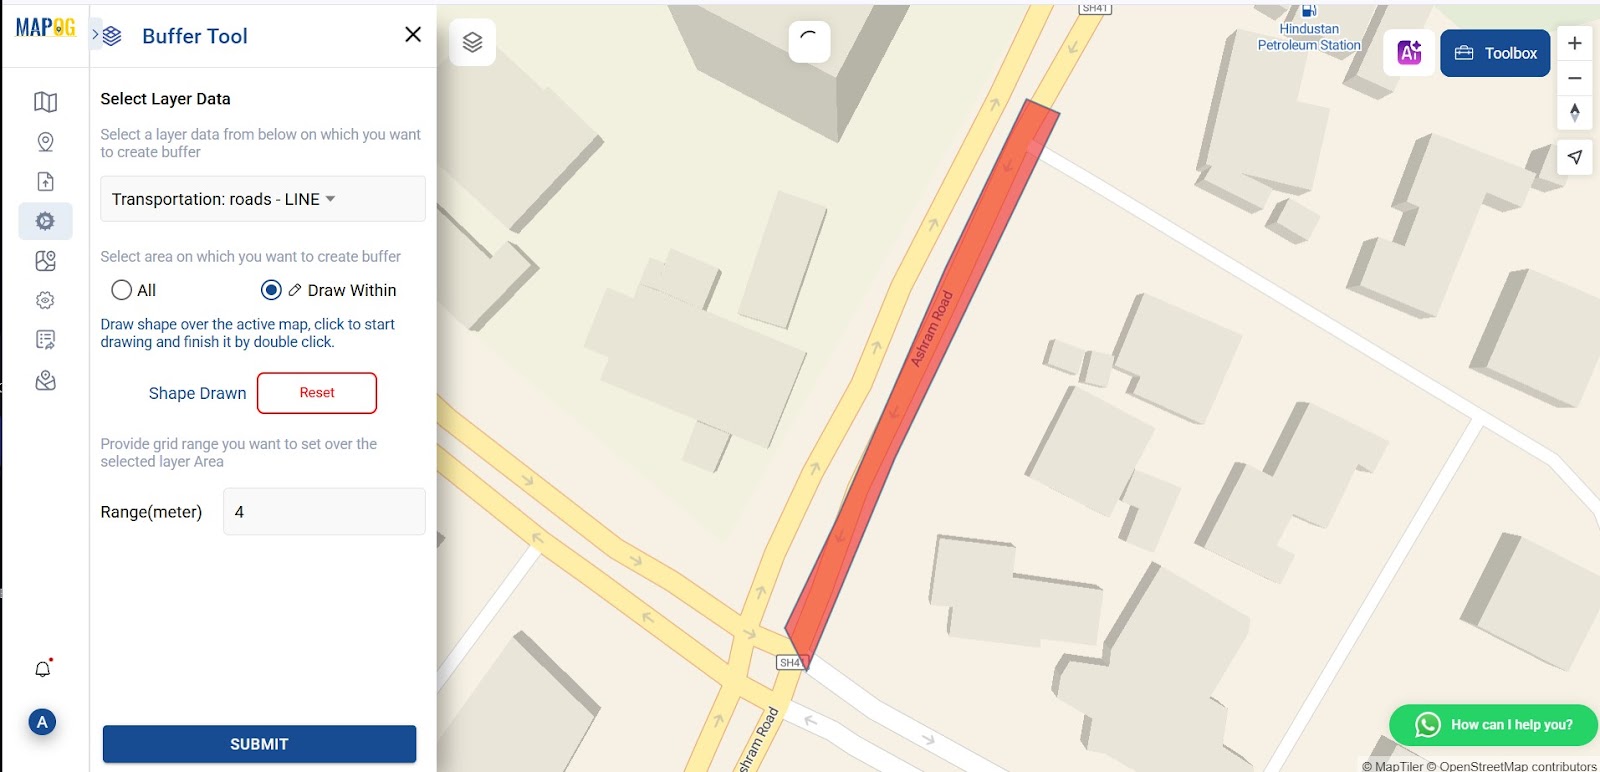
Step 4: Analyzing High-Traffic Areas with Buffer Zones
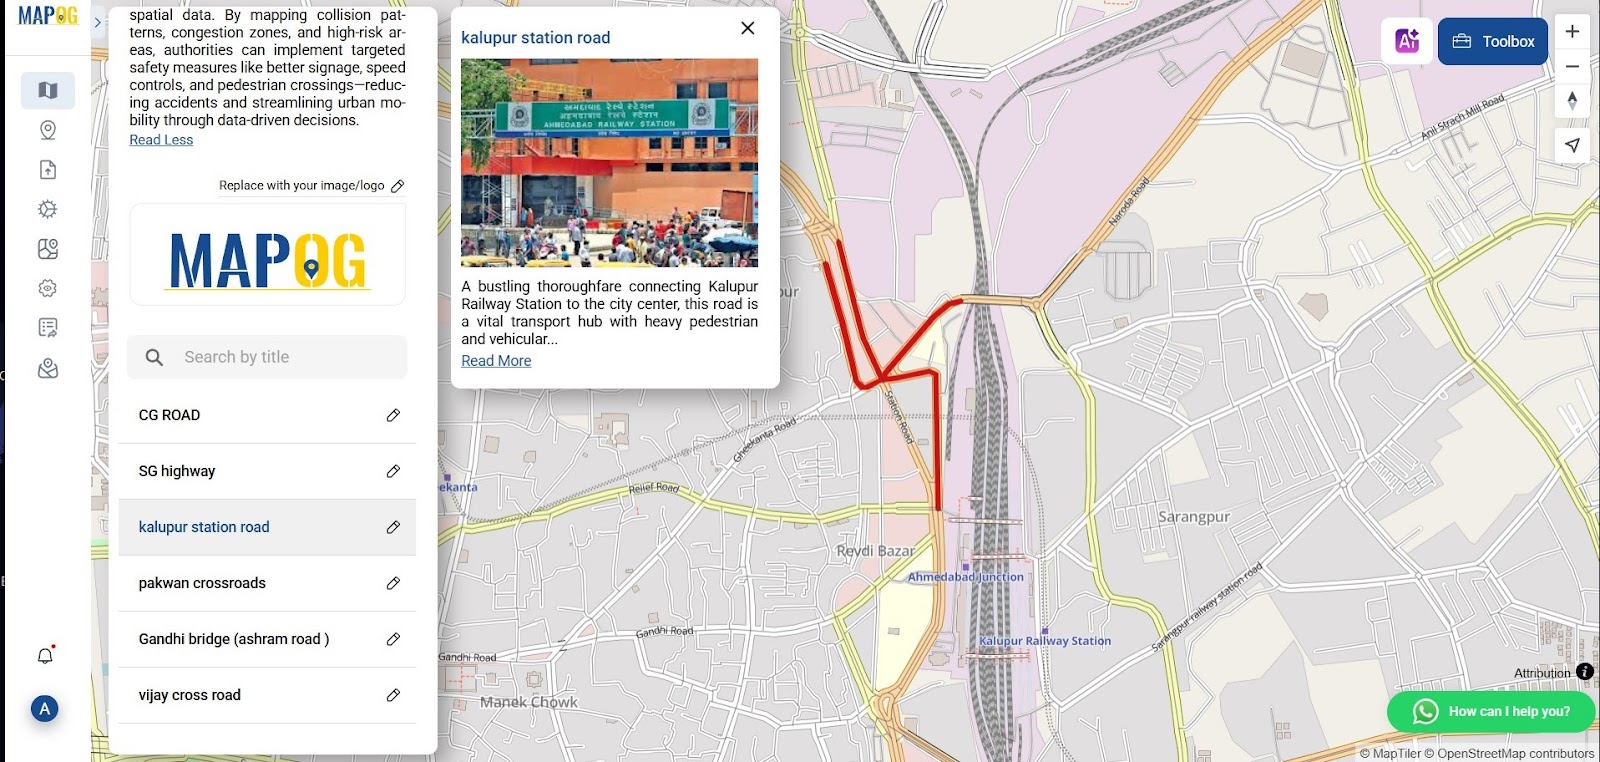
To analyze congestion areas, go to Process Data and select the “Buffer Tool.” Choose the “Area” option and use “Draw Within” to sketch over the most traffic-heavy zones of the particular area. Once the shape is completed with a double-click, set a buffer range (e.g., 500 meters). Style these zones with a red color, solid lines, and a 3-pixel width to make them identifiable as high-traffic areas.
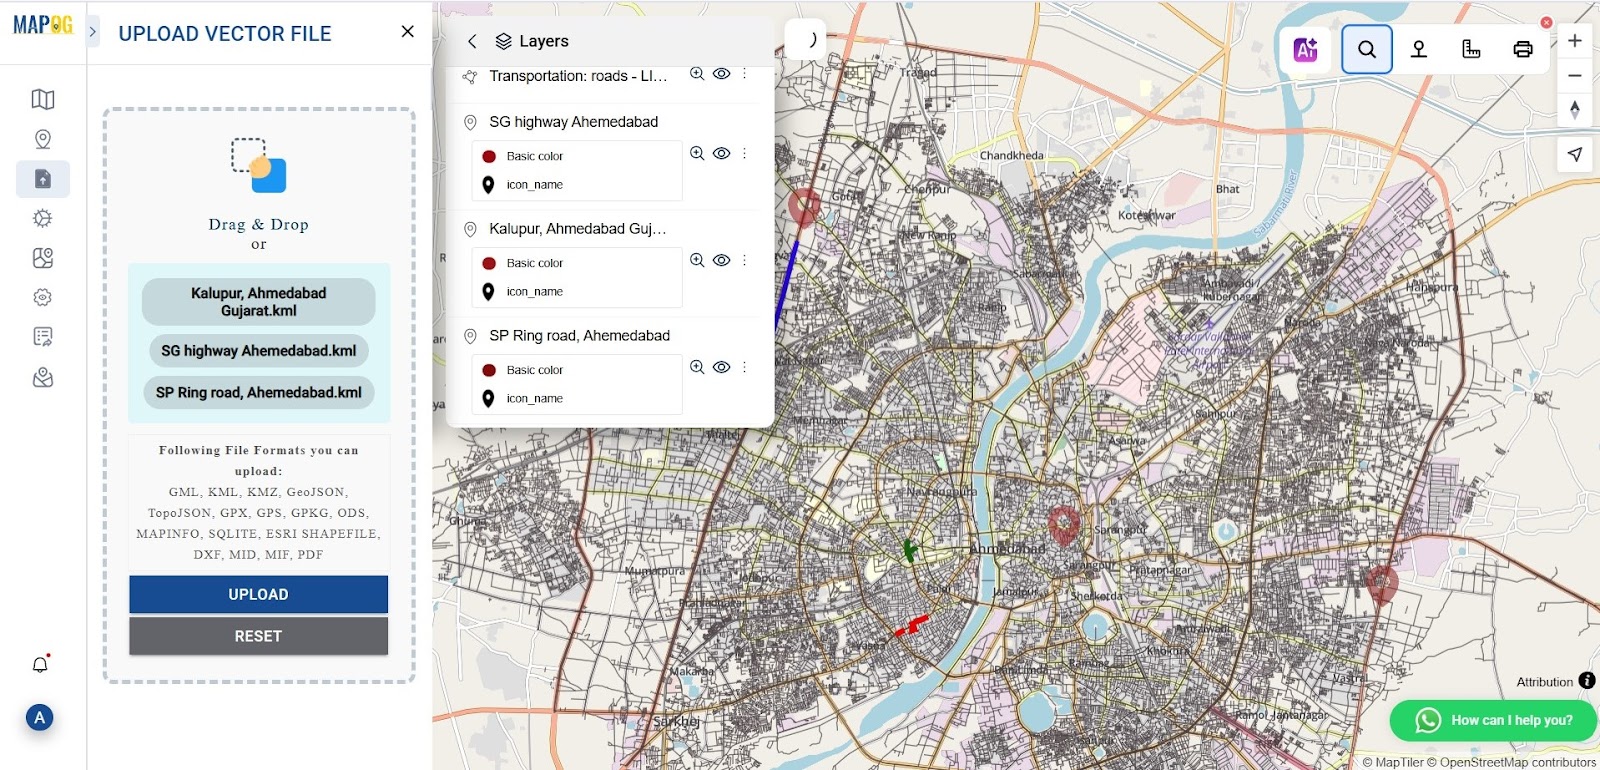
Step 5: Adding Accident-Prone Zones Using KML Files
Next, upload Vector files that mark accident-prone locations under the “Upload Vector Files” section. Once uploaded, navigate to “Style Editor,” select “Basic Icon,” and assign a visual warning symbol such as a red exclamation mark. This helps in marking zones with a history of accidents.
Step 6: Marking Critical Points and Hotspots for Better Insights
For additional detail, use the “Add Point” from the add story to manually highlight crucial traffic or accident hotspots. With a title and description like “Connects two industrial hubs; peak-hour congestion common,” and upload a photo to provide visual evidence.
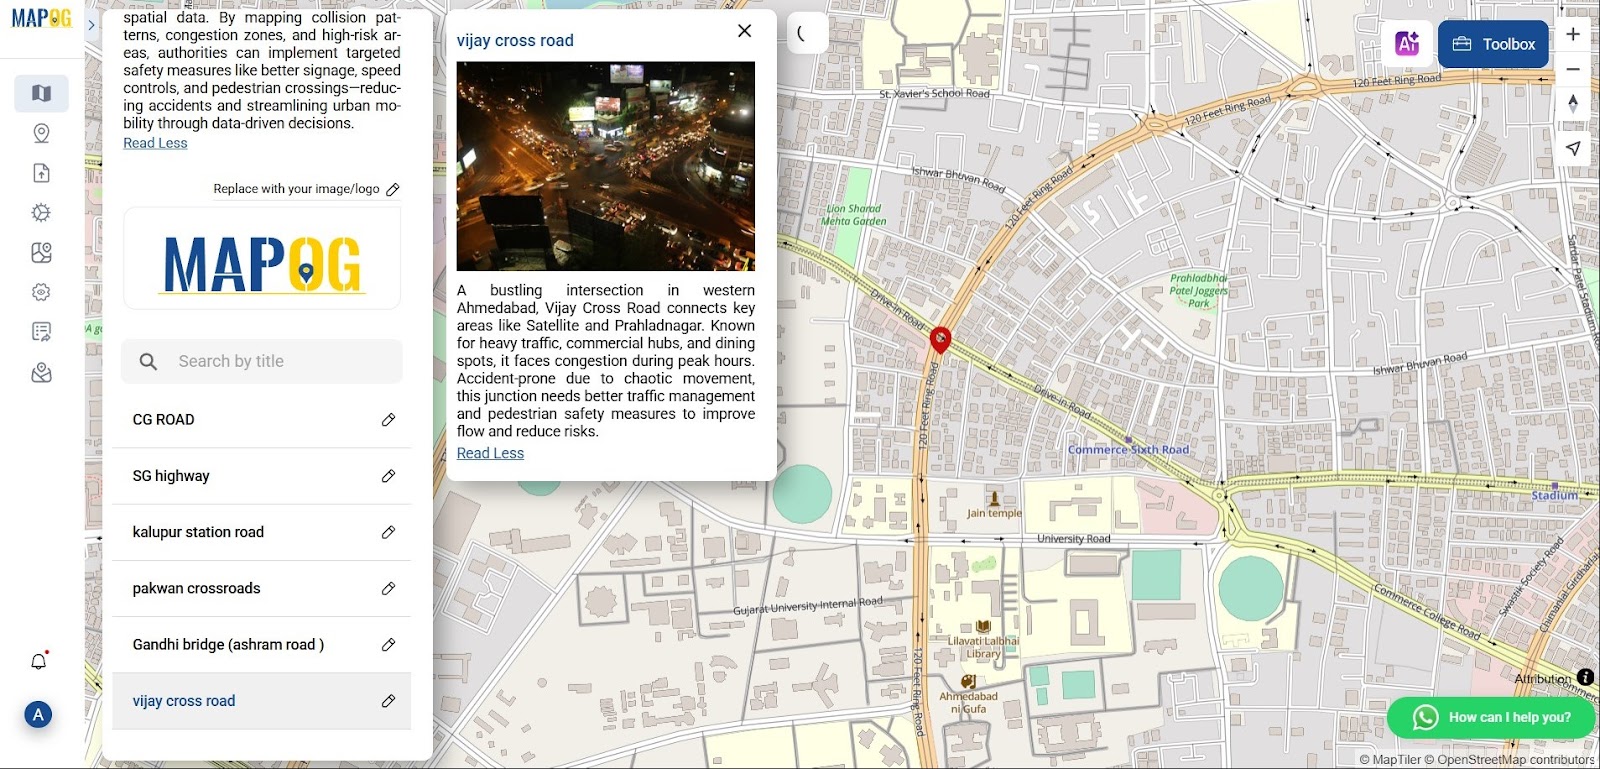
Likewise, you can add a point for that area with a note such as “25% of the city’s accidents occur here due to sharp turns,” offering more context to your viewers.
How GIS Mapping Transforms Traffic Management and Road Safety
GIS maps play a critical role in improving urban traffic systems. In addition, they significantly enhance road safety. By identifying high-risk zones through red buffer overlays, planners can easily spot areas experiencing heavy congestion. Additionally, using KML markers to indicate accident-prone locations allows authorities to visually assess danger zones across the city. GIS for Road Safety and Traffic Flow management with GIS tools like MAPOG helps reduce accidents, improve mobility, and optimize planning. These spatial insights enable data-driven decision-making, allowing city officials to reroute traffic, deploy speed cameras, or redesign dangerous intersections proactively. Moreover, predictive modeling based on historical accident data helps prevent future incidents before they happen. GIS tools also foster greater public awareness by making traffic data accessible. Citizens can plan safer, faster routes using live maps, while municipalities can push alerts about hazardous conditions directly to drivers through navigation apps. Together, these features create a smarter, safer, and more responsive Road Safety and Traffic Flow
Why MAPOG is the Ideal Tool for Traffic Analysis and Road Safety
No Coding Required – User-friendly interface for beginners and experts.
Customizable Layers – Adjust styles, add multimedia, and export maps.
Affordable Plans – Free for basic use; premium features for advanced GIS.
Shareable Maps – Collaborate with teams or publish public safety alerts.
GIS DATA Used–
Conclusion: The Future of Traffic Management with GIS
GIS technology, particularly platforms like MAPOG, is transforming urban mobility by enhancing traffic management and road safety. By mapping high-risk zones, analyzing accident data, and optimizing infrastructure, cities can reduce congestion, prevent accidents, and save lives.
Here are some articles you might be interested in :