Visual storytelling through maps offers a dynamic way to teach history, making abstract timelines and political shifts more tangible. When learners can Create Story Maps for Education, they visualize how historical events unfolded across space, leading to deeper understanding. For example, using a British India interactive map, educators can illustrate how the British Empire expanded—from early trading posts in Surat and Bombay to pivotal battles, treaties, and economic control. With tools like MAPOG, this transformation becomes immersive, layered with visuals, timelines, and historical context. Much like mapping the 7 Wonders or tracing global inventions, story maps make history engaging and memorable.
Key Concept:
Story maps bring clarity to complex historical processes by connecting events to geography. In the case of the British India interactive map, students can visually follow the empire’s progression—from trade-focused settlements to widespread colonial rule. Plotting key locations like Surat, Calcutta, Bombay, and Delhi helps trace both spatial spread and temporal evolution. Similarly, mapping ancient Indian universities or Krishna’s mythological journey shows how geography shapes narratives. This approach transforms traditional history lessons into interactive, place-based learning experiences.
Educational Importance and Uses of Mapping
Geographic Information Systems (GIS) transform history education by making learning interactive and spatially engaging. Instead of relying solely on textbooks, students can explore events like the British expansion in India through British colonization of India interactive maps that reveal patterns and regional dynamics. GIS fosters critical thinking, spatial literacy, and inquiry-based learning, while also supporting personalized, project-based approaches that blend research with storytelling—making history more analytical, engaging, and relevant.
How to Create a British Colonization of India Interactive Map: Step-by-Step Guide
To begin with, follow these steps to create a map for “Create Story Maps for Education: A Visual Way to Teach History, Geography, and More” using MAPOG.
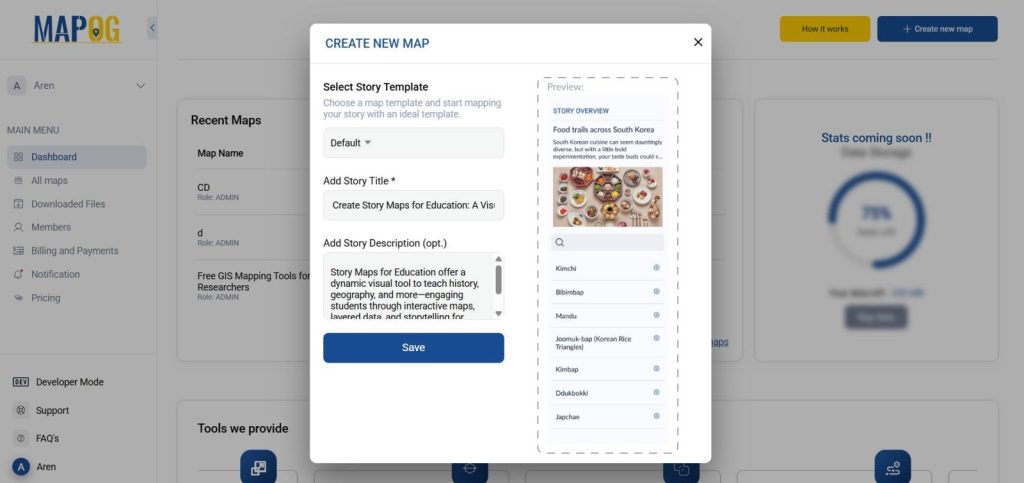
1. Add Title and Description
- Title: Create Story Maps for Education: A Visual Way to Teach History, Geography, and More
- Description: Discover how story maps enhance education by seamlessly turning history and geography lessons into interactive, visual experiences. Moreover, they engage students with dynamic maps, timelines, and spatial narratives for deeper learning.
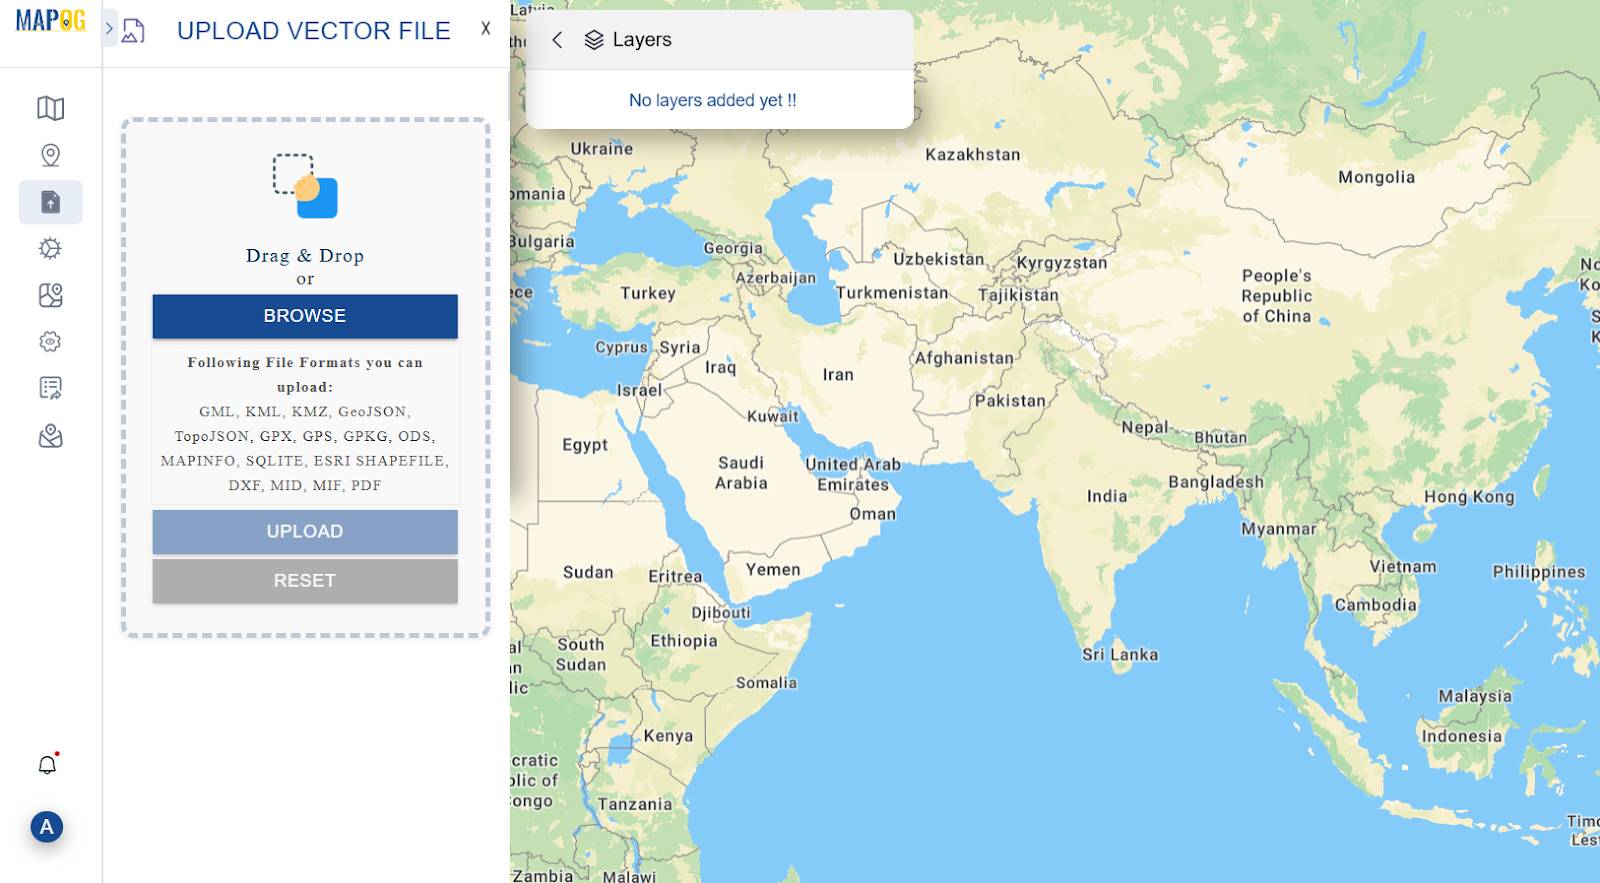
2. Uploading GeoJSON Data for the British Colonization of India Interactive Map
- First, upload historical location data related to key events and settlements.
- Then, use the Upload Vector File function to import your GeoJSON file into the map.
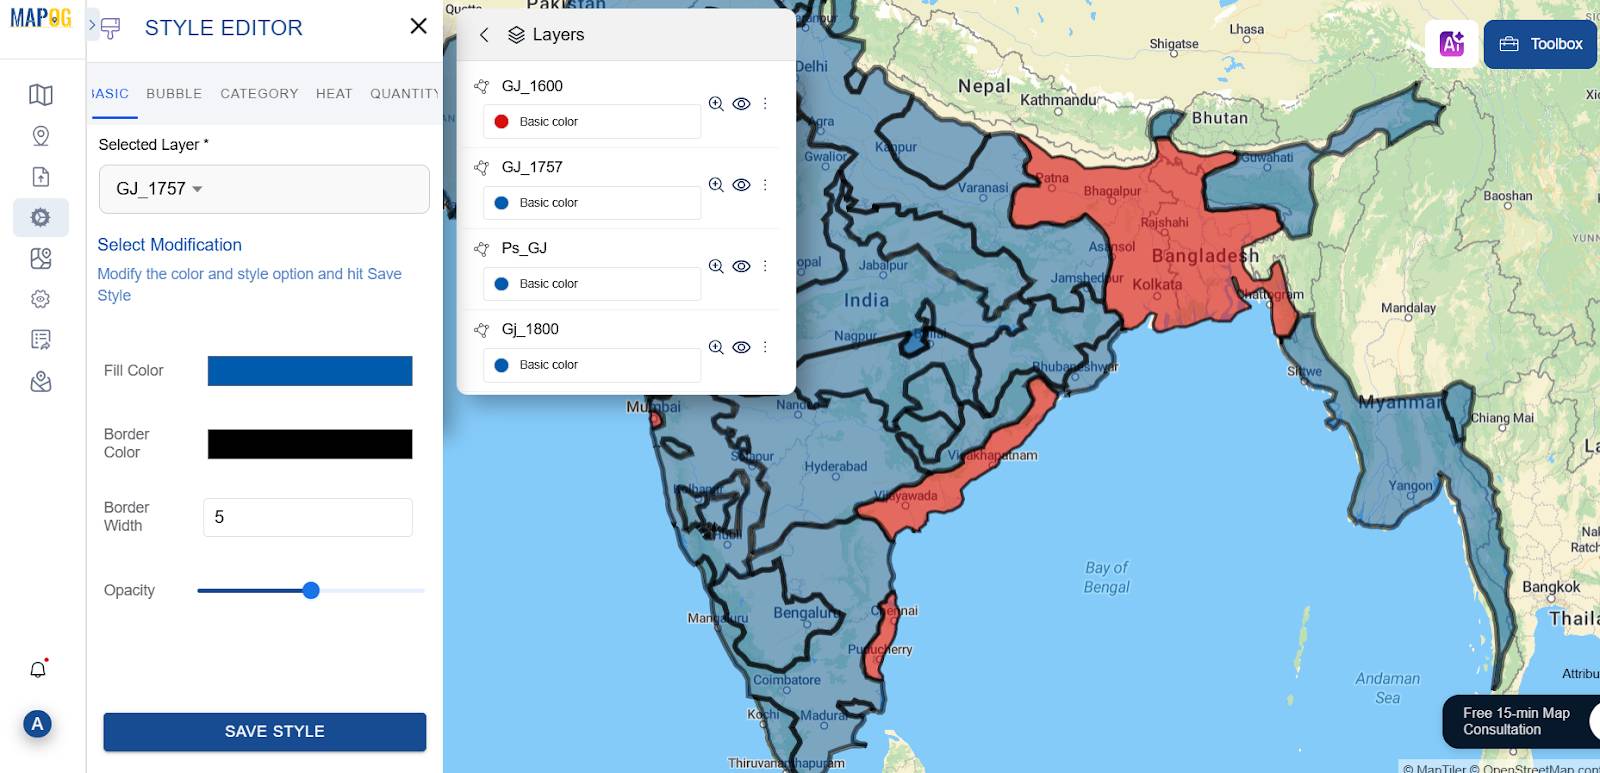
3. Style Layers
- First, use the Style Layer option to customize the appearance of locations.
- Then, apply different symbols or colors to clearly represent ports, battles, capitals, and annexations, making the map more informative and visually engaging.
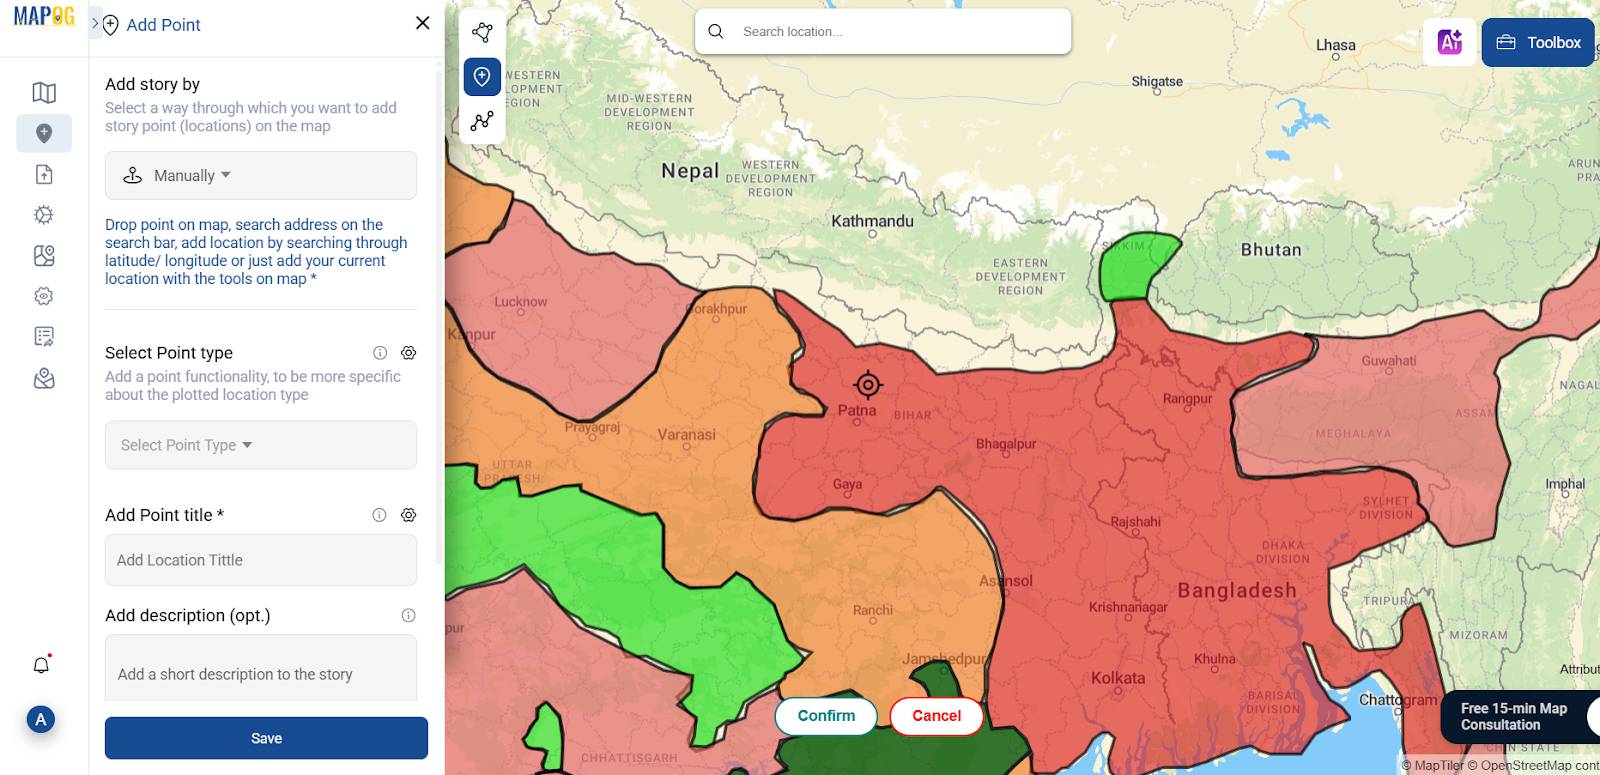
4. Add Points Using ‘Add Story’
- First, go to Add Story.
- Then, use the search by Latitude & Longitude in the Toolbox to accurately add each point.
- For each point-
- start by adding a Title (e.g., Surat Port, 1612).
- Next, include a brief Description summarizing the event.
- Finally, upload an image or historical photo if available to enhance the storytelling experience.
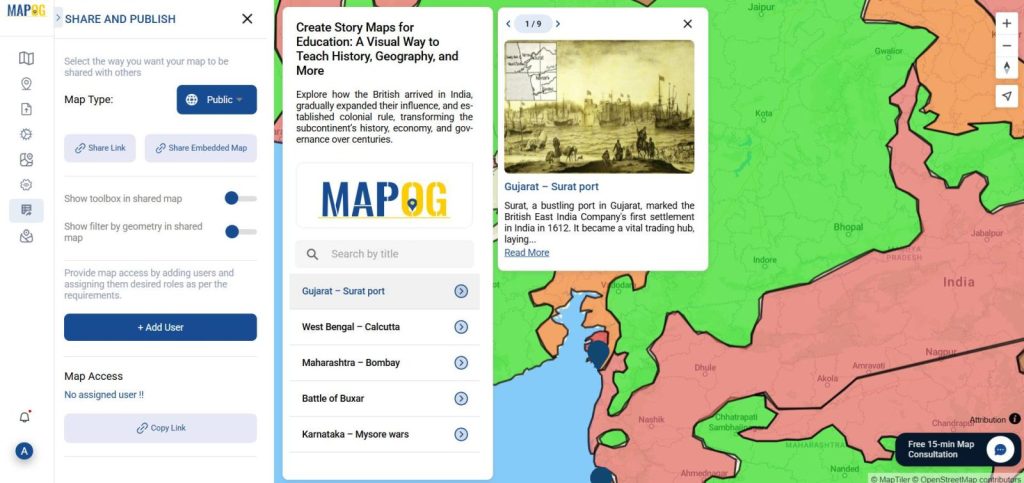
5. Presenting and Sharing the British Colonization of India Interactive Map
- Once the map is complete, go ahead and click on Publish & Share.
- After that, generate a public URL or embed code to include it in :
- Classroom presentations
- Student blogs or portfolios
- Educational websites
Industry and Domain
Overall, this mapping project lies at the intersection of education, digital humanities, and GIS (Geographic Information Systems). Therefore, it’s ideal for:
- History teachers and students
- Museums and cultural centers
- Edtech and interactive learning platforms
Conclusion: Insights from the British Colonization of India Interactive Map
Mapping the British journey through India reveals how geography, politics, and power intersected during colonial expansion.It shows where and why key events occurred, highlighting strategic, trade, and political regions. Moreover, tools like MAPOG make learning engaging, support curriculum goals, and promote critical thinking. Ultimately, mapping becomes more than a visual aid—it becomes a dynamic educational resource that brings history to life.