Transform Post Office Site Selection with GIS Analysis for Enhanced Accessibility
Find out how MAPOG is improving mail experiences in Cambodia with its innovative post office site selection strategy.
Find out how MAPOG is improving mail experiences in Cambodia with its innovative post office site selection strategy.
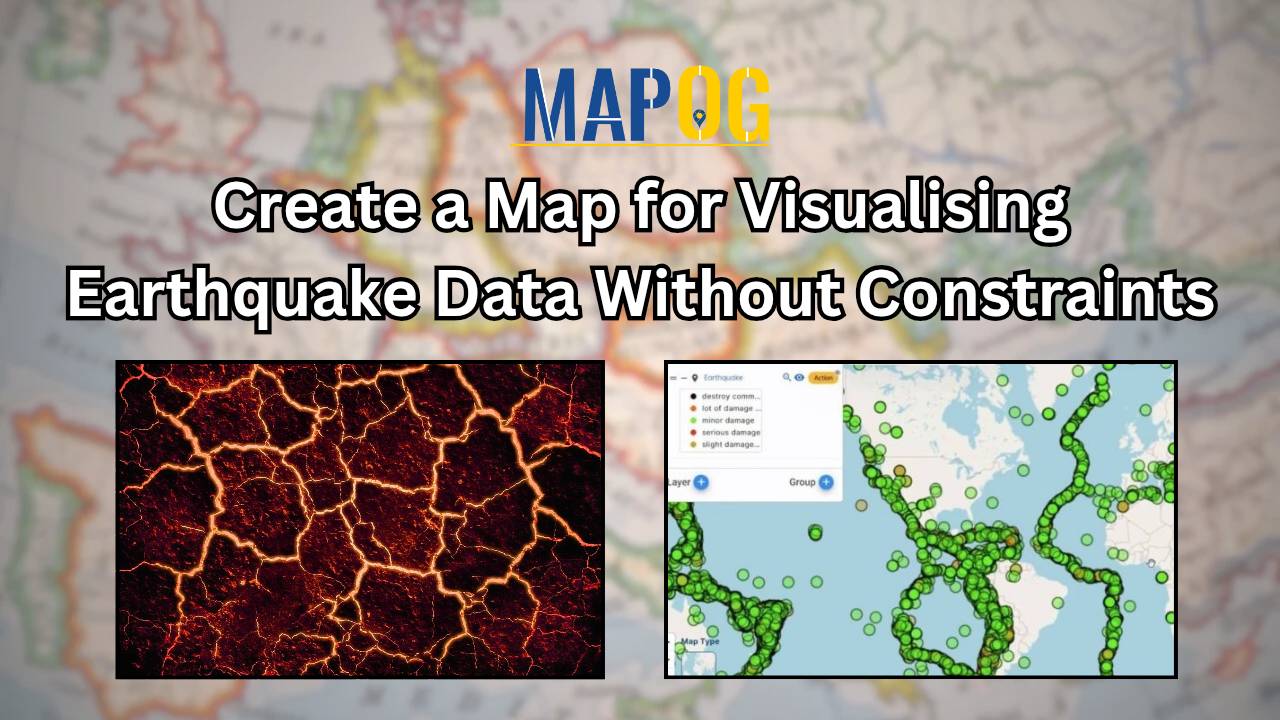
In the dynamic realm of disaster response, precision and adaptability are crucial. The MAPOG Map Analysis tool emerges as a groundbreaking solution that transcends traditional limitations in mapping seismic events. This comprehensive guide spotlights MAPOG’s unique feature: the ability to create a map for visualizing Earthquake Data without constraints. Unlike conventional tools, MAPOG empowers users … Read more
Carbon Stock Mapping – Incorporate bubble style for visualize the data – Add labels showing the values of carbon stock
GIS analysis reveals where pharmacies should be located near hospitals, ensuring timely access to medicine and enhancing public health outcomes.
Map forest types with category style for comprehensive analysis. Visualize diverse ecosystems and land cover for informed environmental management.
Understanding and analyzing sports activities in various areas is crucial for making informed decisions about community health, engagement, and infrastructure investments. Mapping Sports Activity: Using Levels for Analysis, By using the level feature and category style in GIS, we can visualize and categorize sports activities on a map effectively. Key Concept of Create Sports Maps … Read more
Plot ammunition depot point – Create multiple buffer zones based on risk level – Strategically plot fire station to prevent accident
Explore interactive poverty rate heat maps to visualize and analyze socioeconomic disparities. Gain insights for targeted policy-making and community support.
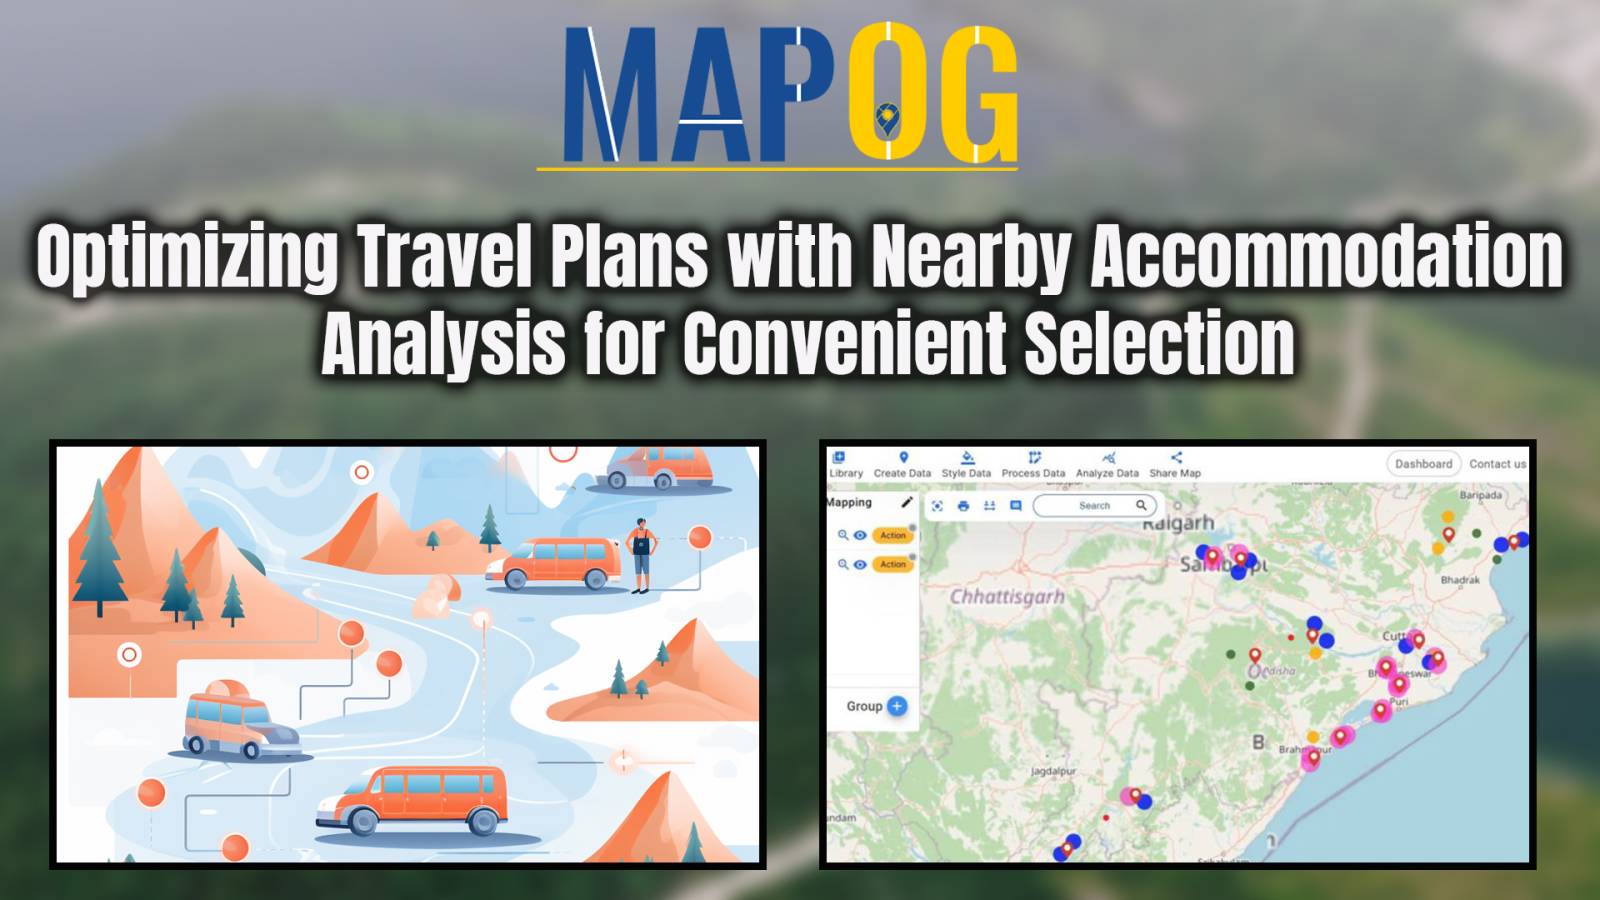
Enhancing Tourist Accessibility -Use Near By Neighbor Analysis bubble style with different colors for different distances
In the realm of Geographic Information Systems, the ability to visualise spatial data is crucial for understanding patterns, making informed decisions, and communicating information effectively. One fundamental aspect of data visualisation is the representation of specific locations or features on a map using points. Customising these points with distinct icons adds clarity, context, and visual … Read more