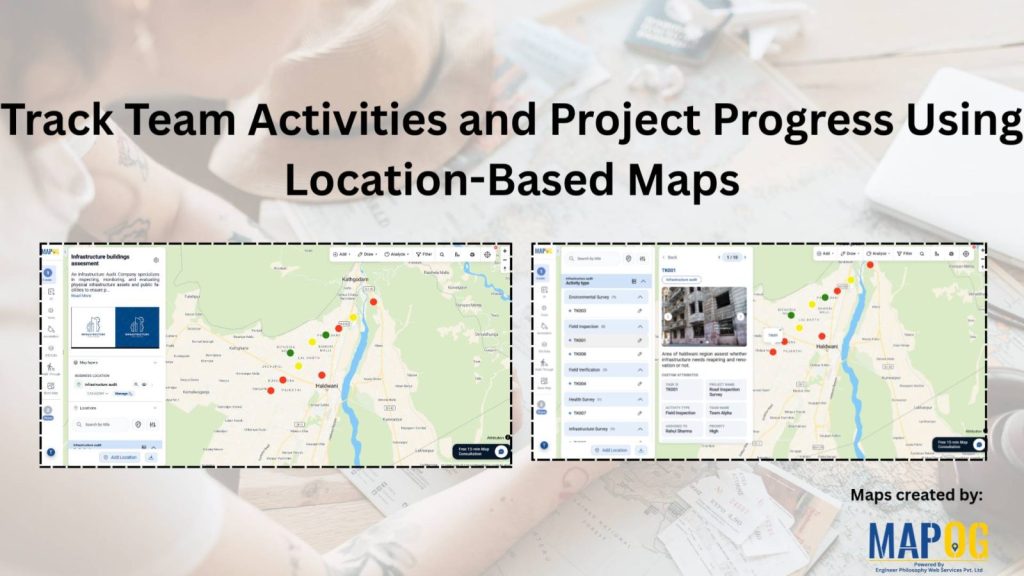
In the infrastructure audit industry, track team activities managing field teams and monitoring project progress becomes difficult when inspection updates are scattered across calls, spreadsheets, WhatsApp chats, and manual reports. As audit projects expand across multiple sites and locations, organizations often face delays, limited visibility into field activities, and poor coordination between teams. Therefore, a centralized location-based tracking system helps monitor tasks, teams, inspection updates, and work progress in real time.
With MAPOG, organizations can combine live location data, task assignments, and field updates on a single interactive map. As a result, managers can monitor activities efficiently, identify delays quickly, and improve coordination between field teams and supervisors.
Key Concept for track team activities
A location-based project track team activites map displays all project sites and assigned activities on a single interface using geographic coordinates. Additionally, it shows task status, assigned members, progress updates, and site-specific details through interactive map points. With filters, task updates, and grouped locations, organizations can easily monitor ongoing work and improve operational efficiency you can use for managing audits of infrastructure buildings to manage team progress and site efficiency.
Step-by-Step Process
Step 1: Create Location Type
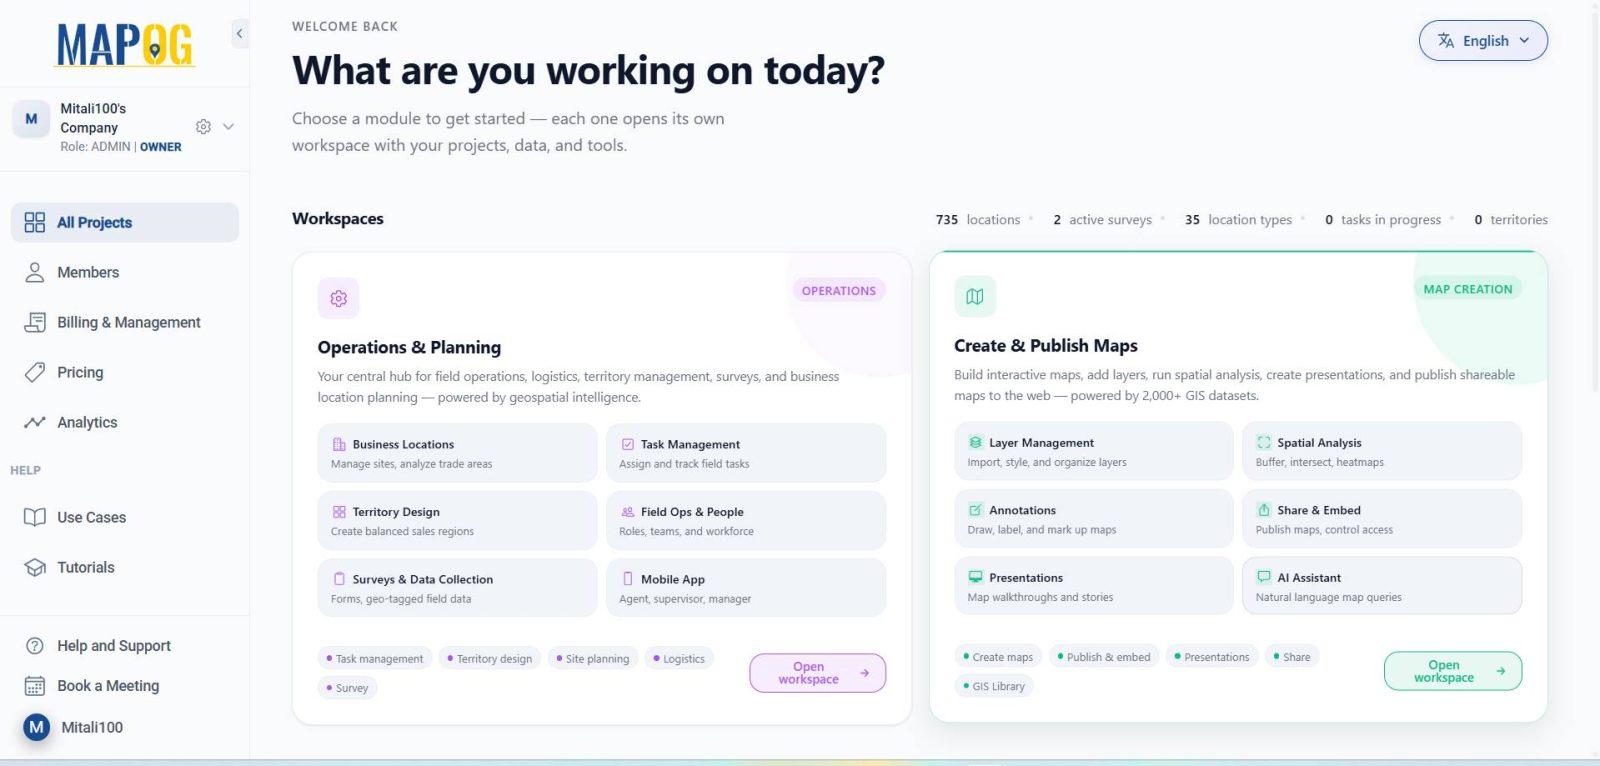
Go to MAPOG and open the Operations & Planning section.
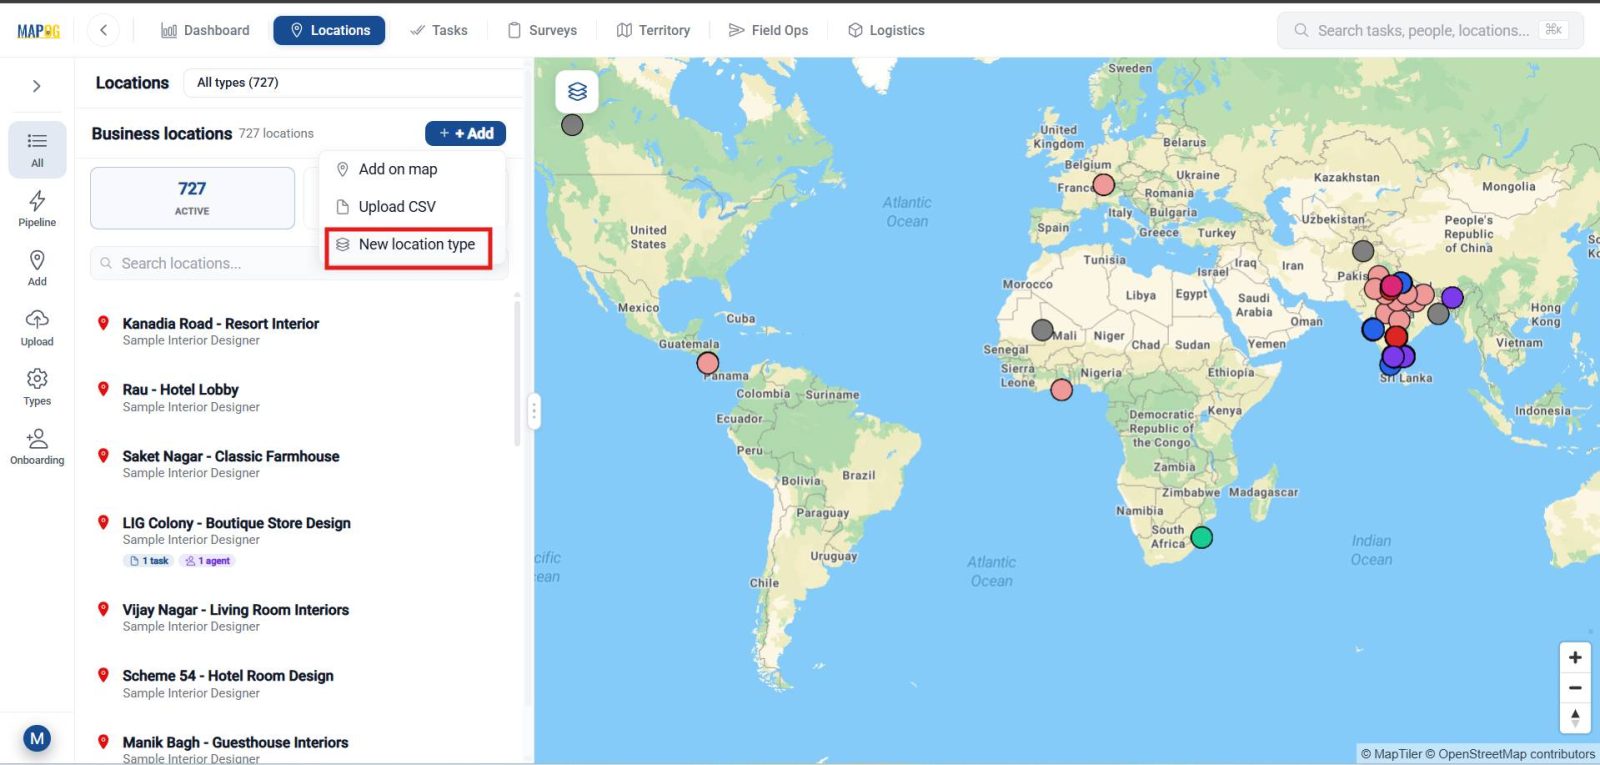
Then, navigate to Locations and click New Location Type to create attributes in a custom location template.
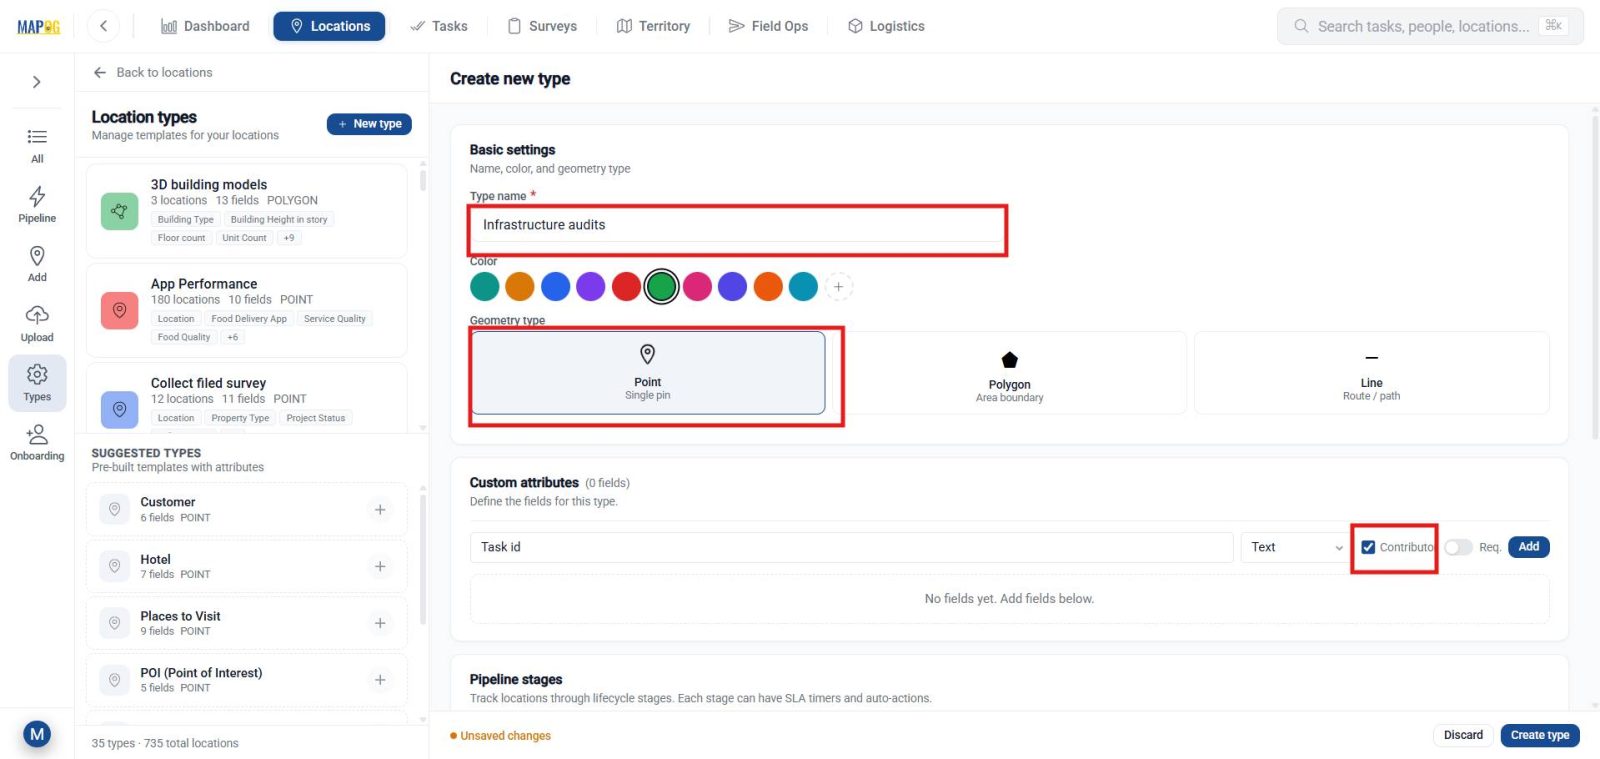
Further, create a custom location template for project sites. Add details such as title, color, and geometry type as point. After that, include attributes like project name, activity type, assigned team, and supervisor using text, select, or multi-select fields. Enable contributors so field users can access locations through the Contributor App.
Step 2: Add Locations
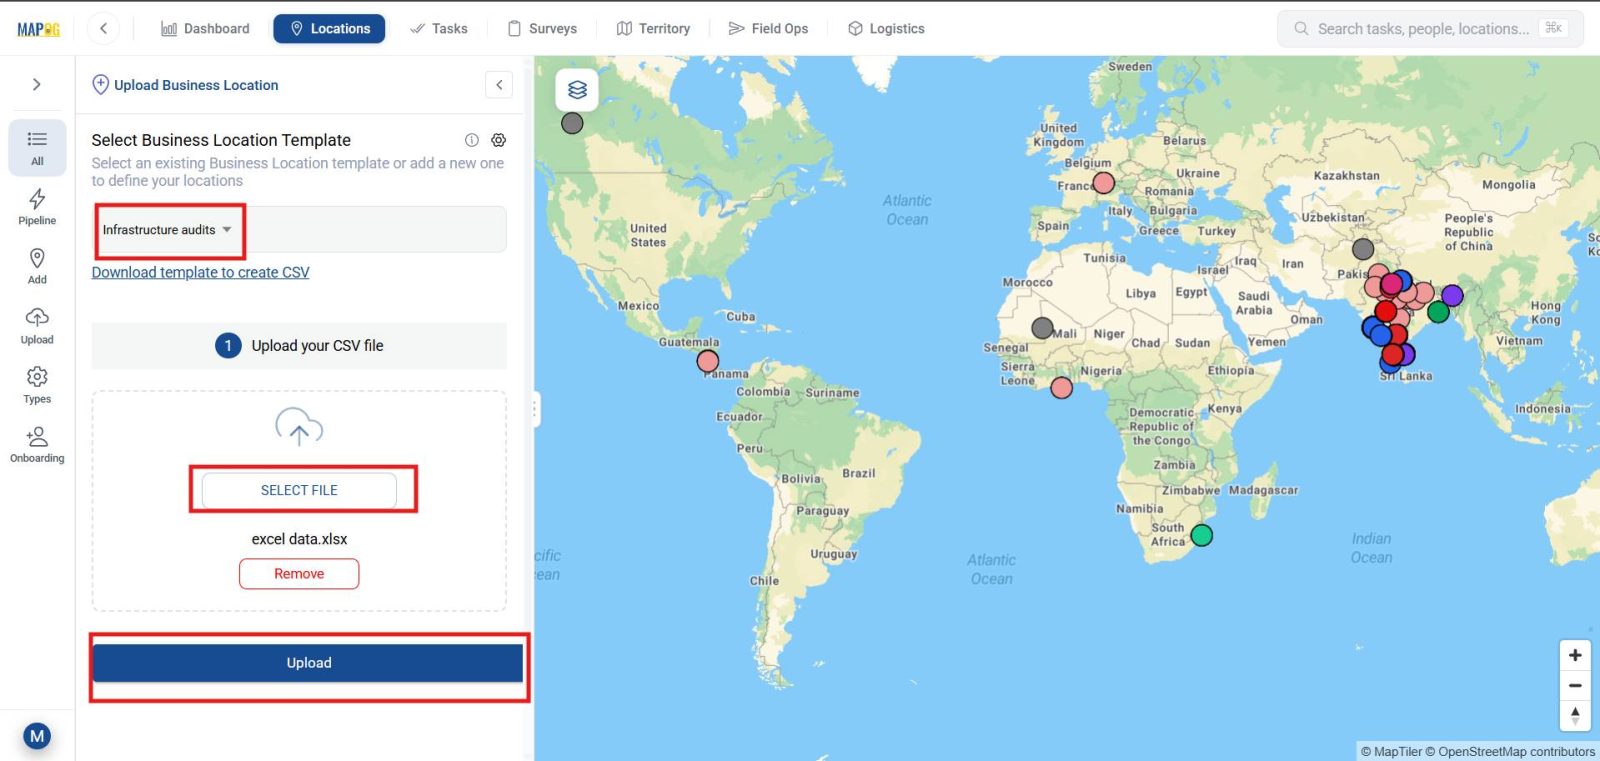
Next, click Upload to upload all project locations from an Excel spreadsheet. Here, select your custom location template, browse the Excel file, and upload it.
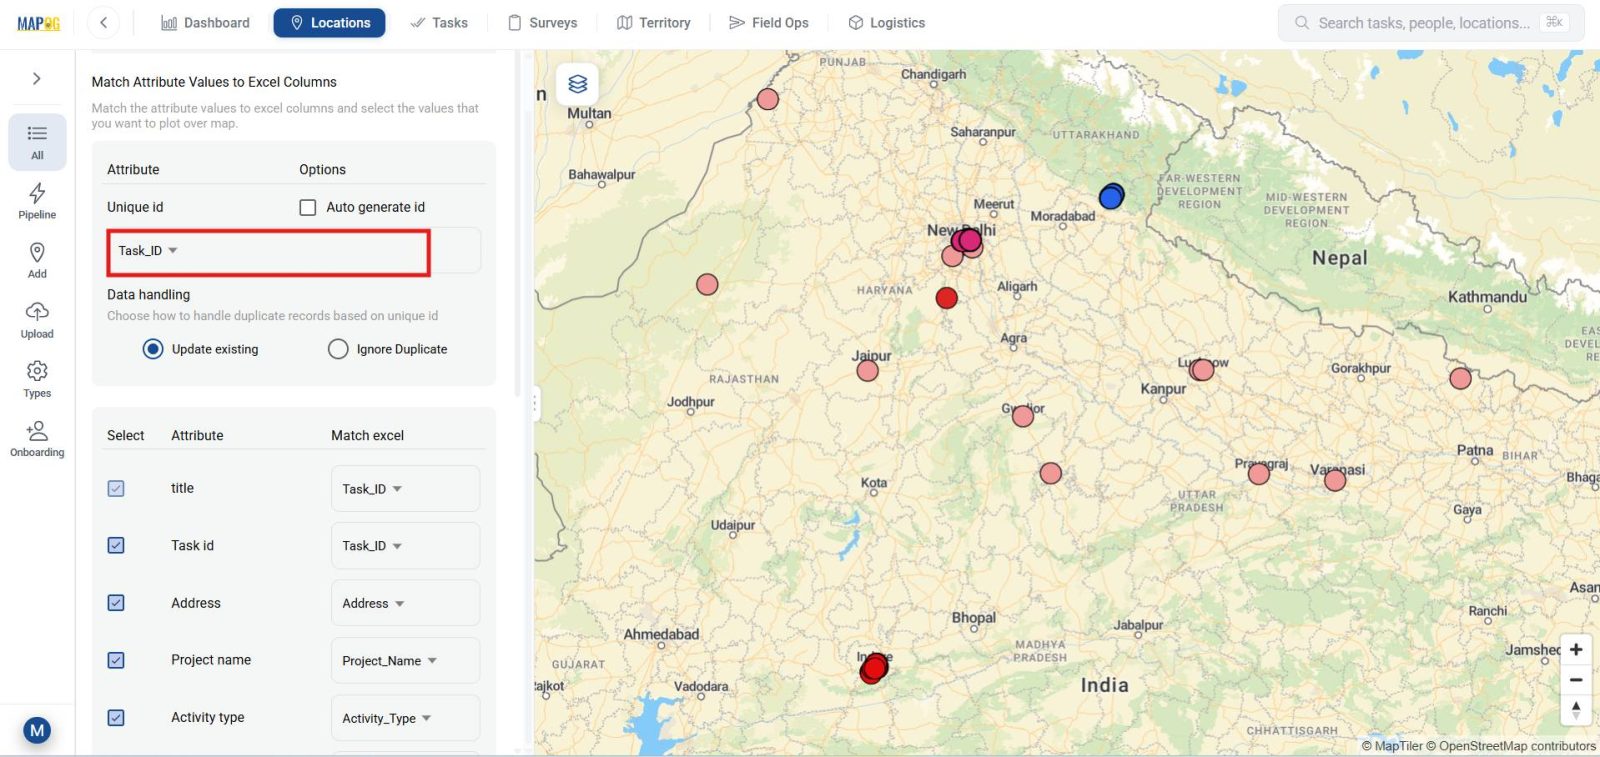
Then define location fields and assign an auto-generated unique ID for each project site. Afterwards, map all attributes with corresponding Excel columns.
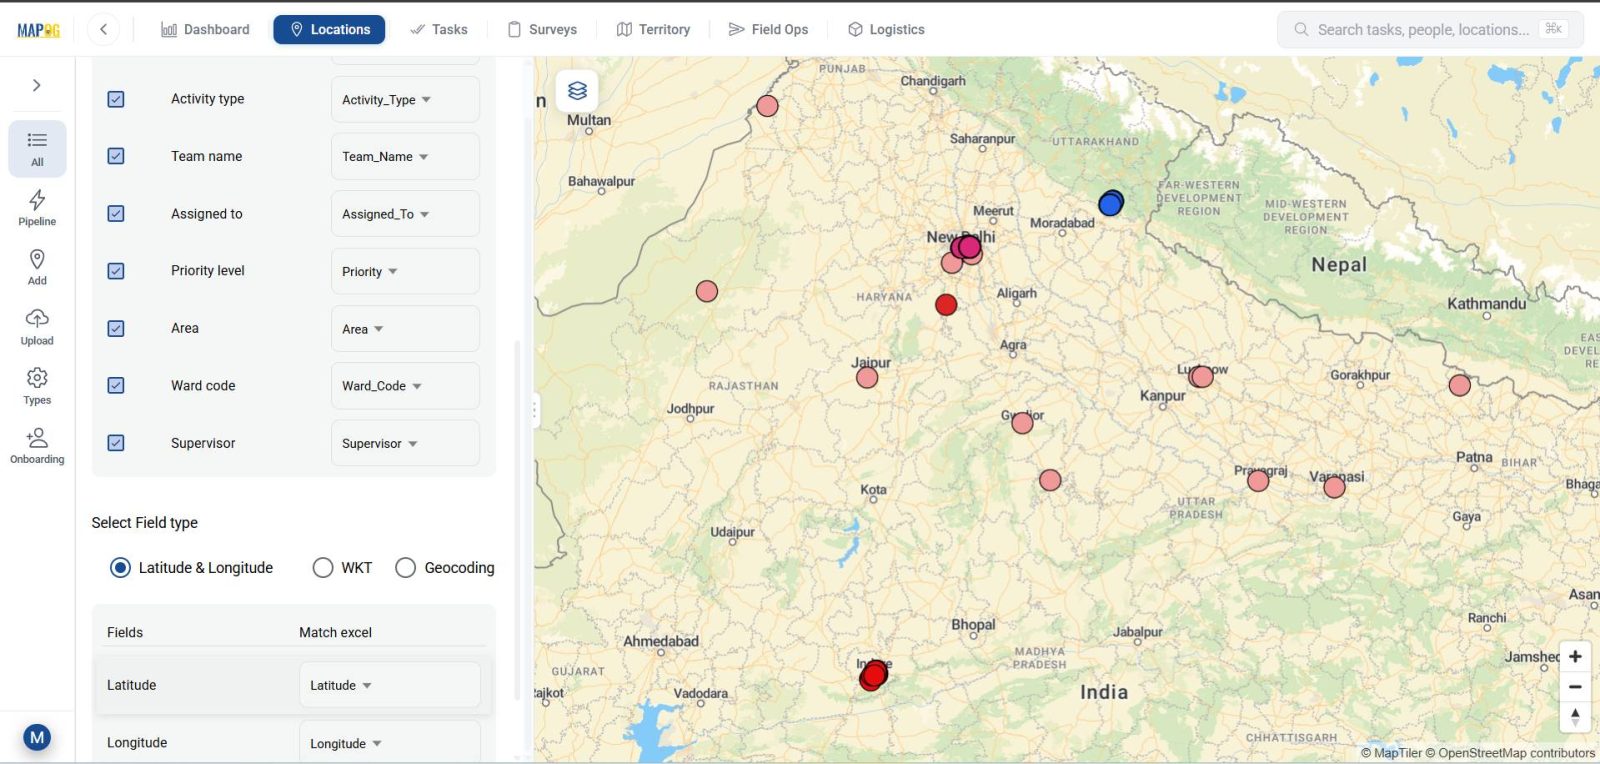
Finally, match the Latitude and Longitude fields correctly and submit. Consequently, all project sites will automatically appear on the map.
Step 3: Edit Project Location Details
Now, search and open your uploaded project locations.
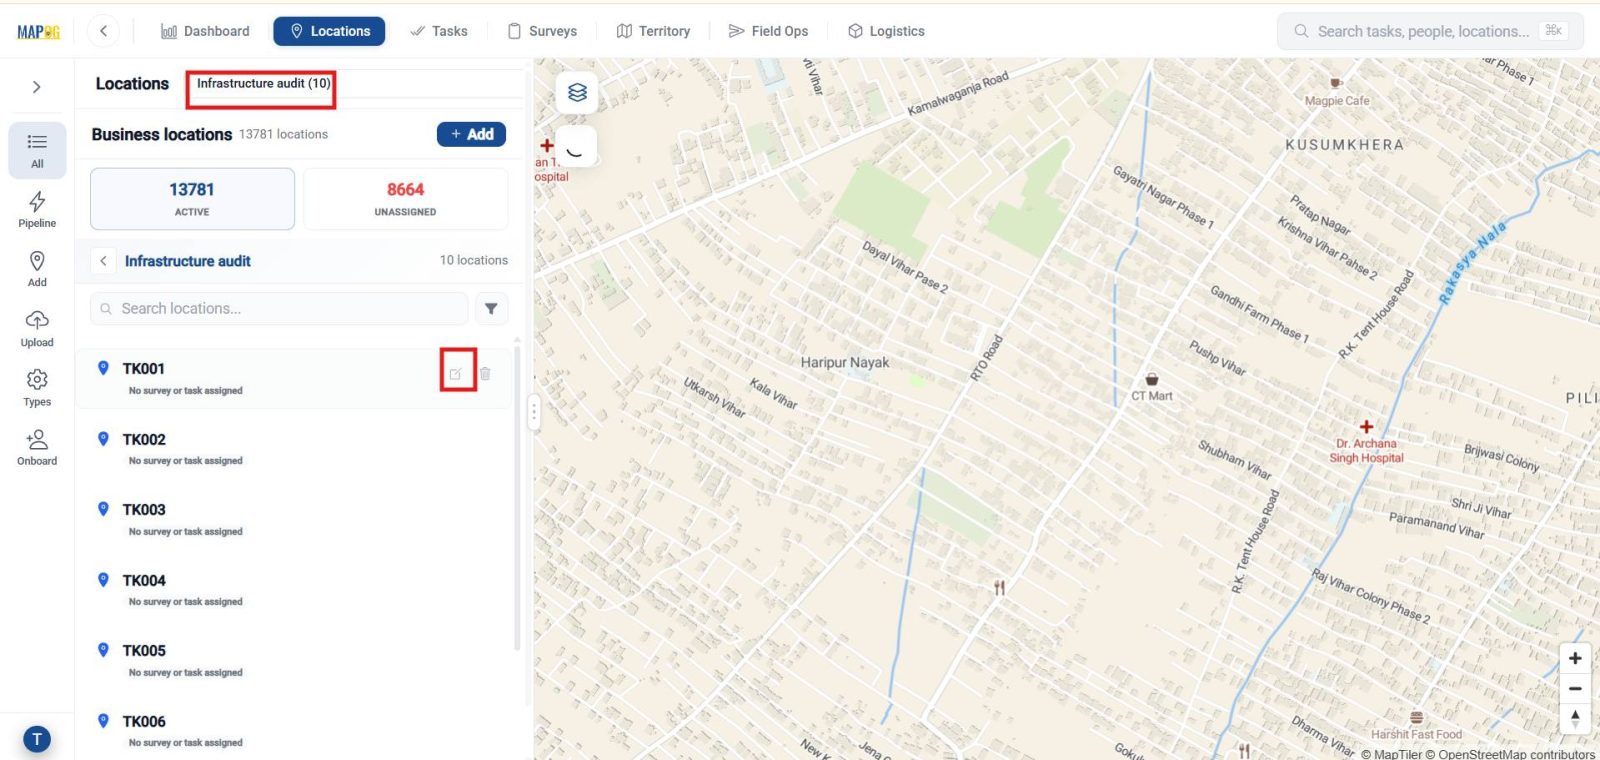
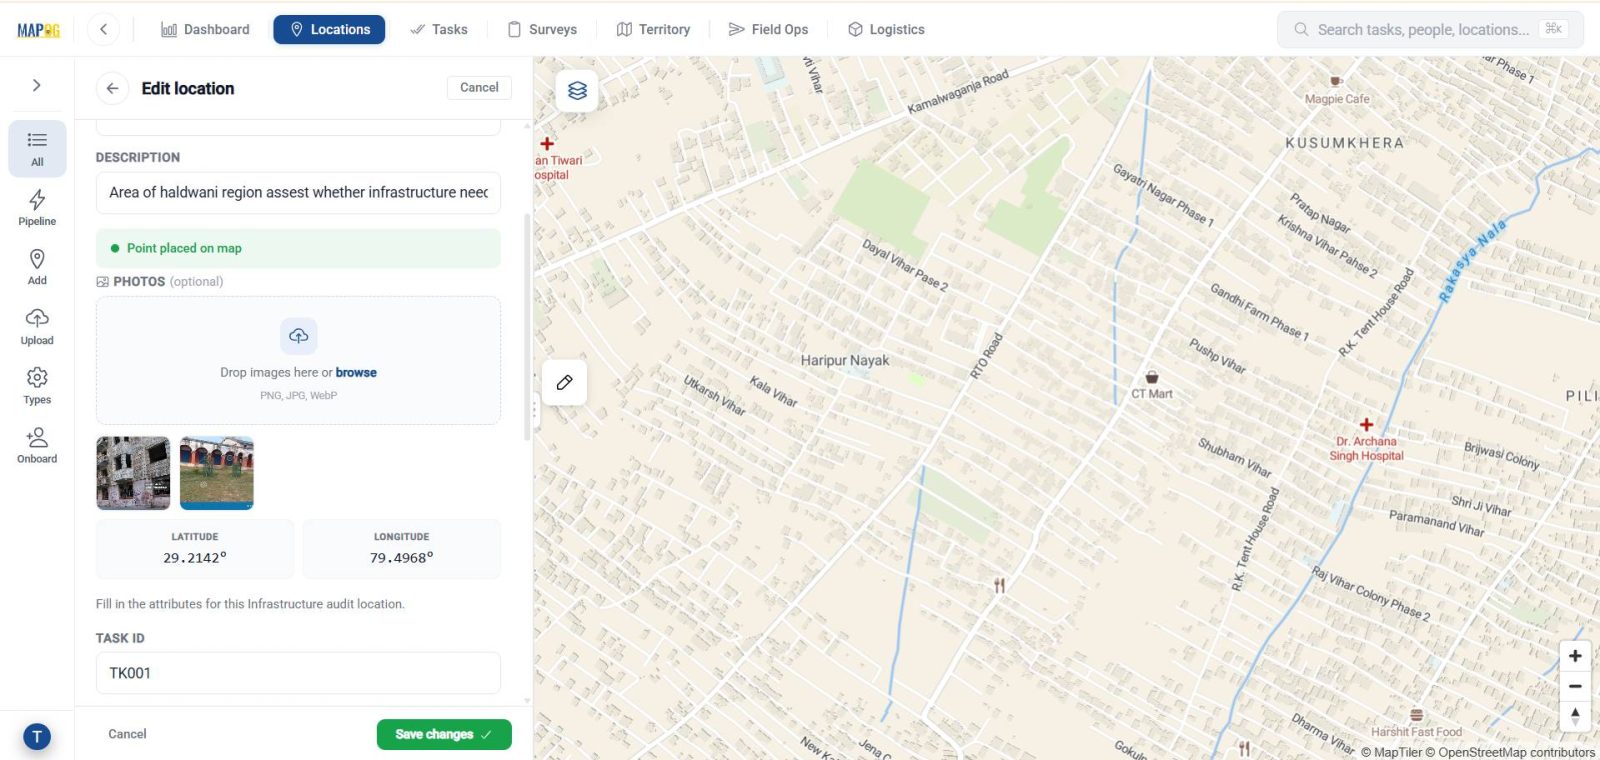
Then click Edit to add site photos, descriptions, or additional details. Then save changes. This helps maintain updated project information for every location.
Step 4: Create Completion Form
Under Tasks, open Task Type Setup and locate your location template using filter option.
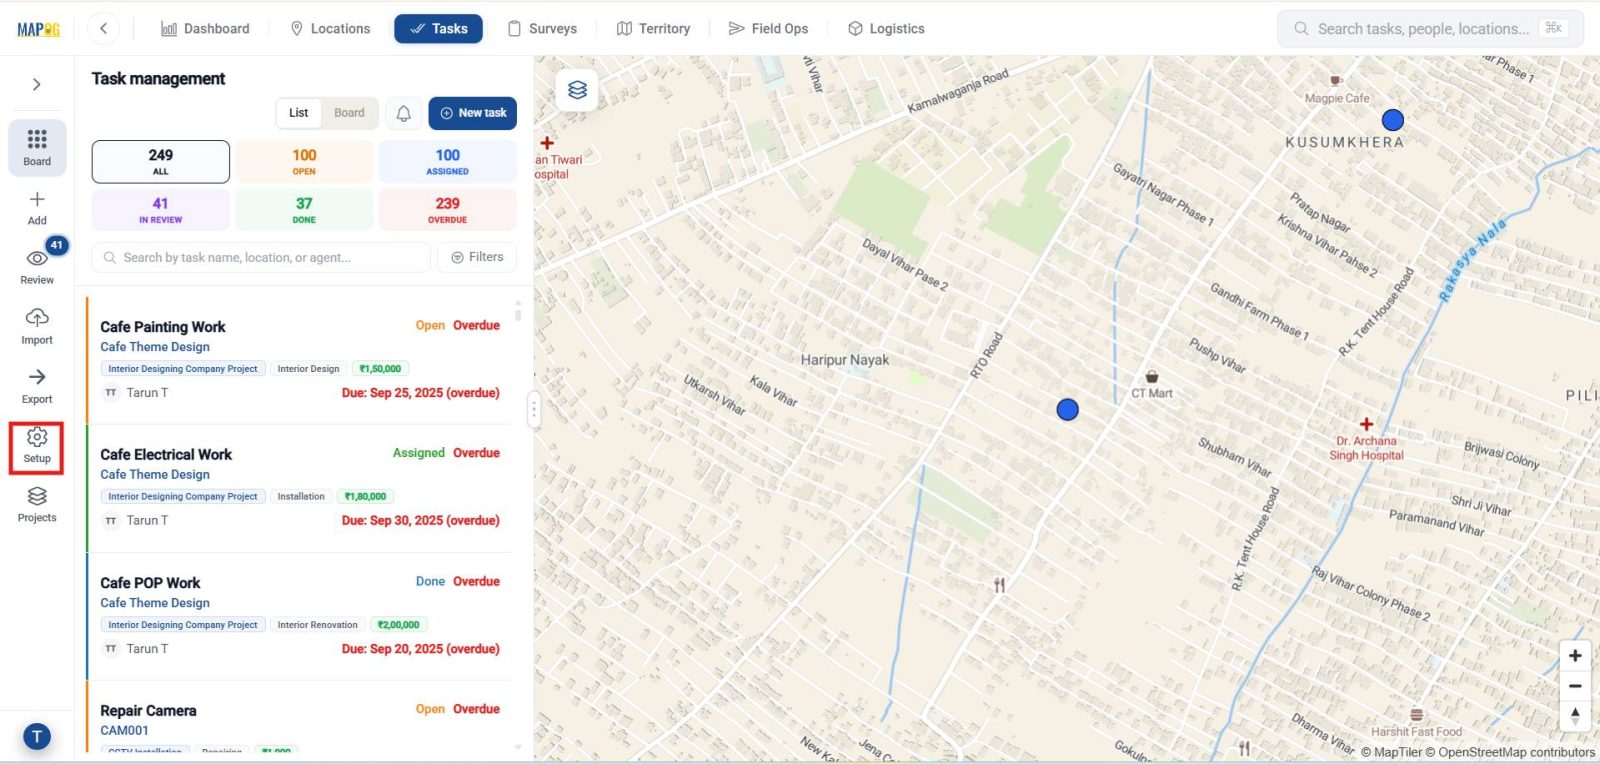
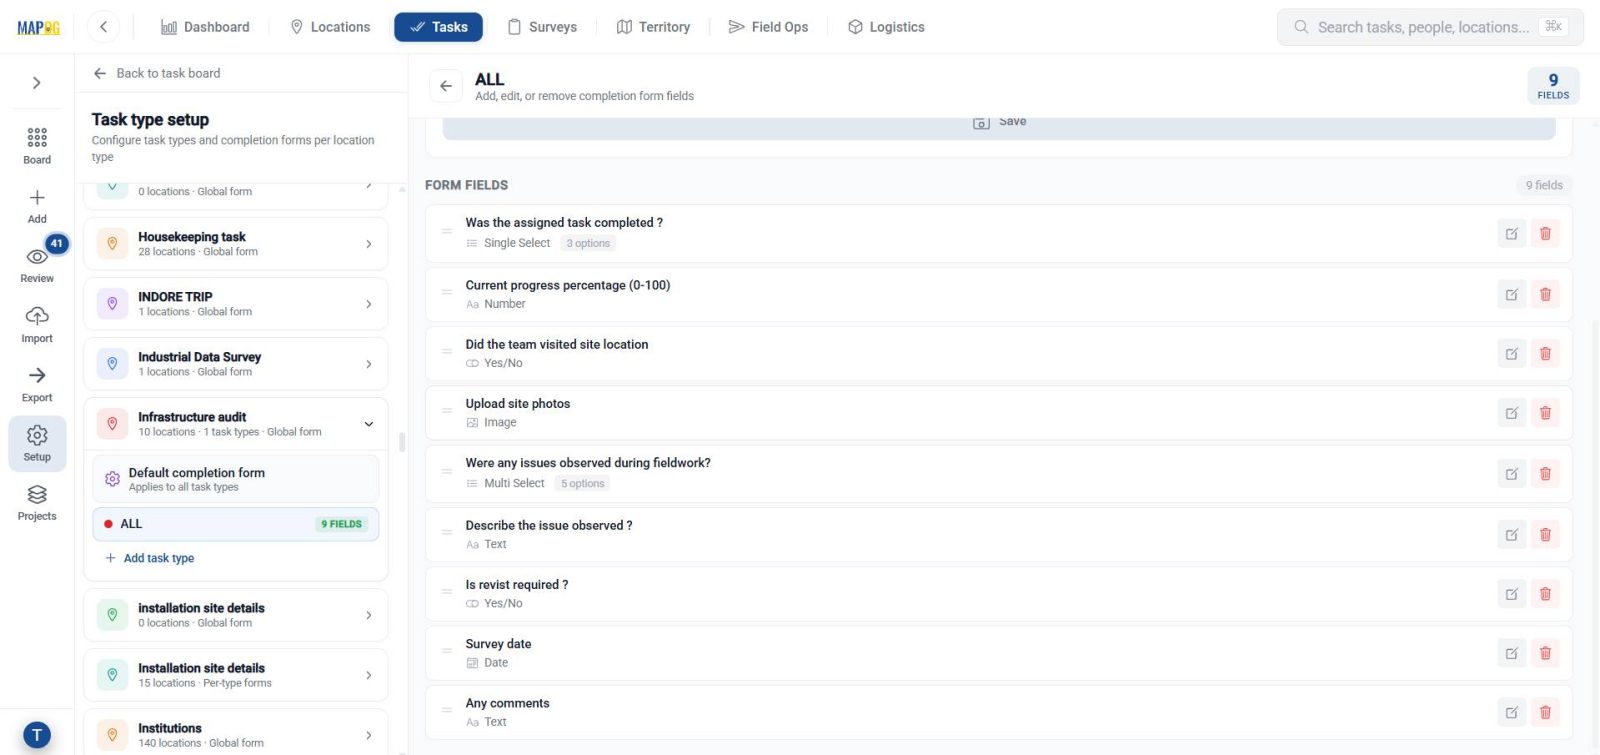
Afterwards, create task types for monitoring project activities by clicking on +add task type. Then build completion forms under each task type containing questions with text, select, multi-select, image, and number fields. These forms help supervisors verify field progress and work completion efficiently.
Step 5: Add Task
Now, open your project location and click Add Task.
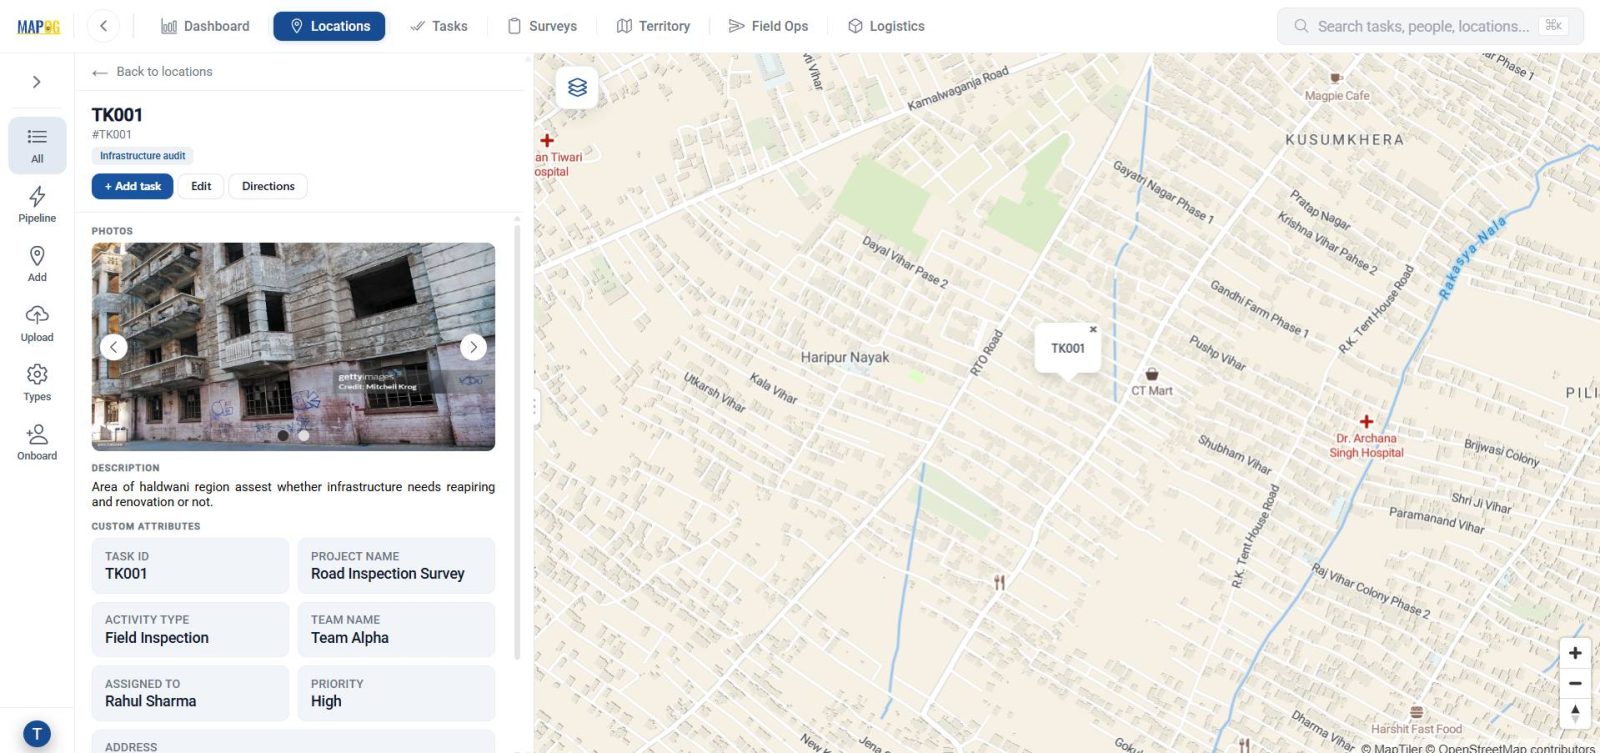
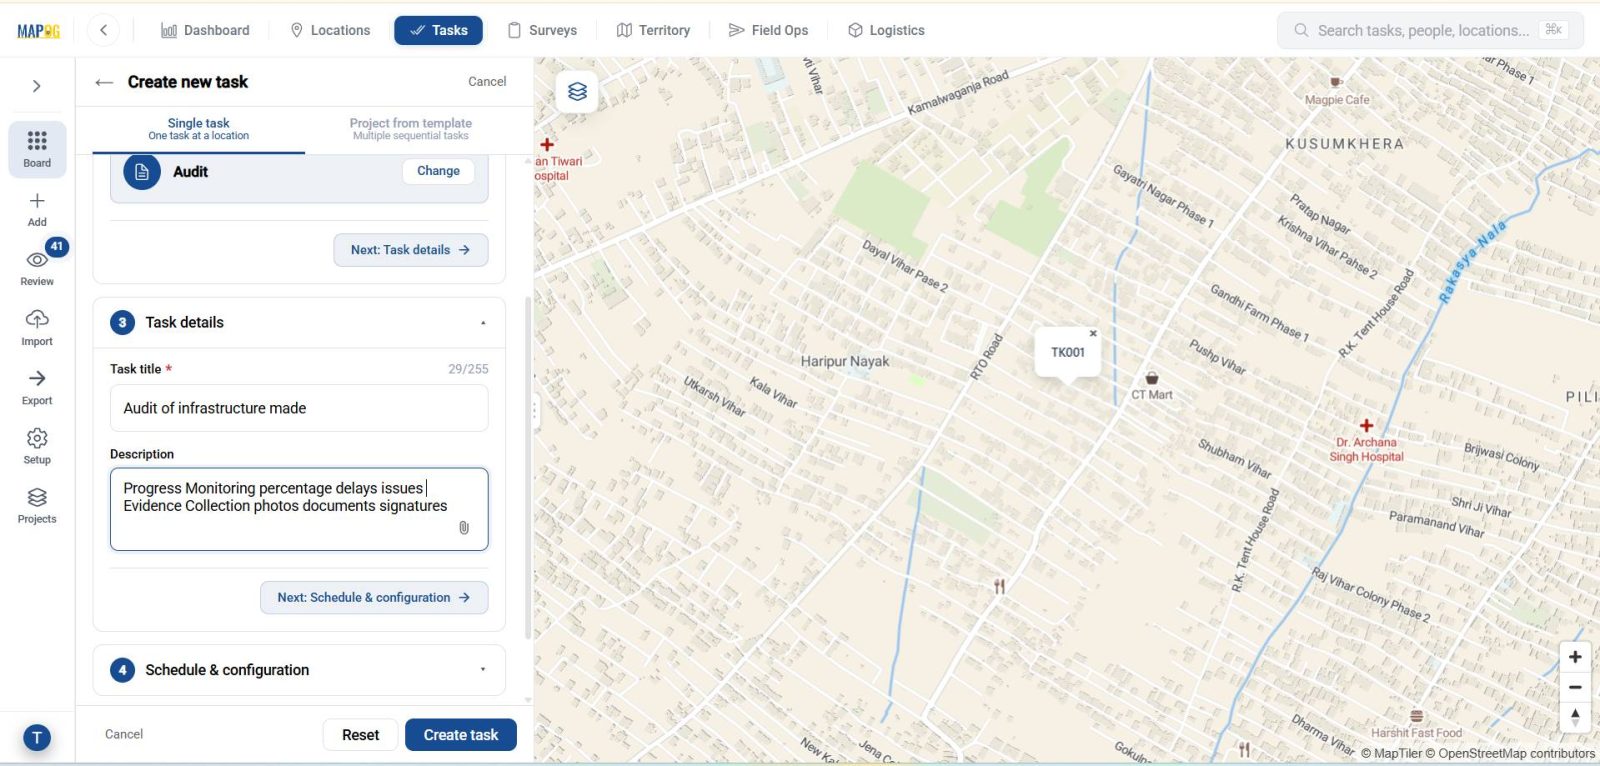
Further, select task type and add details such as task title, description, due date, priority, and status. Then assign team members responsible for the activity.
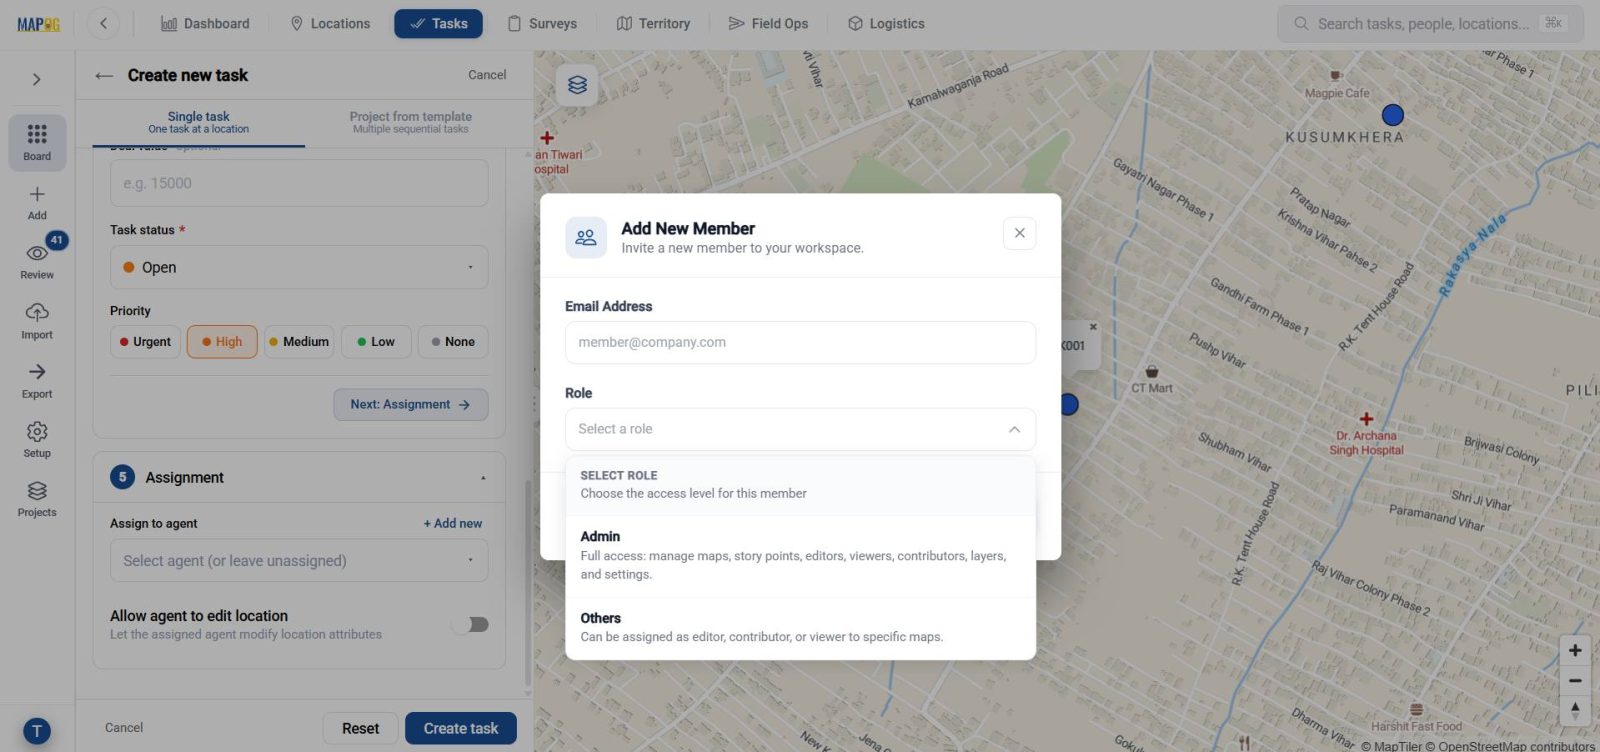
To invite new users, click Add New, enter email address and role, and send invitation.
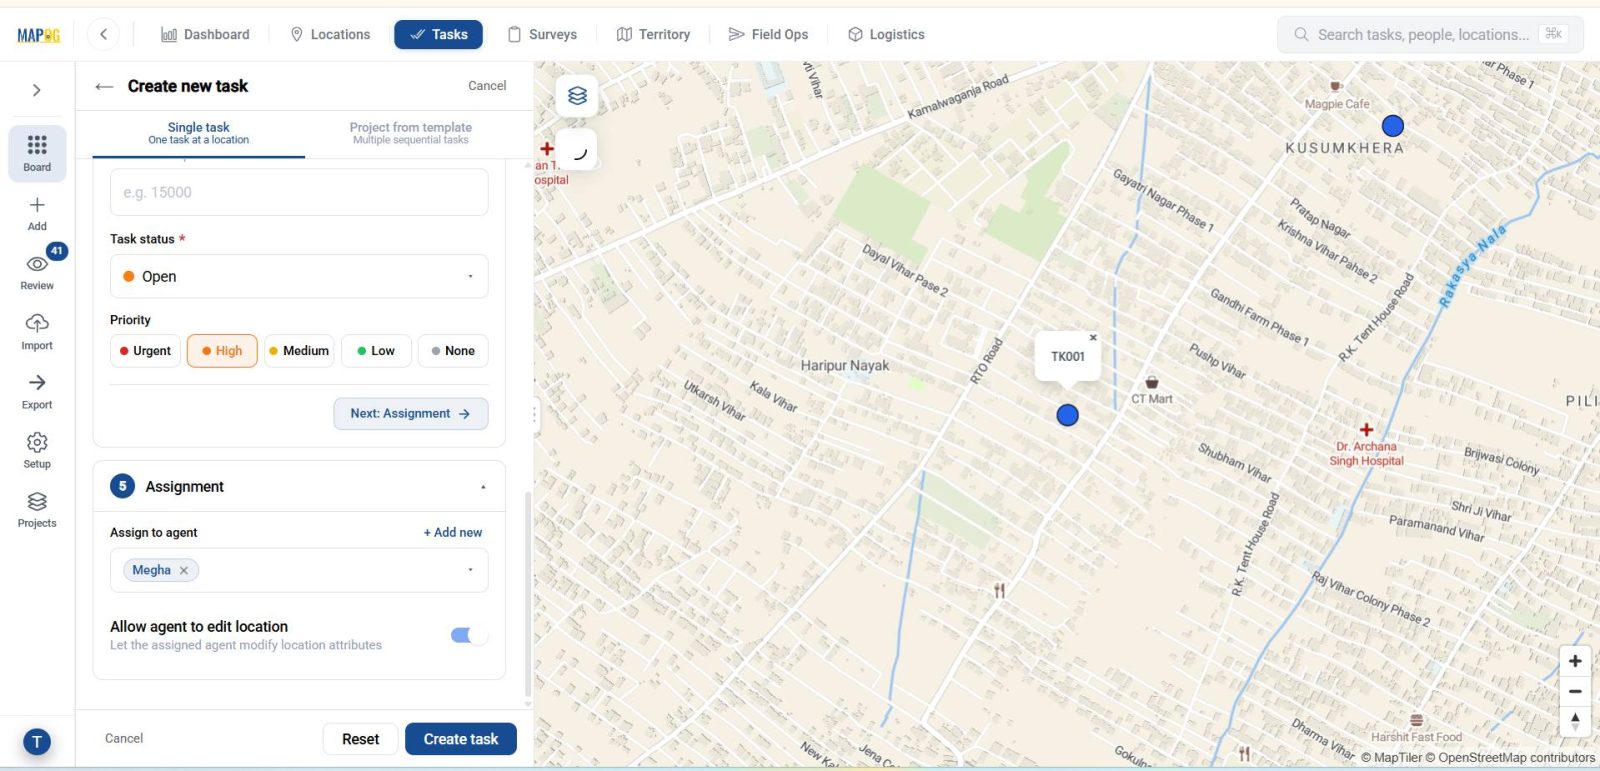
Finally, select the member from the dropdown and create the task.
Step 6: User Interface
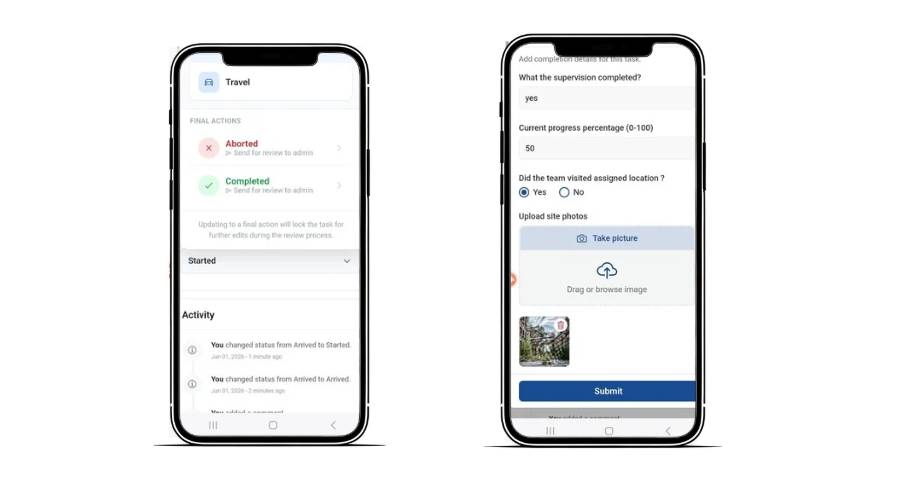
The assigned users can see tasks in the MAPOG Contributor app. They can view and filter them. Afterwards, they can update the status of work as started or on-hold, and add comments.
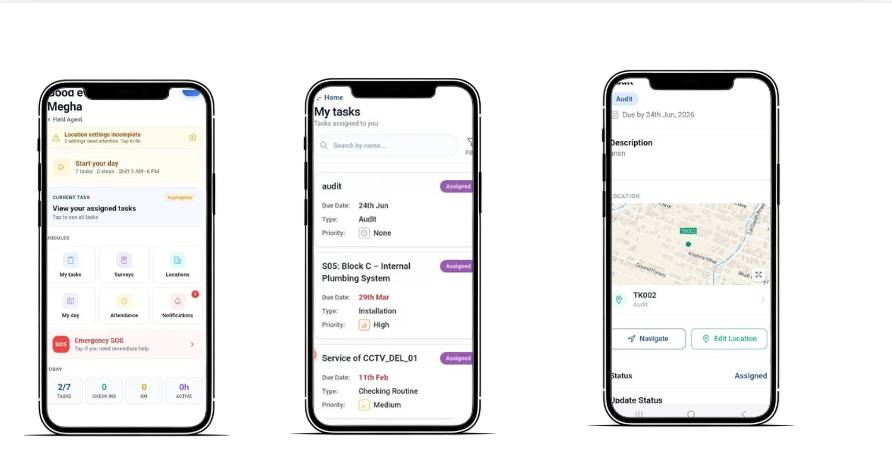
Once work is completed, users can submit the completion form along with photos for review.
Step 7: Task Management
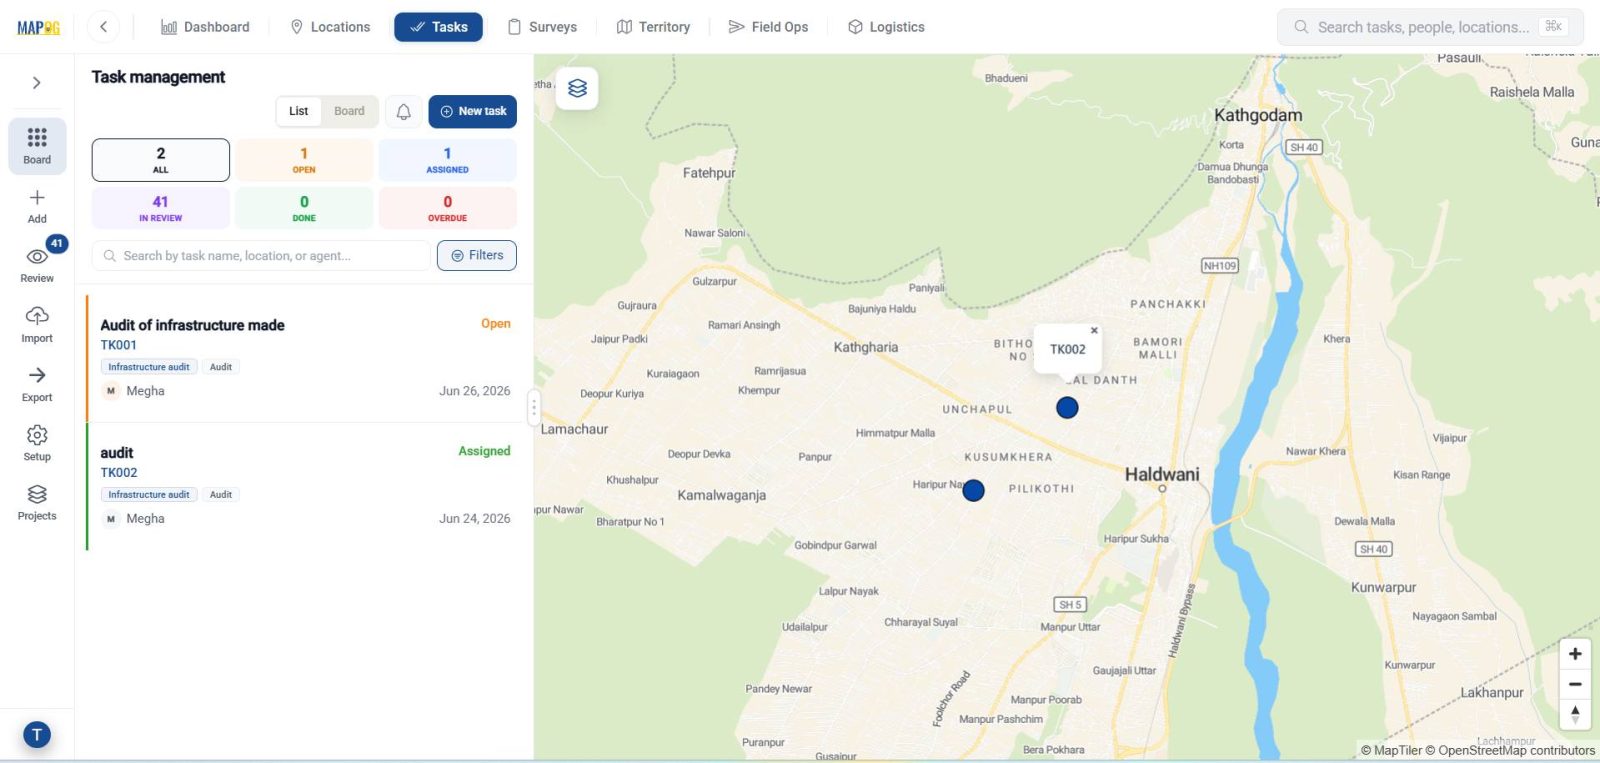
In the Task Management section, supervisors can filter tasks based on project type, location, status, or assigned member.
Moreover, submitted tasks can be reviewed through the Task Review section.
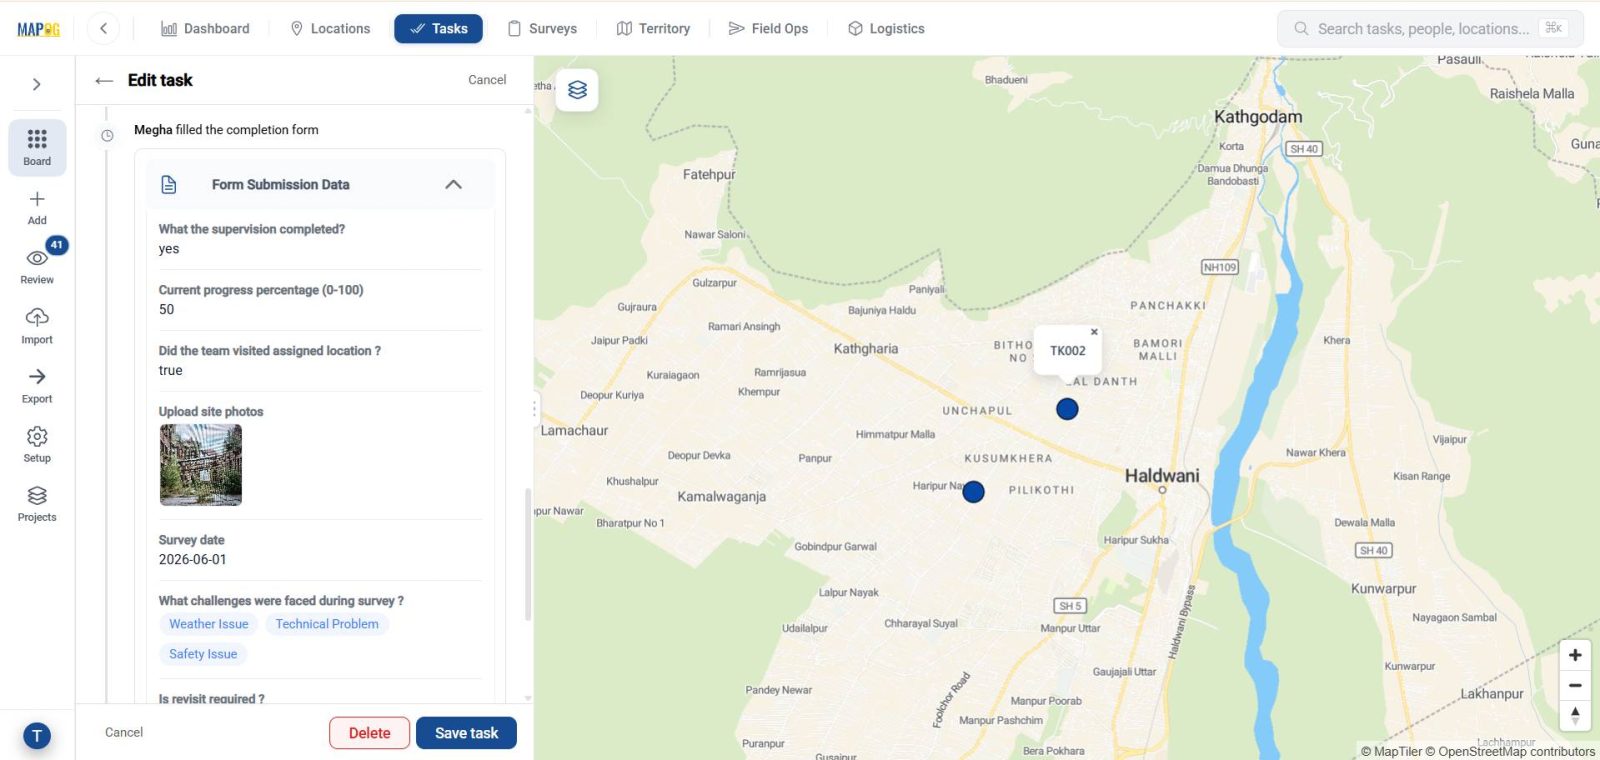
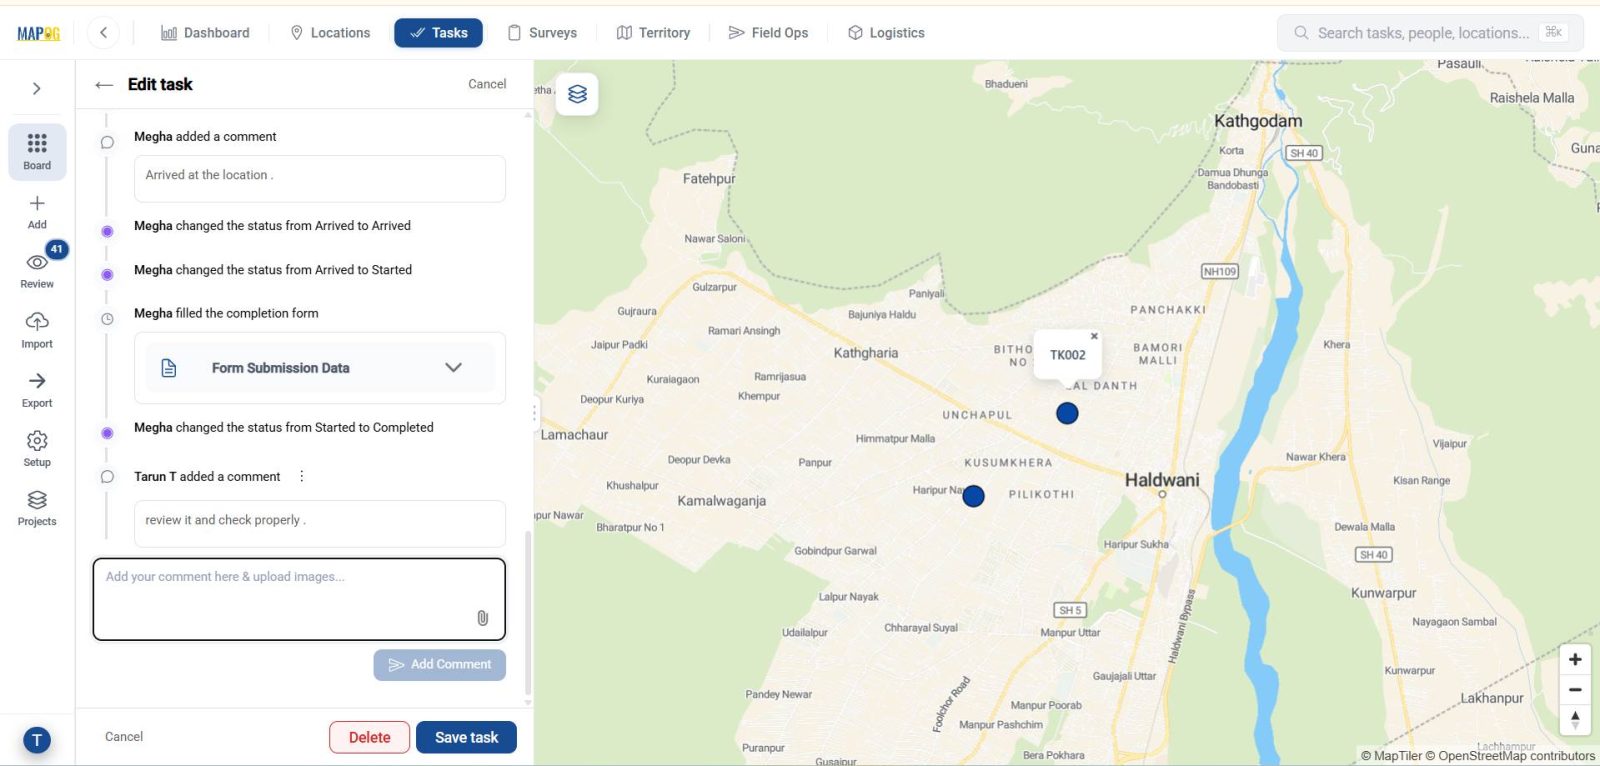
where managers can update status and add comments for verification.
Step 8: Create a New Map
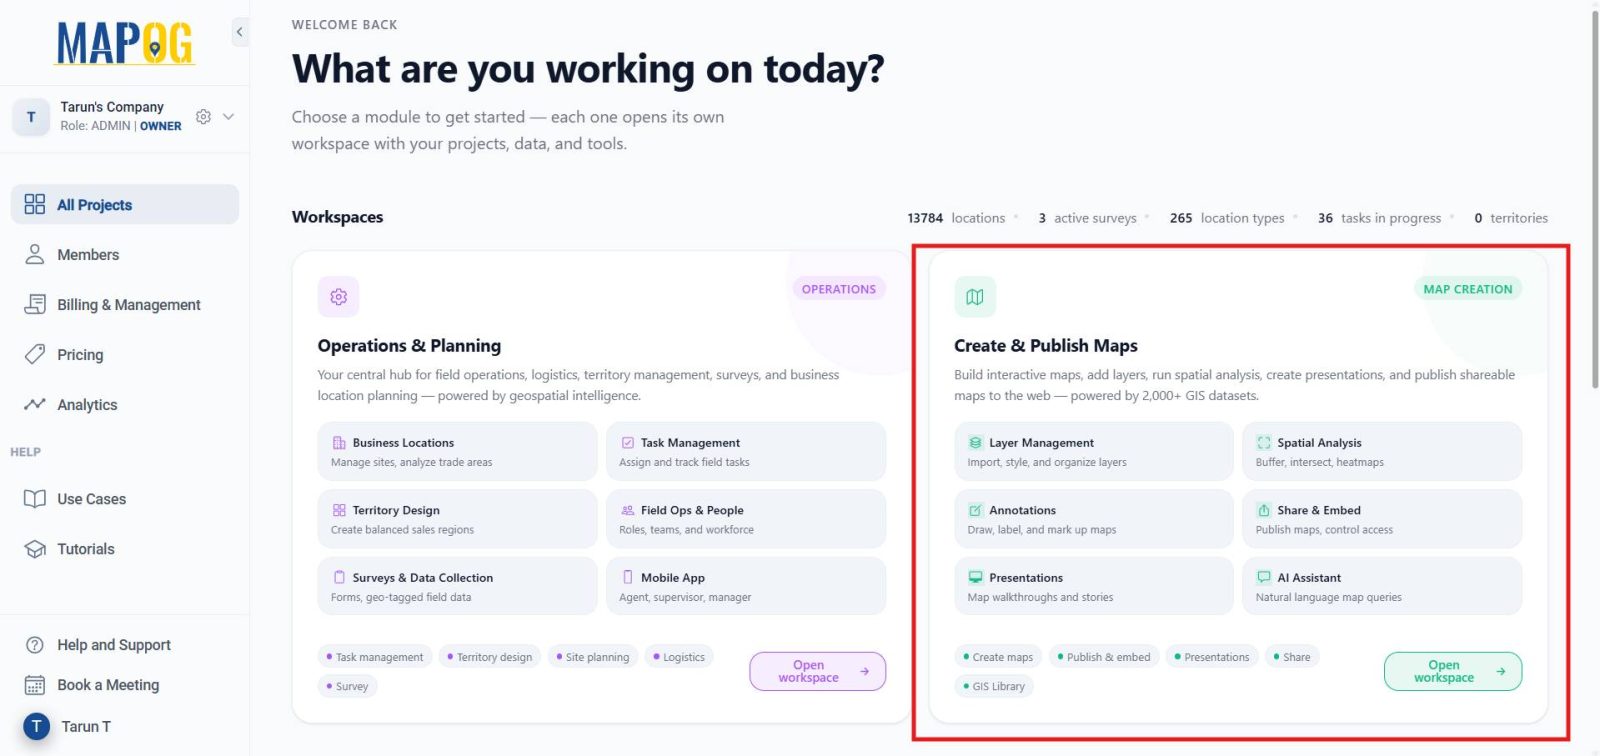
Go to the MAPOG dashboard and click Create & Publish Maps.
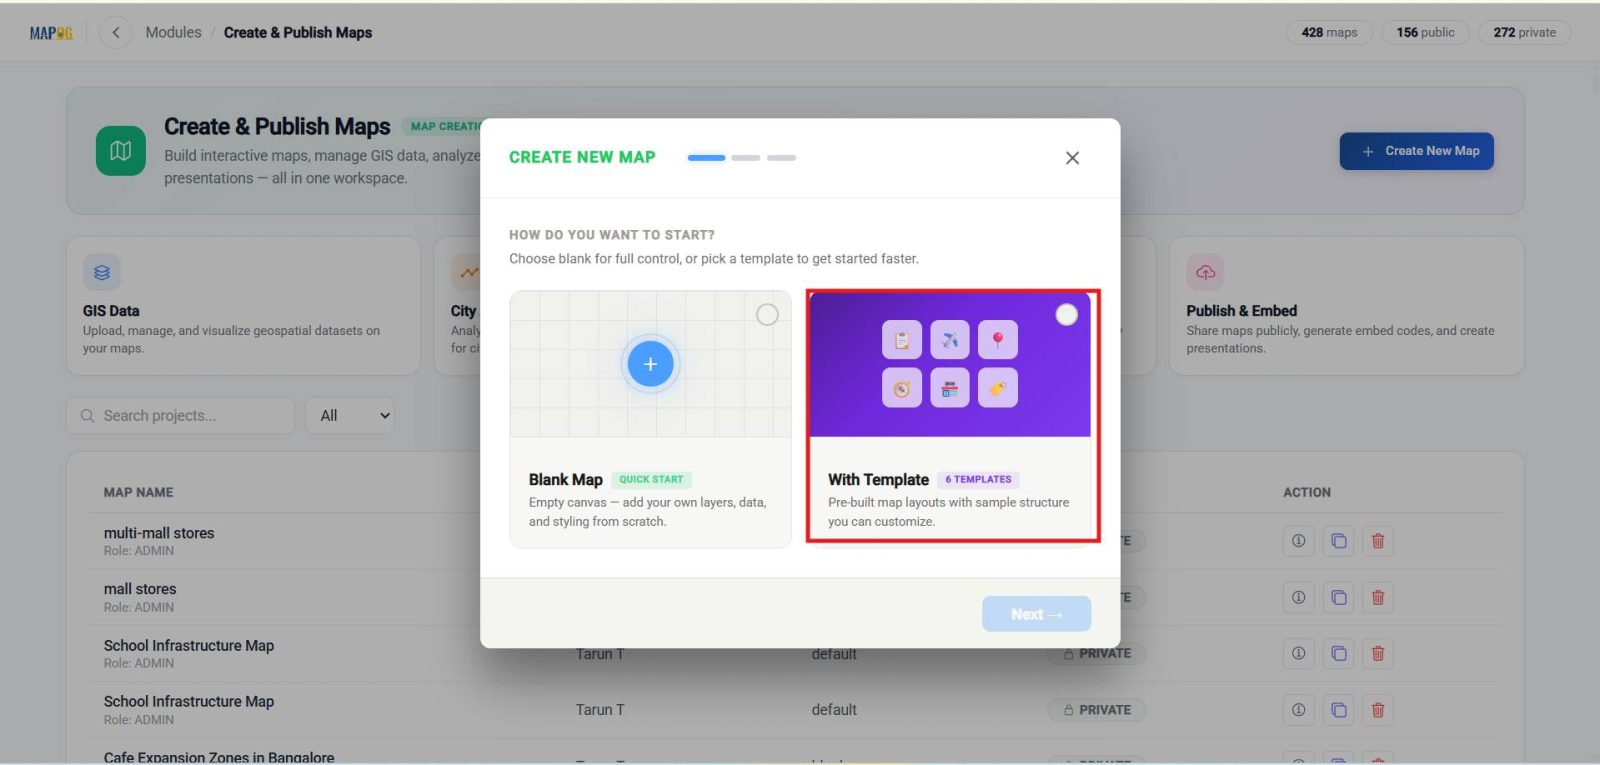
Then create a new map using a suitable template and proceed further.
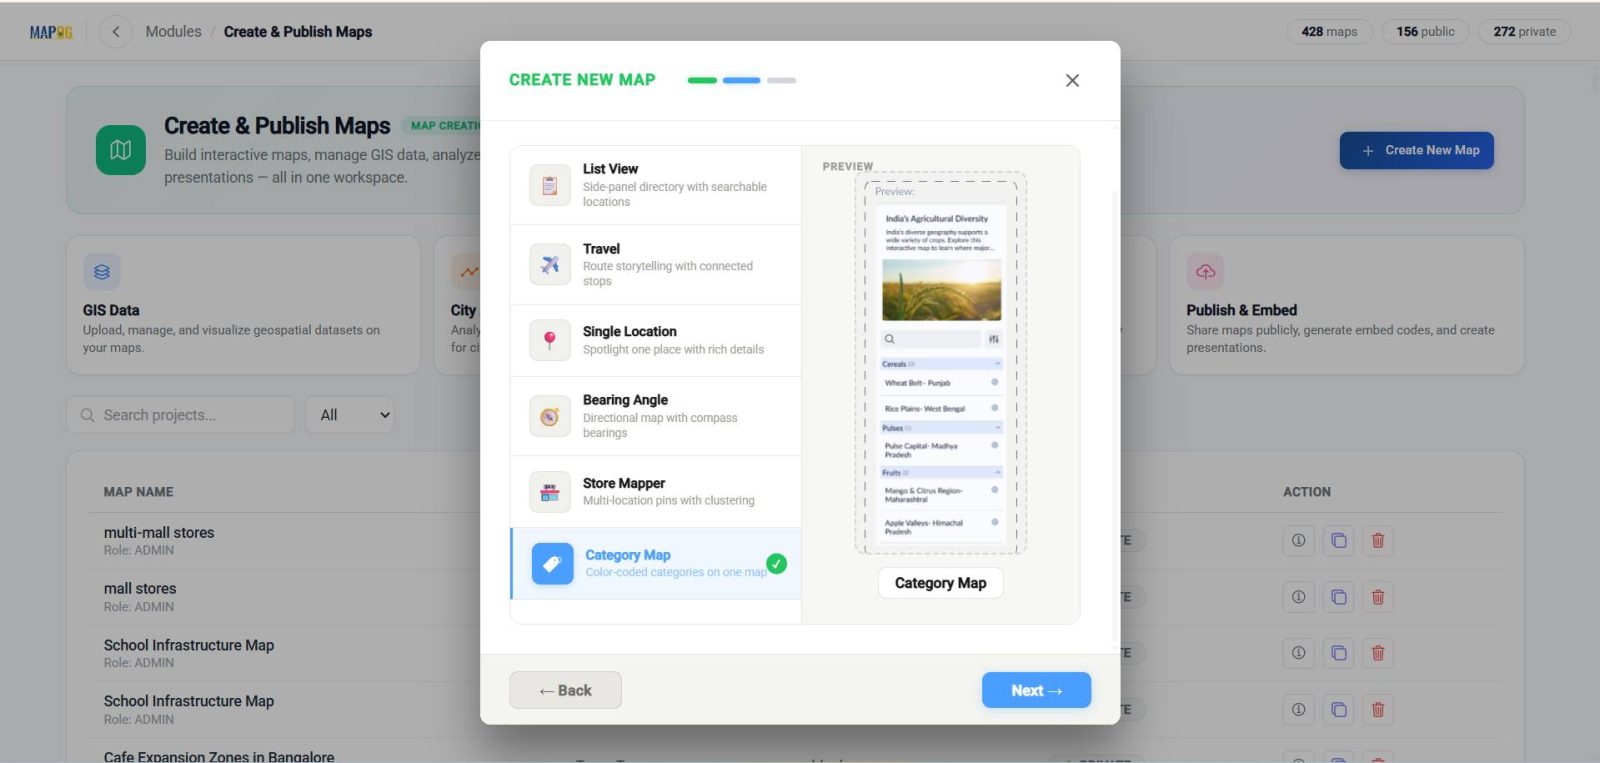
Choose category Map out of different template provided.
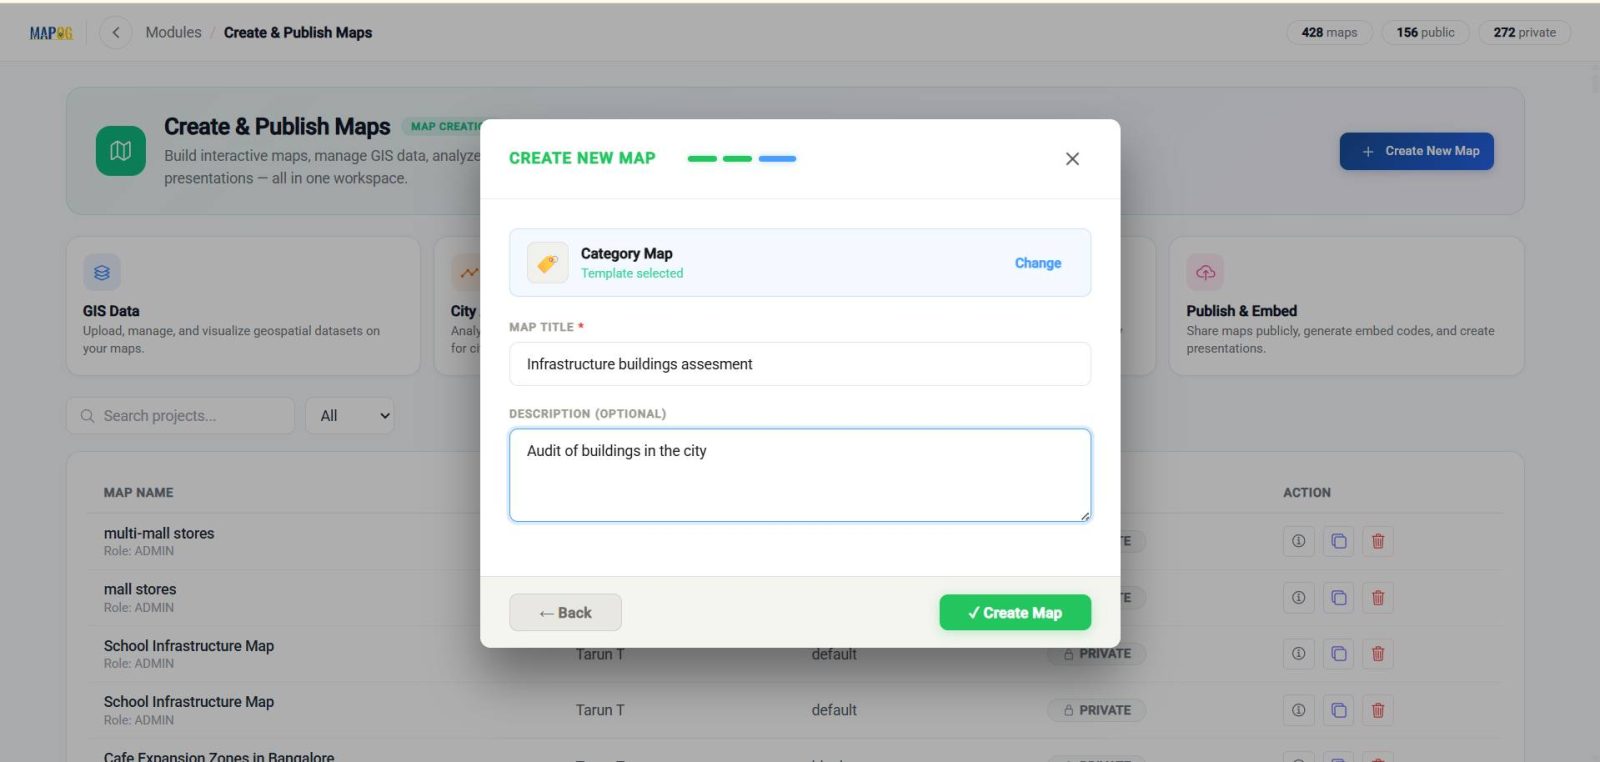
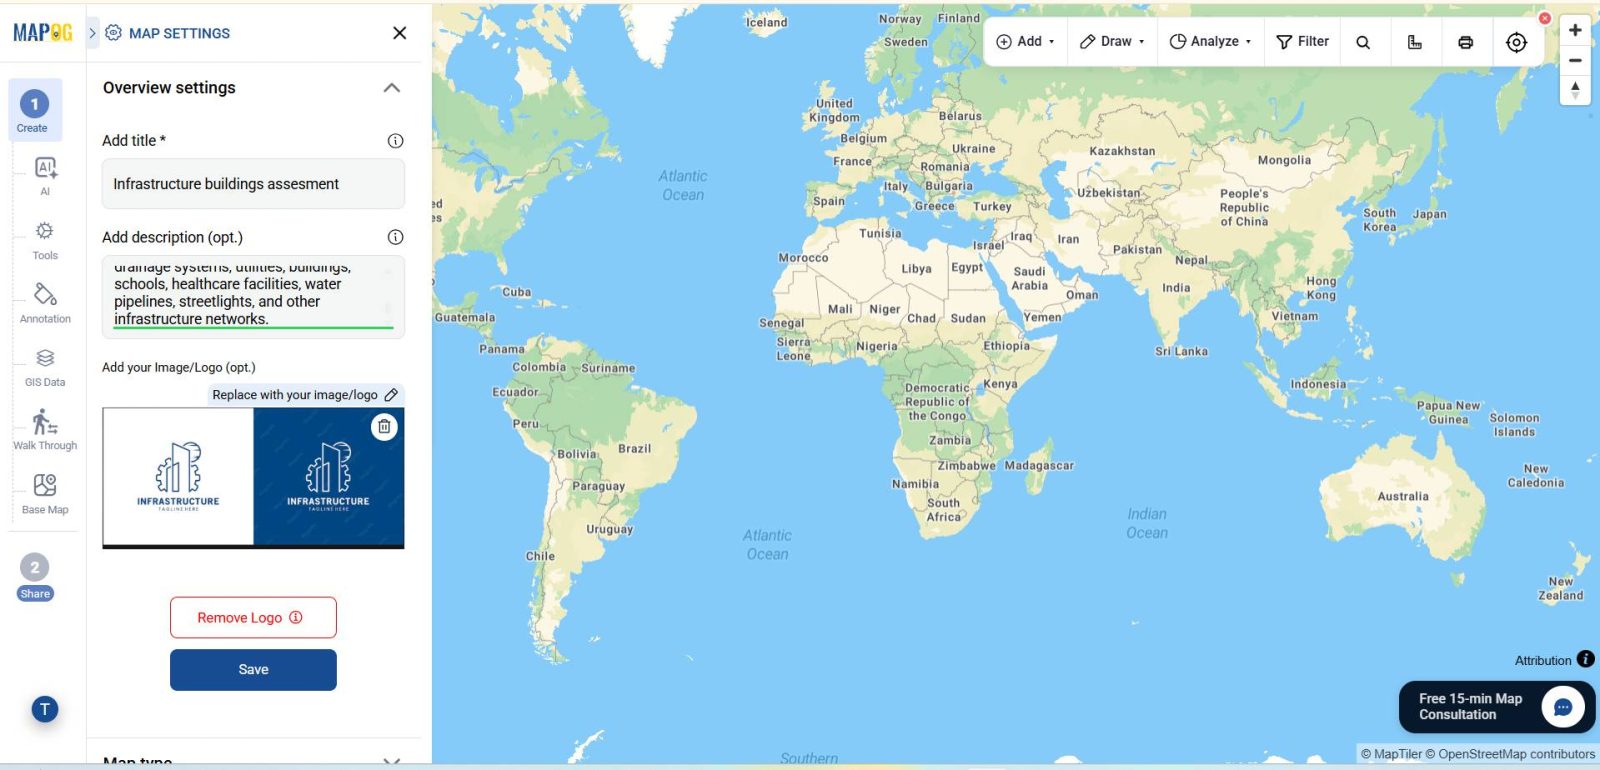
Add map title and description before creating the map.
To customize branding, go to Map Settings, upload the company logo, and save changes.
Step 9: Add Project Locations to Map
Next, click Add Location and choose Add via Library.
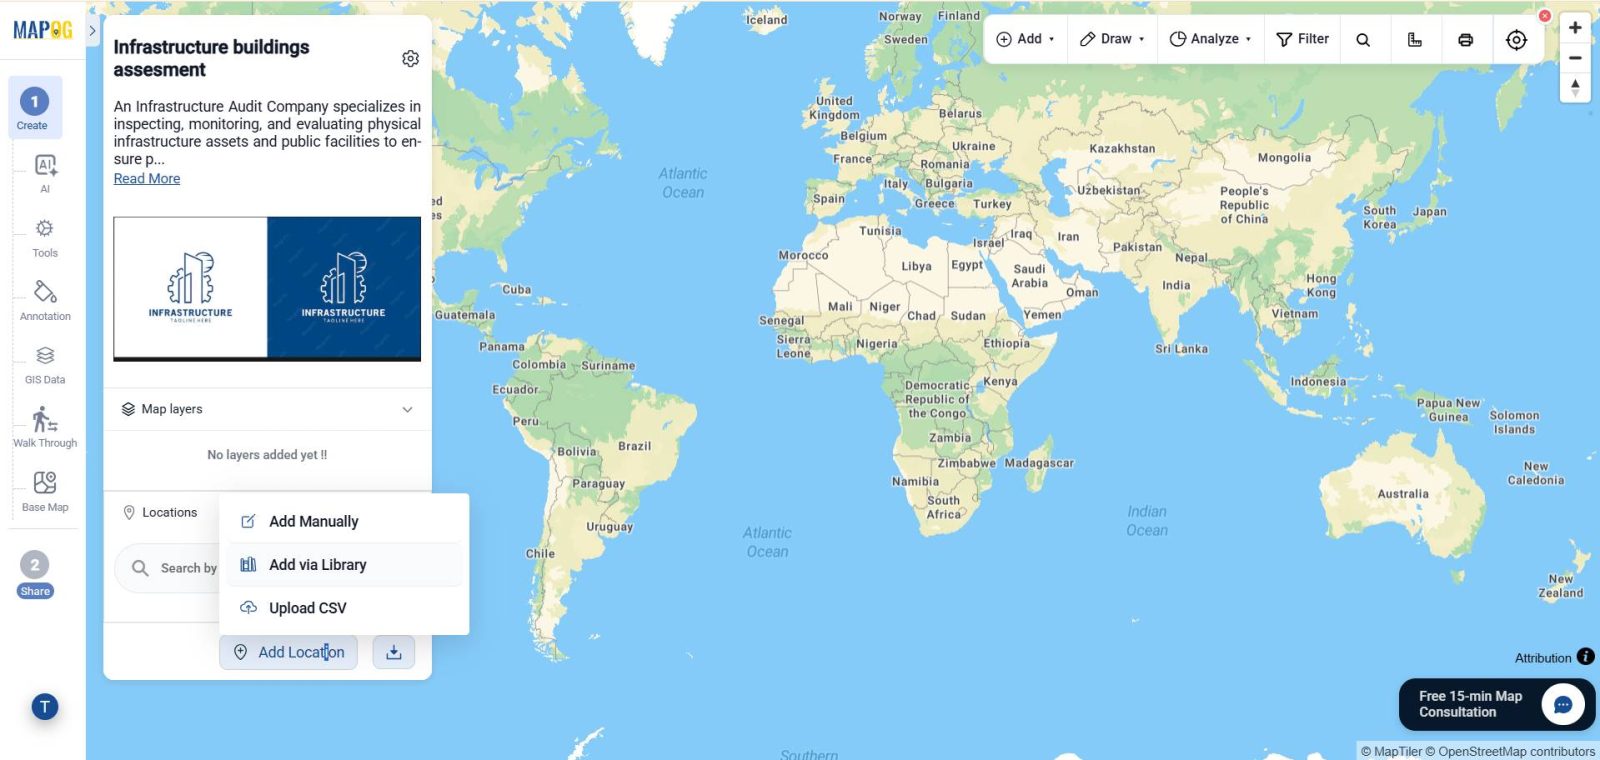
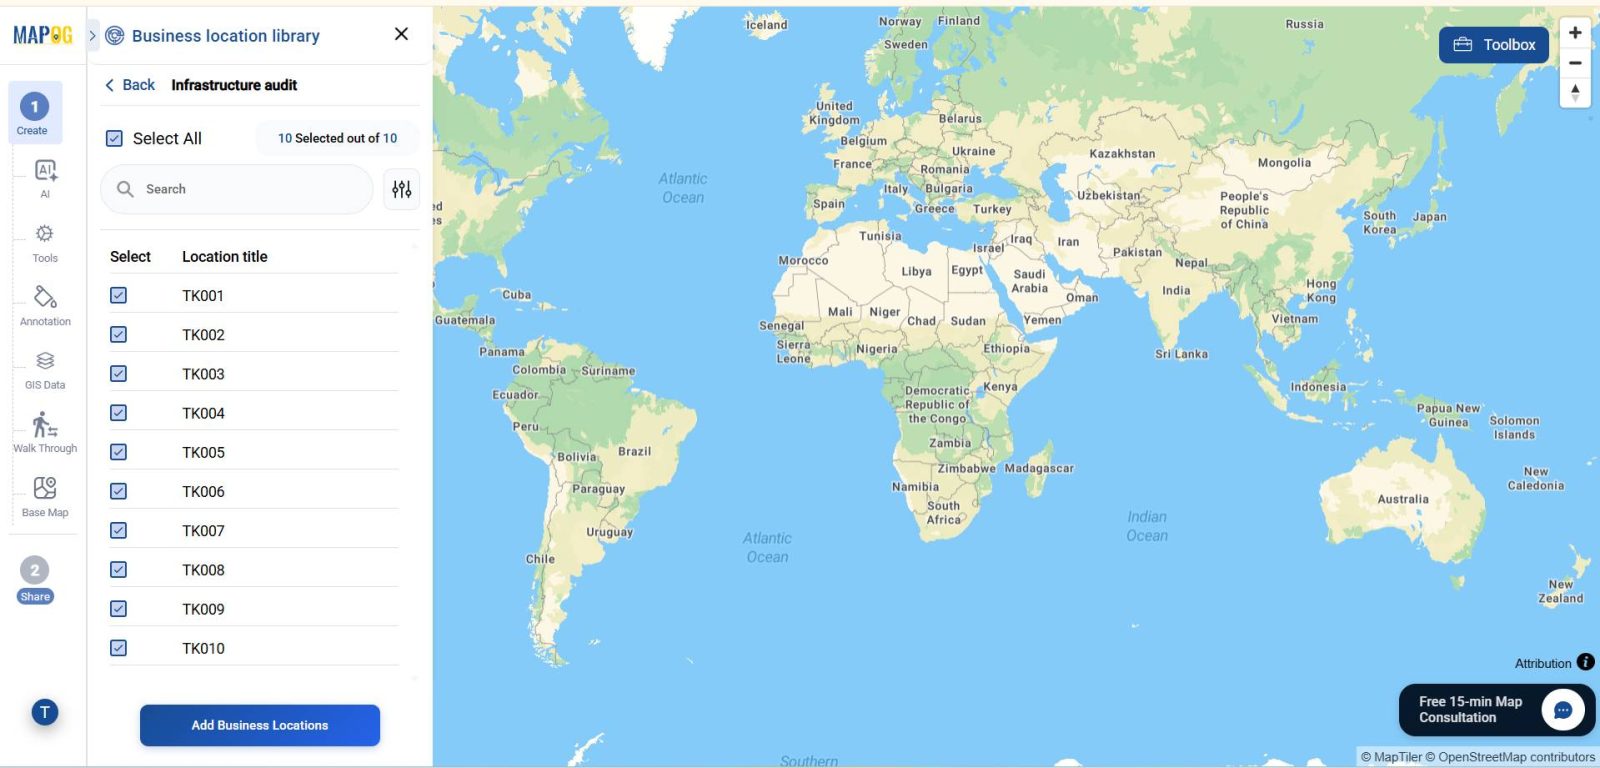
After that, select your custom location template.
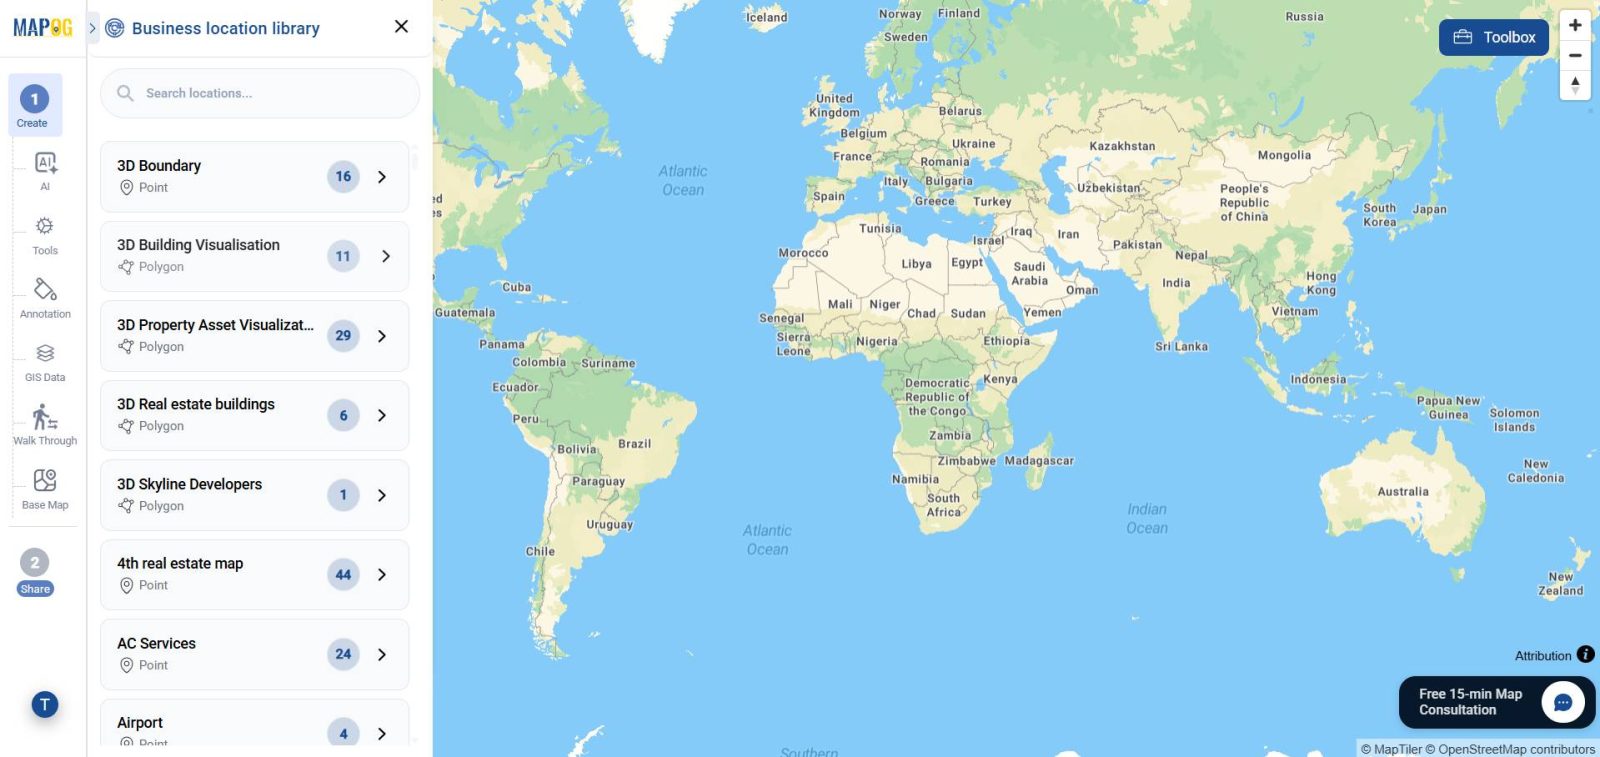
and add all uploaded project locations to the map.
Step 10: Group, Filter, and Style Data
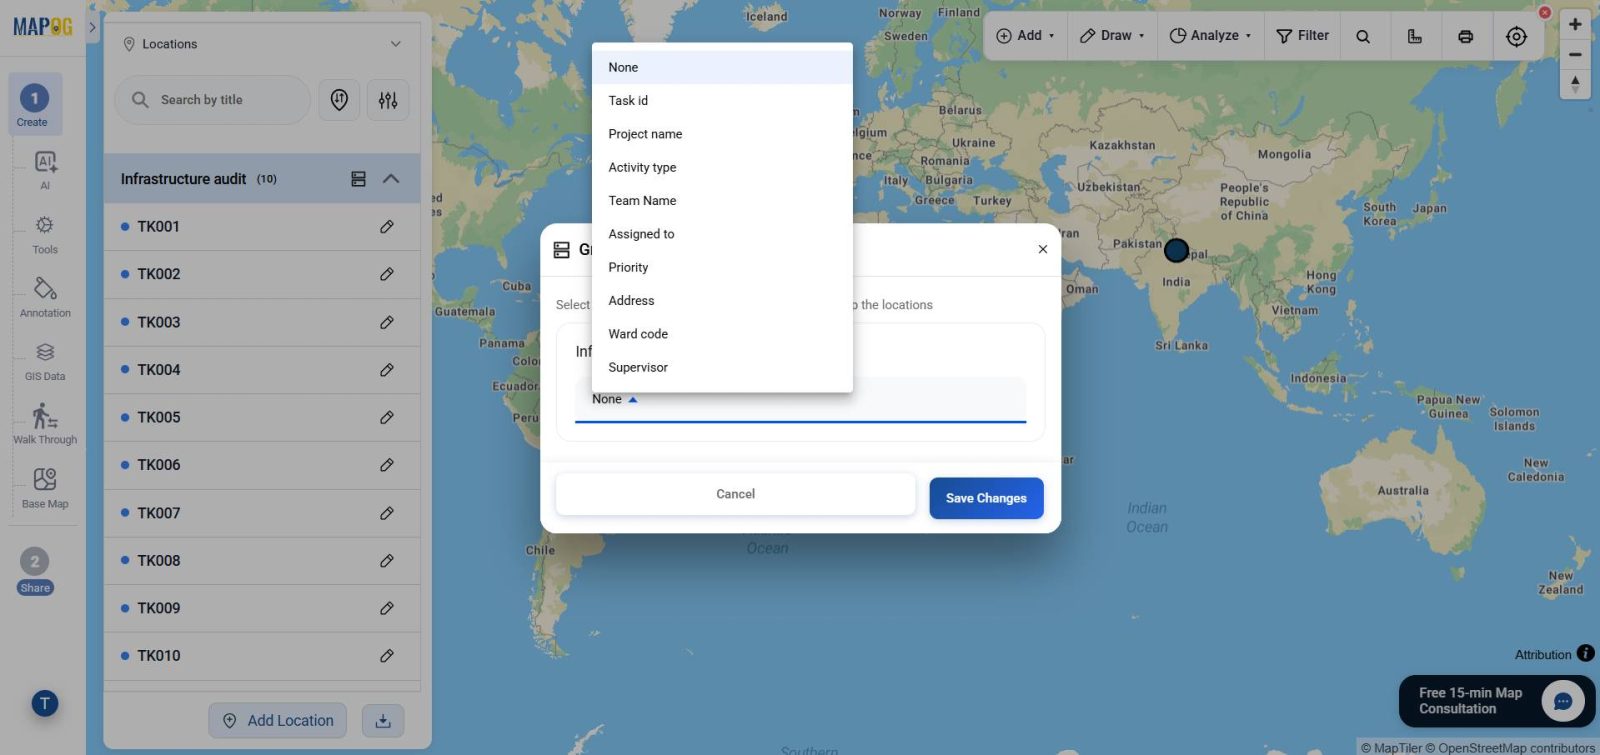
Use Group by Attributes to organize locations based on activity type, project category, or team assignment.
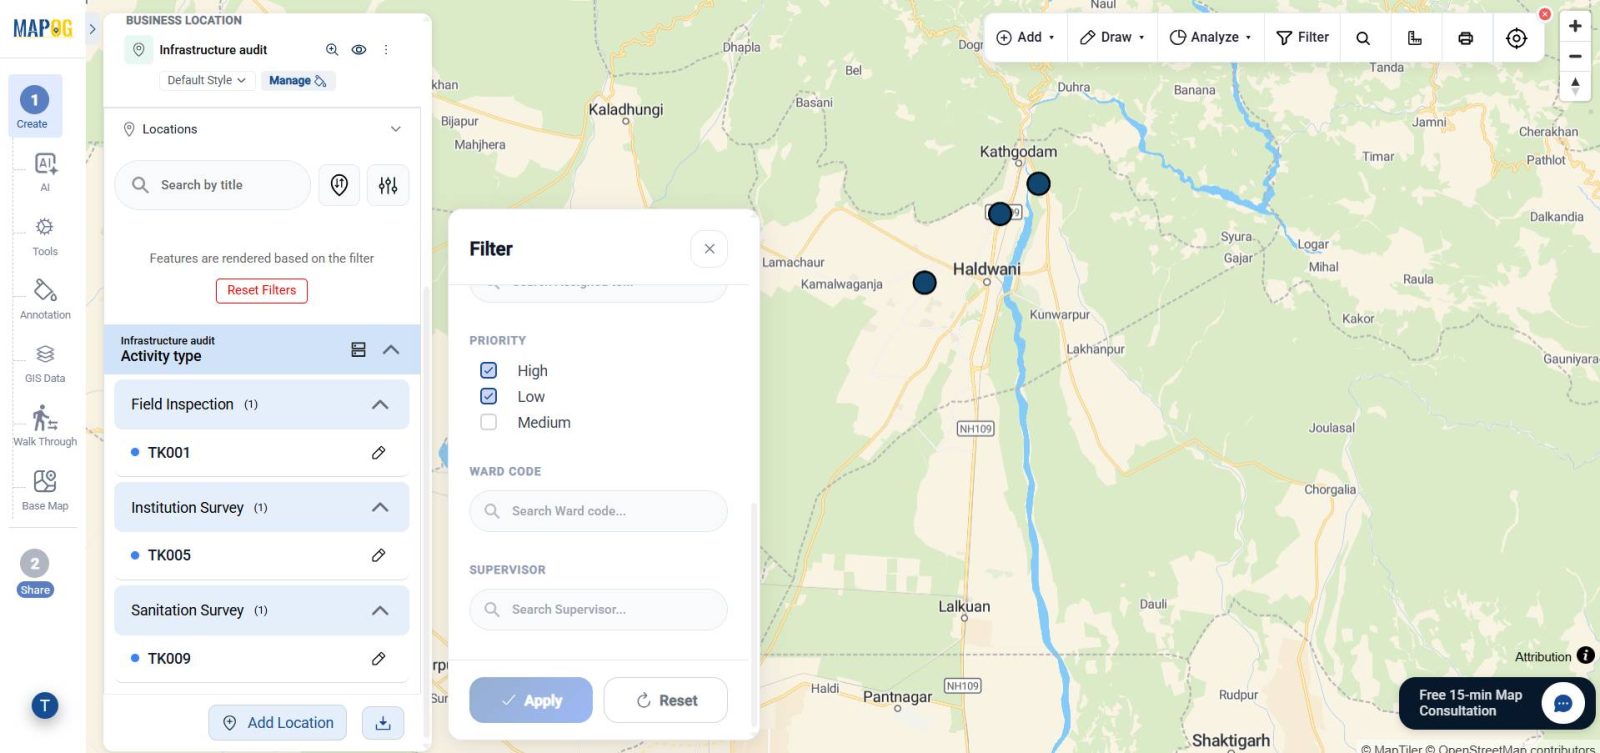
Similarly, apply filters to display only selected project sites.
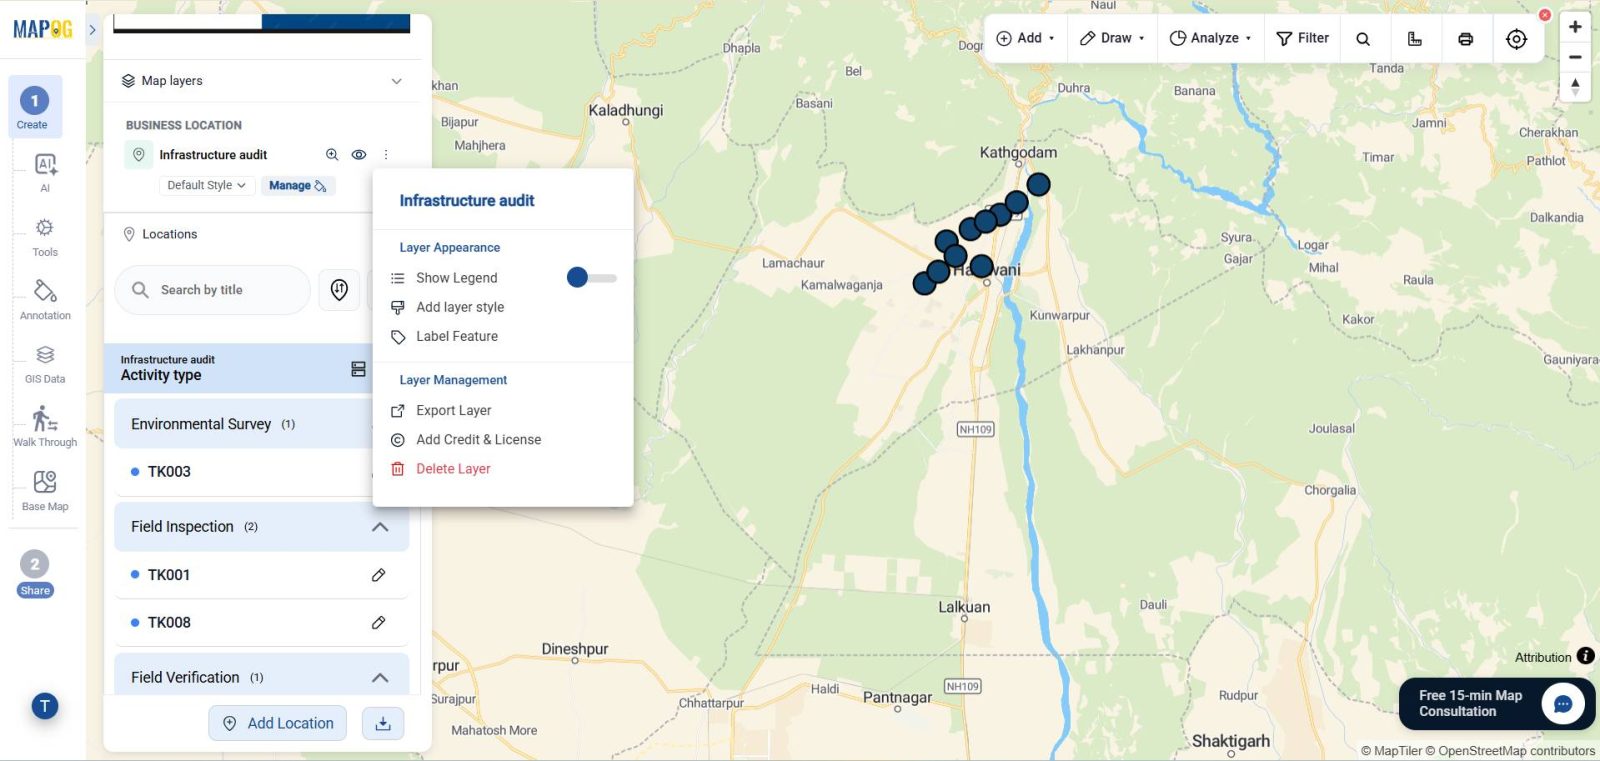
To improve visualization, use Add Layer Style
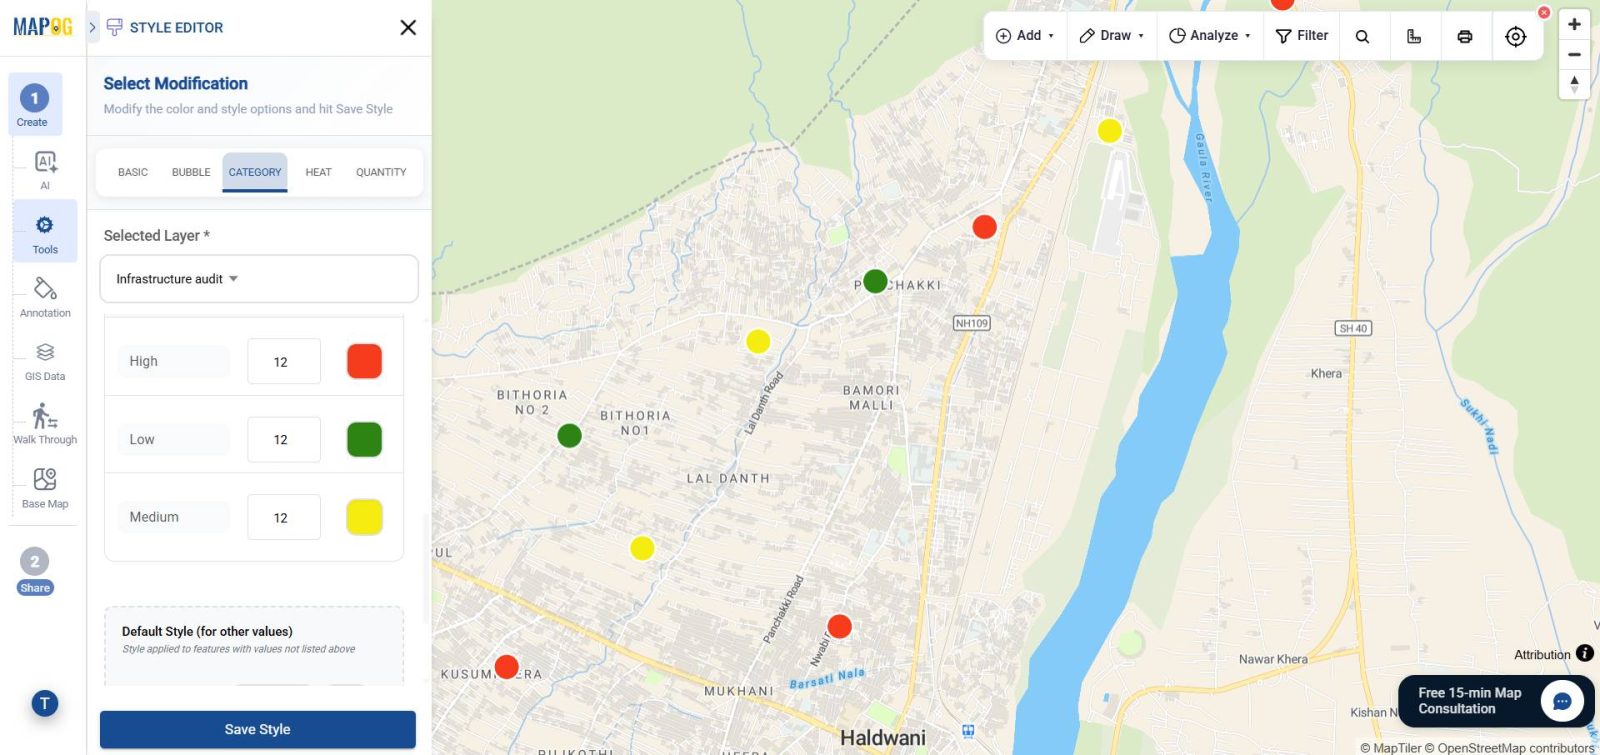
and assign different colors or icons based on project status or activity type and choose category style .
Step 11: Preview and Share
Finally, open Preview & Share to make the map public or private.
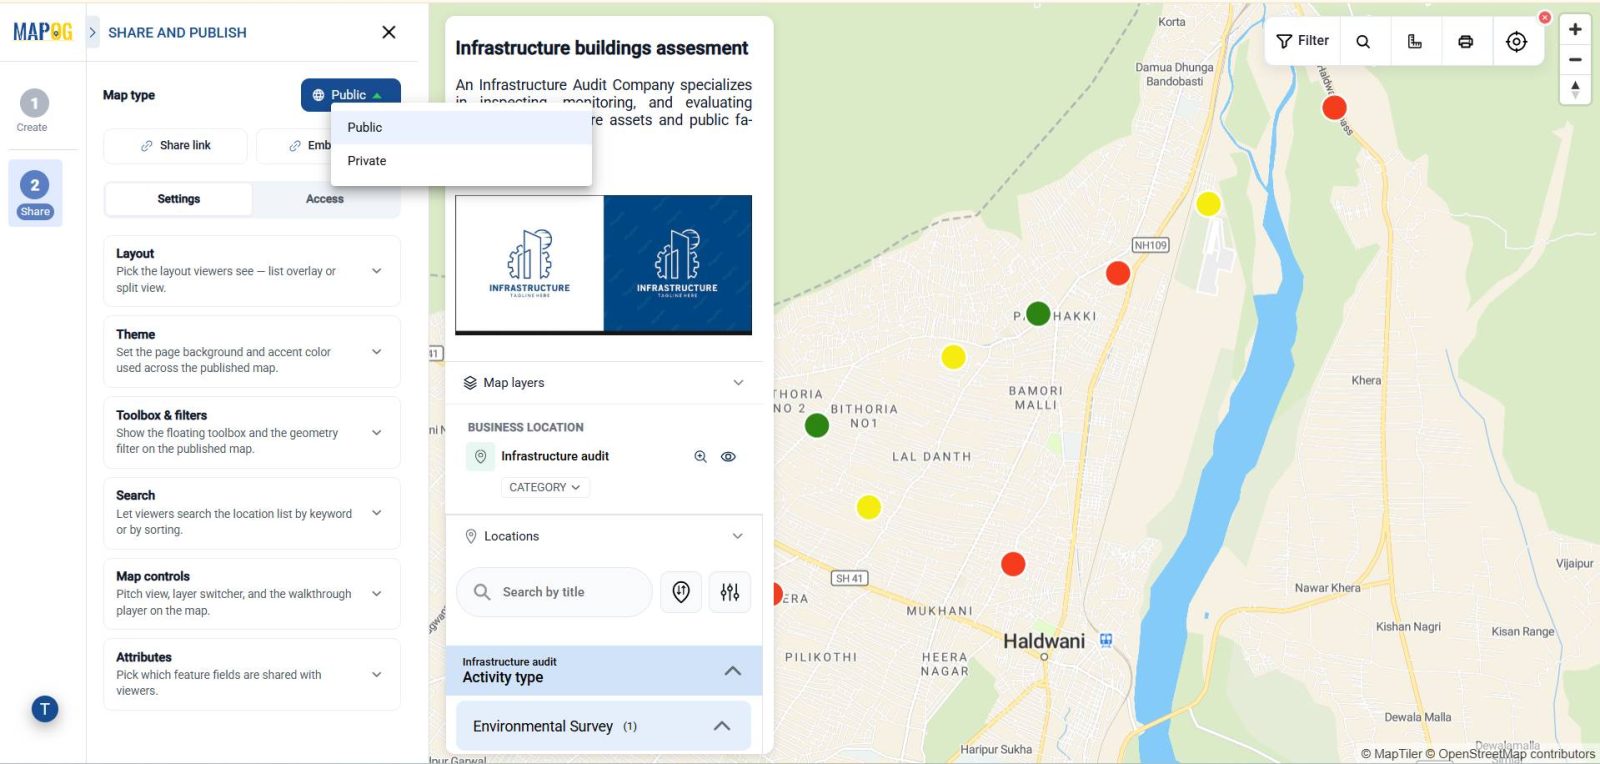
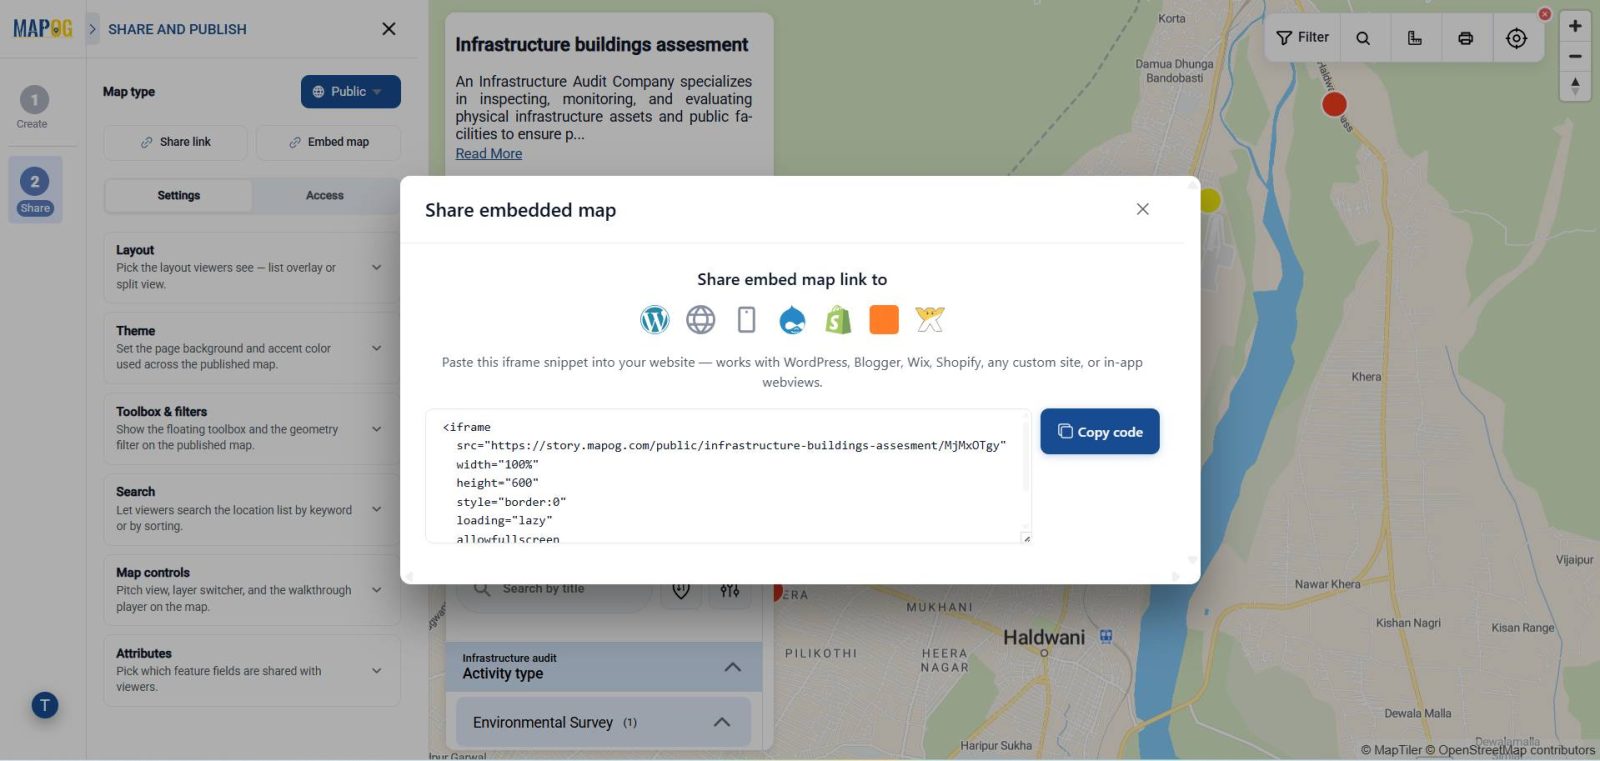
You can share the map using direct links or embed links across websites and platforms.
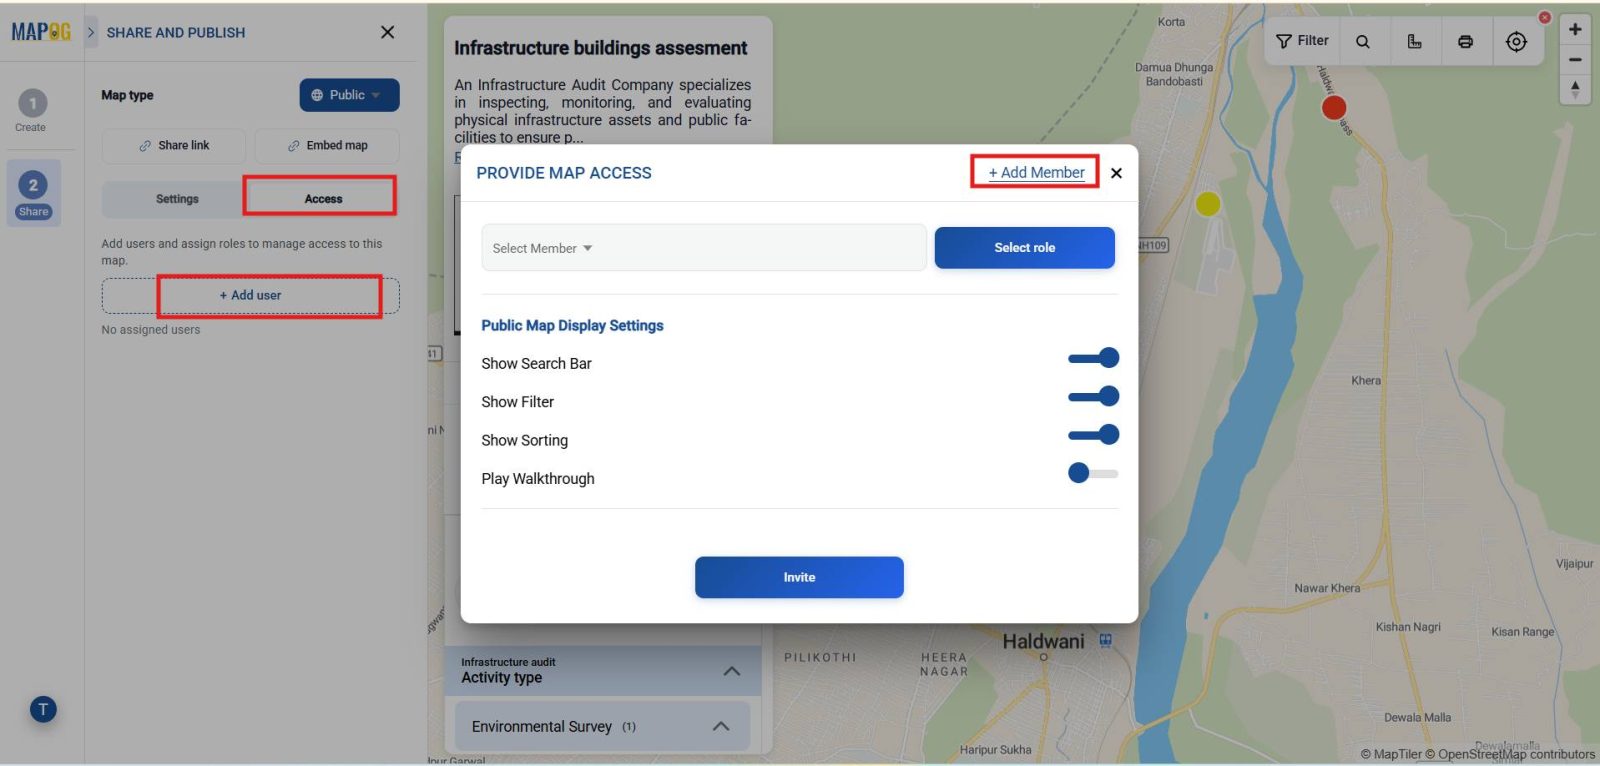
Additionally, users can be added for collaboration and live monitoring.
Industrial Benefits
A centralized project tracking system improves visibility, accountability, and coordination across teams. Moreover, location-based monitoring helps organizations identify delays faster, optimize field operations, and improve reporting accuracy. As a result, industries such as infrastructure, utilities, construction, logistics, environmental monitoring, and public administration can manage projects more efficiently.
Conclusion
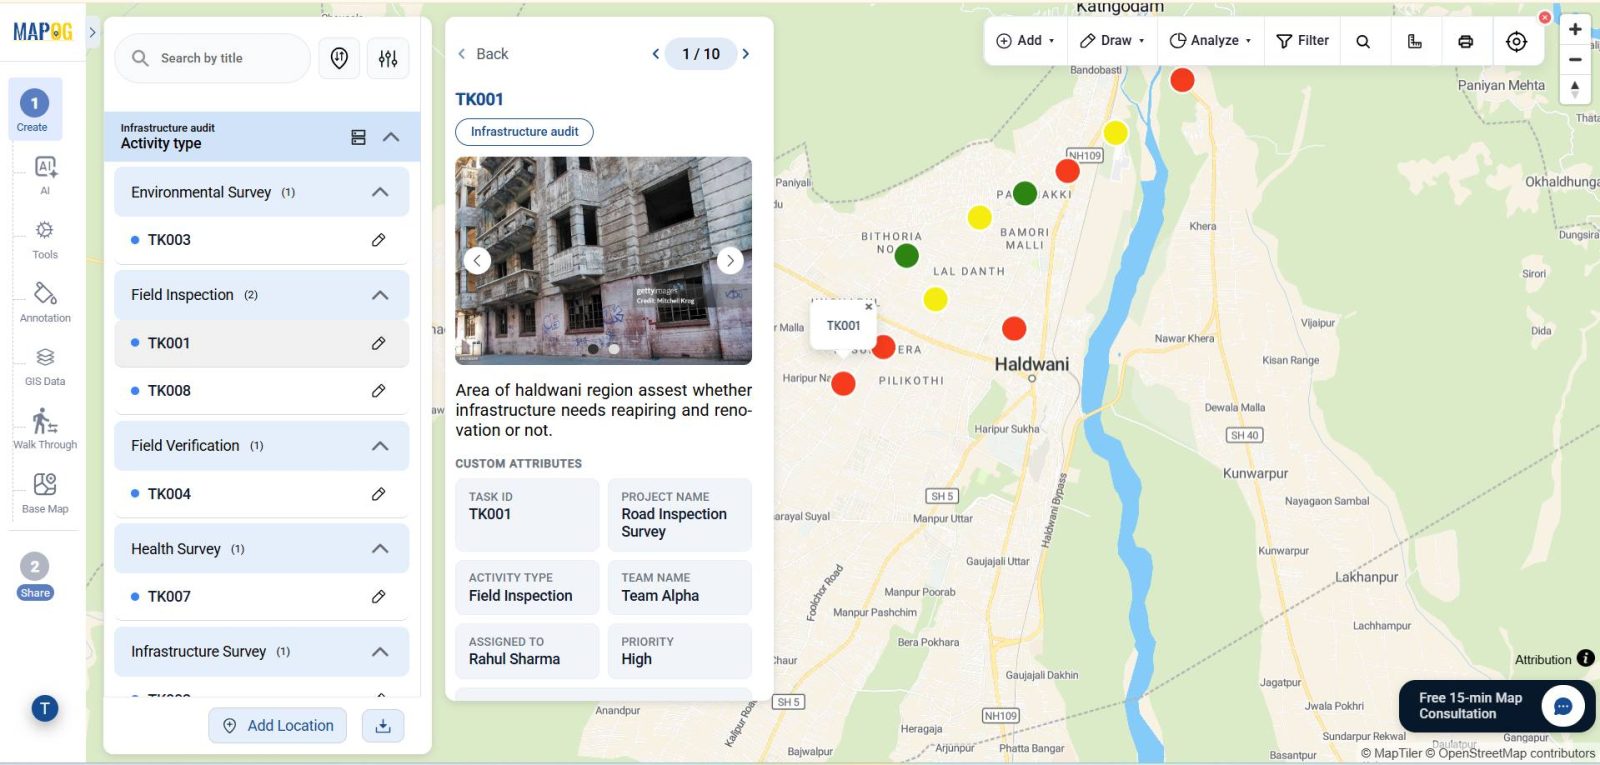
Track team activities and project progress using location-based maps simplifies field operations and improves real-time monitoring. With MAPOG, organizations can manage locations, assign tasks, collect updates, and visualize progress on a centralized map interface. Consequently, teams can improve efficiency, reduce delays, and make faster operational decisions.