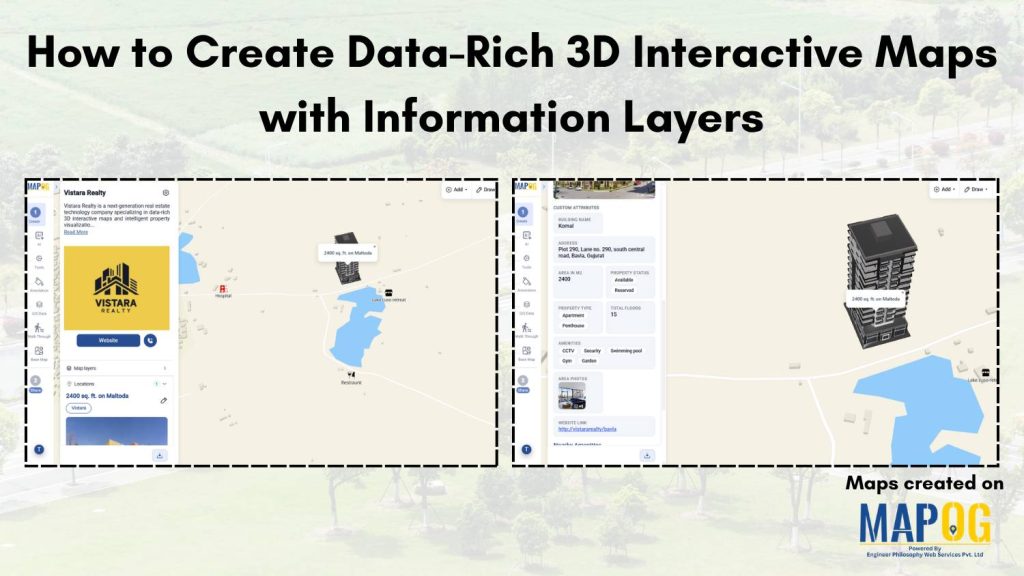
Location data is becoming crucial, but many industries still struggle to make sense of scattered and complex geographic information. In fields like real estate, urban planning, and infrastructure, traditional maps and dashboards often make it hard to visualize data clearly and make quick decisions. With MAPOG, you can use data-rich 3D interactive maps to turn location-based data into immersive, interactive experiences with multiple information layers. Further, businesses can explore insights more naturally, understand patterns faster and make smarter decisions with confidence.
Key concept of map
The key concept of a data-rich 3D interactive map is to combine geographic visualization with layered information in one immersive experience. Instead of viewing data in separate dashboards or reports, users can interact directly with locations, buildings and regions while exploring insights and analytics. Layers such as property data, demographics, traffic, or infrastructure can be added dynamically, making the map more interactive, intuitive, and useful for decision-making.
Step-by-step process of creating map
Step 1: Create the map
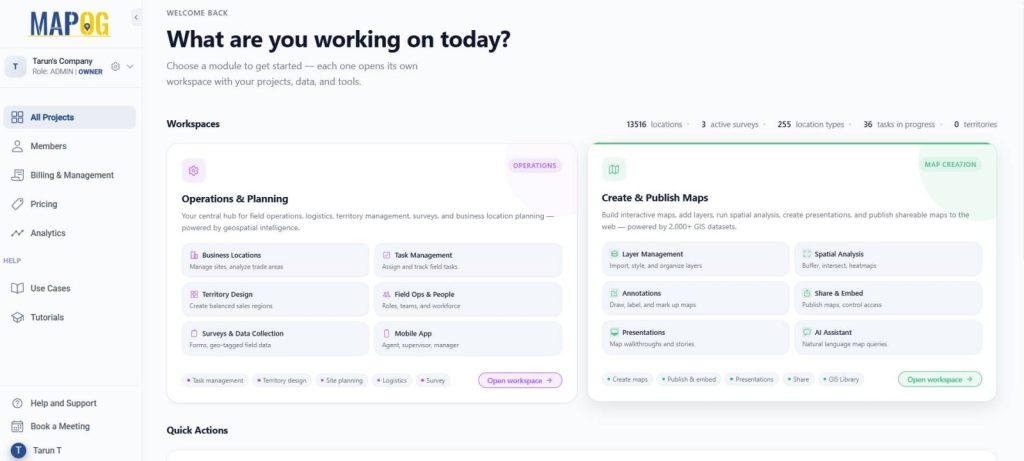
Go to MAPOG and select Create & Publish Maps.
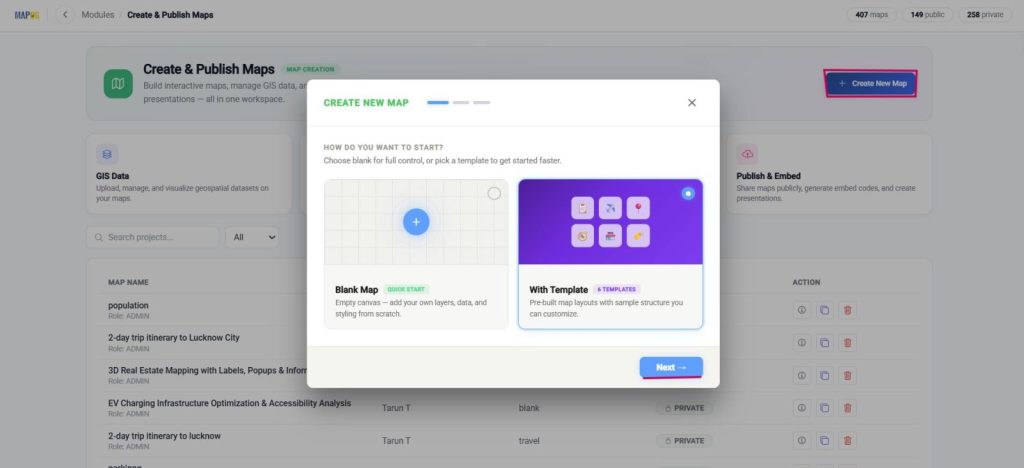
Further, select Create new map, with template and press next.
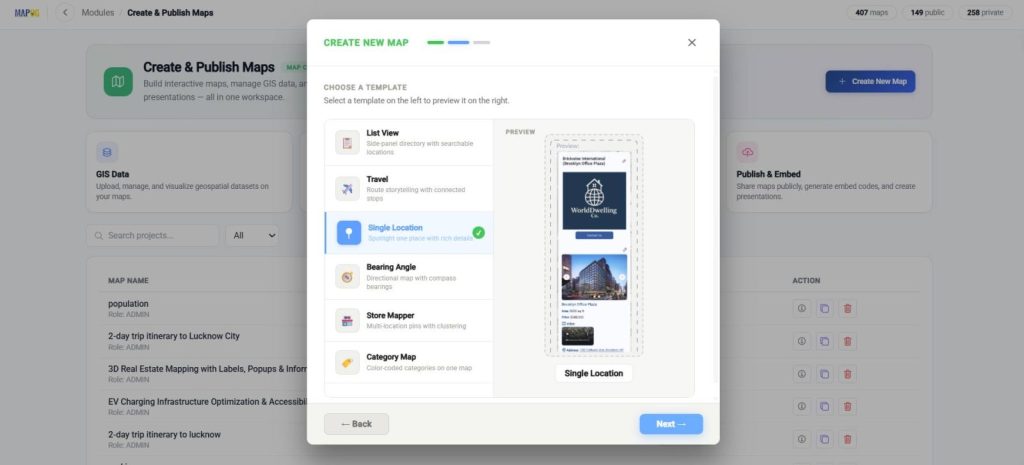
Now, choose a single location template.
Next, add title and description and Create map.
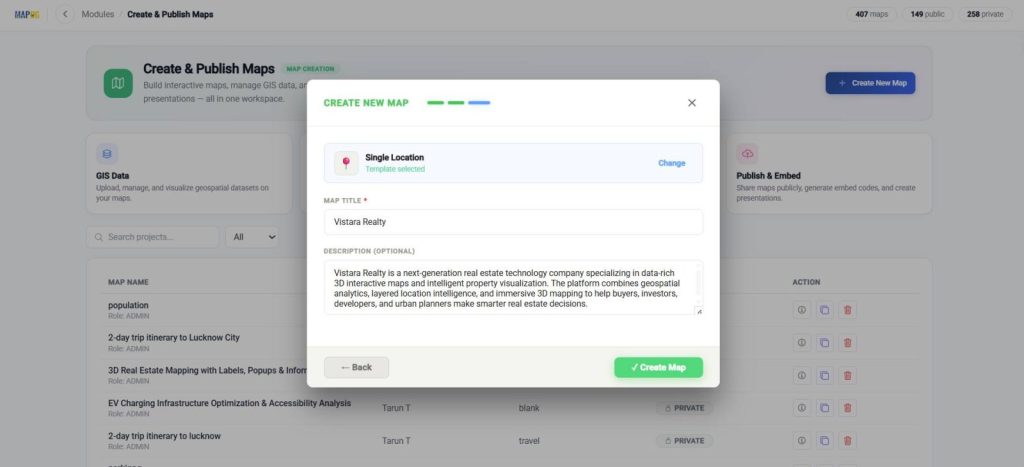
Further, to upload your company logo for a professional look, go to map settings, upload and save.
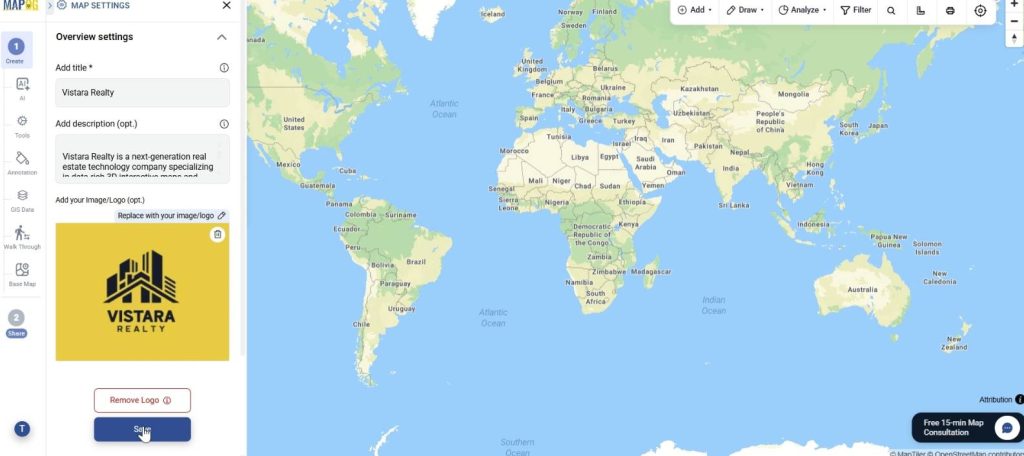
Step 2: Add 3D model annotation to map
Now, to upload your 3D building model for better visualization, locate your area by using the search option in the toolbar. Further, go to annotation and click on the 3D model to upload the model using glb, gltf or zip folder.
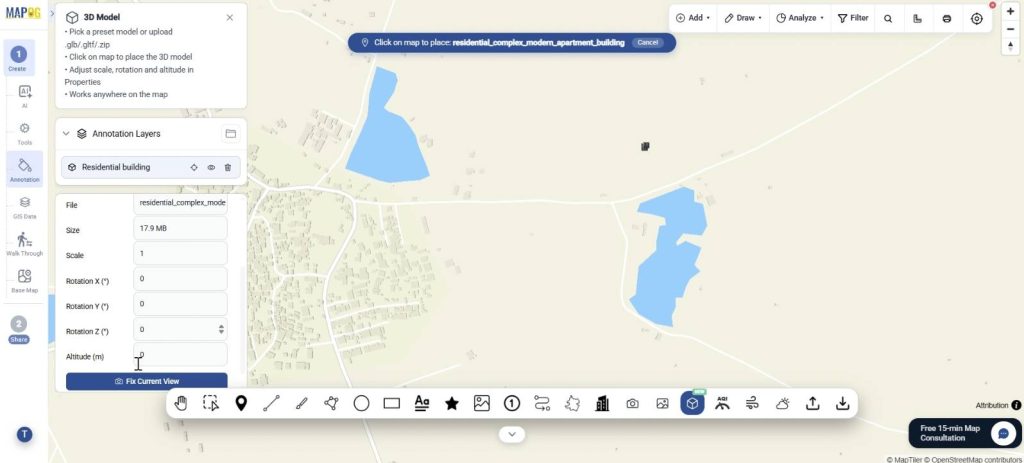
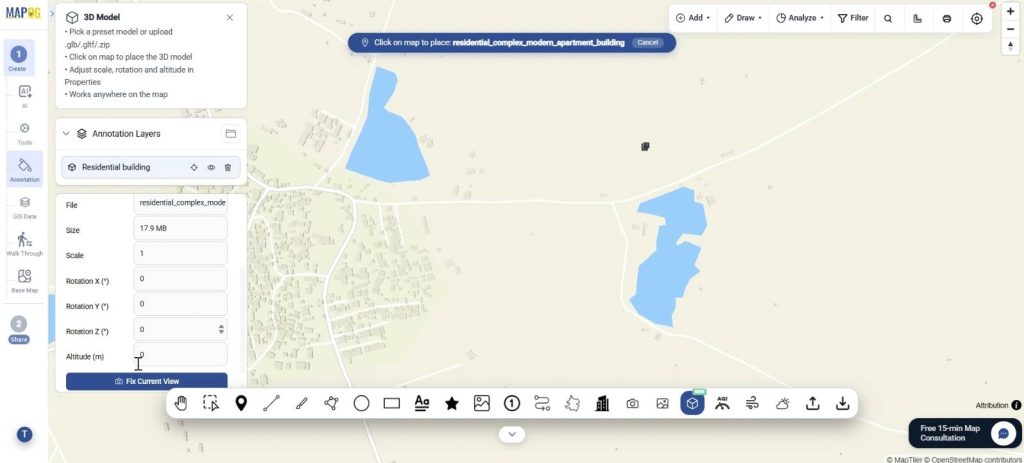
Once the model is placed on the map, you can adjust the opacity, scale, altitude, and even rotate the model on X, Y, and Z axis for accurate positioning. Finally select the Fix Current View.
Step 3: Add location with attributes
Next, add location with custom attributes tailored to the building for a data rich and interactive model complete with pictures. Go to Add location and select Add manually.
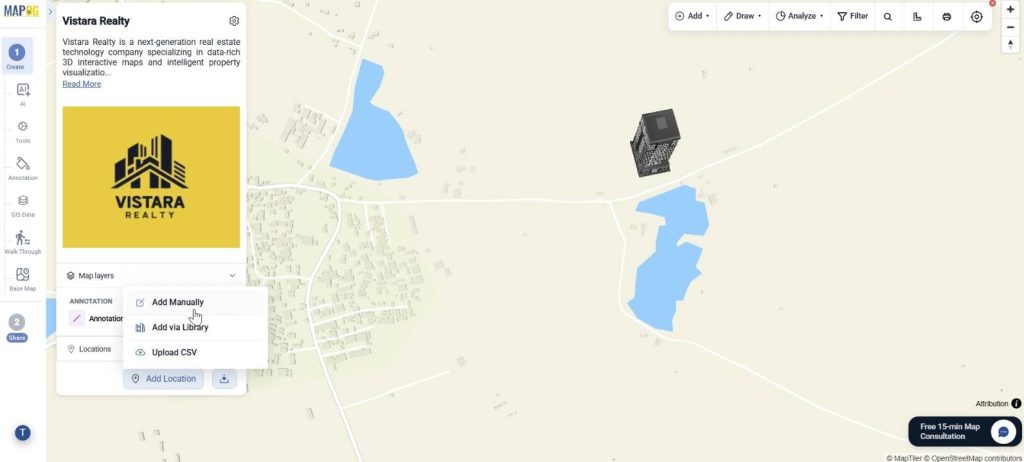
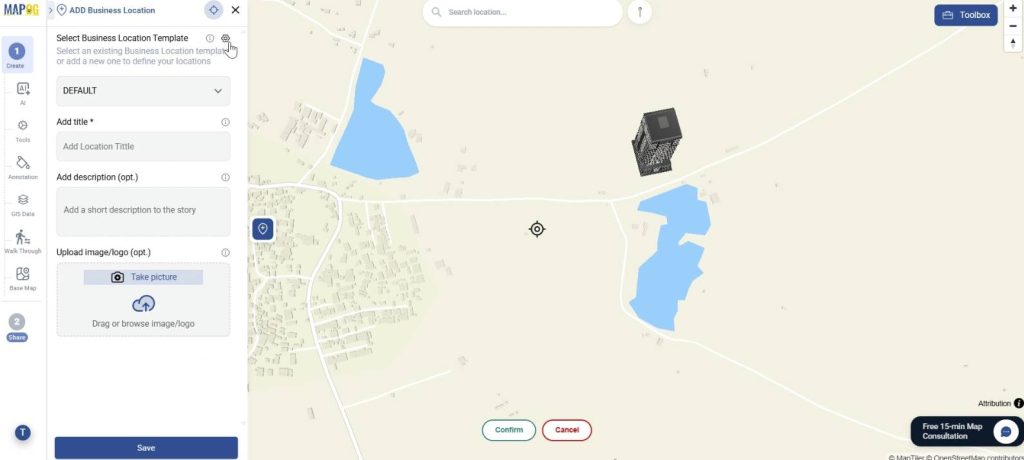
Here, go to business location template settings and in location types, click on +New type.
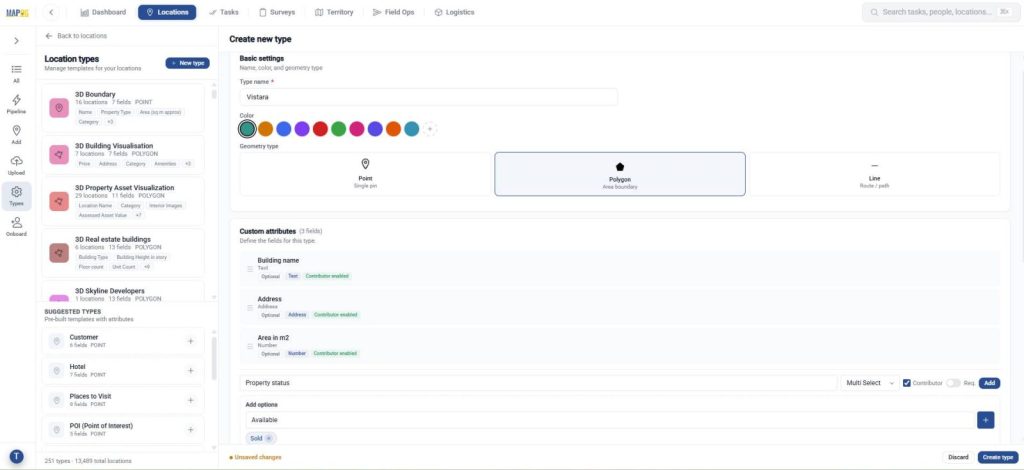
Next, add a name, colour and select geometry as polygon, so that you can accurately trace the boundary of the building. Further, add custom attributes such as building name, property type, facilities, area photos with type such as text, multi-select, images etc suitable for each attribute. You can also enable contributors so teams can update data collaboratively. Click the create type to save the template.
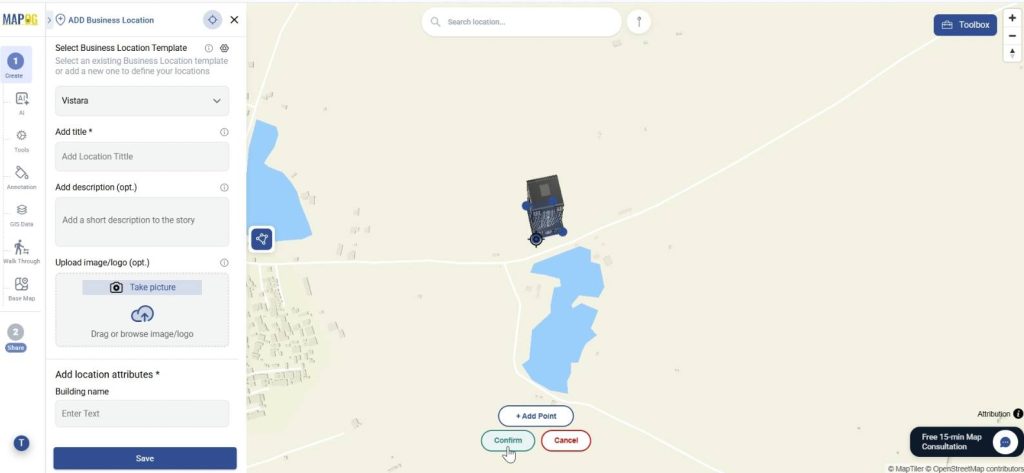
Now select the newly created location type and use the polygon draw tool to trace the building footprint directly on the map by adding points on each corner and conforming it.
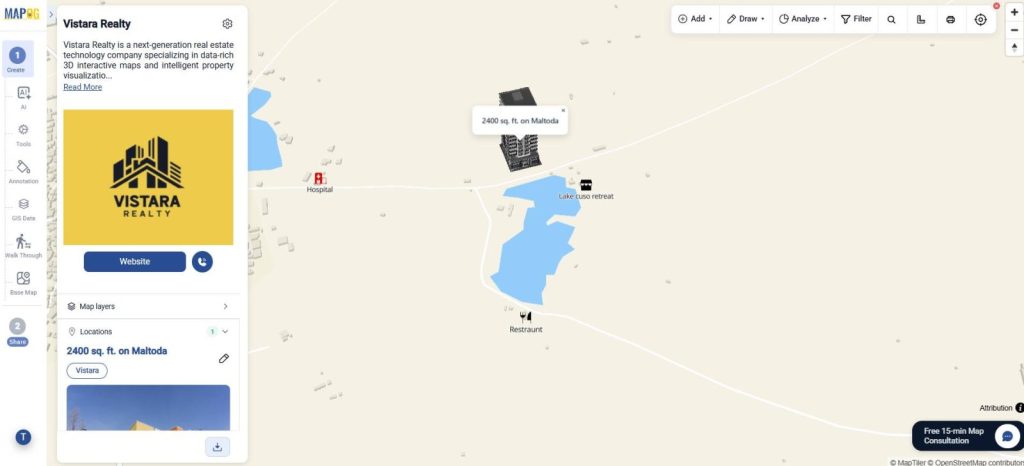
Add detailed information, upload images and save the building location to create a fully interactive spatial record.
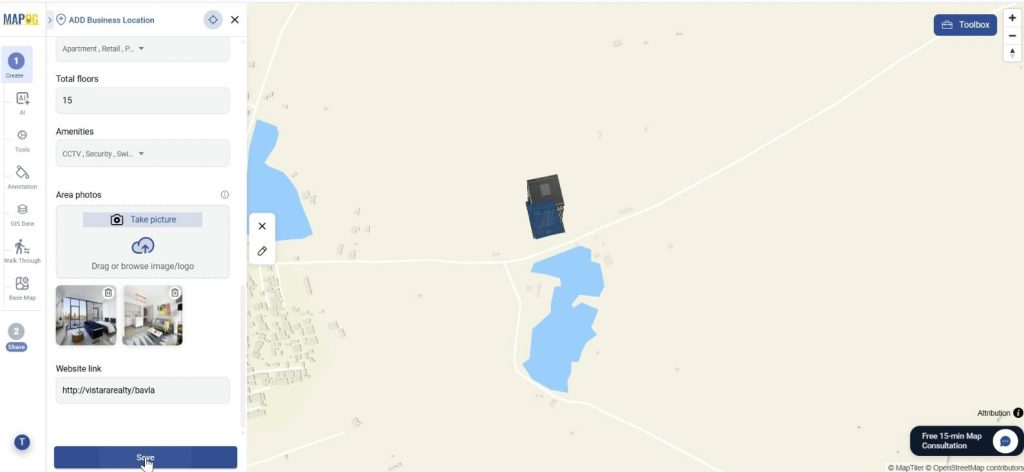
Step 4: Add nearby amenities
To make the map more informative, nearby amenities can also be added. Go to edit and click add nearby points.
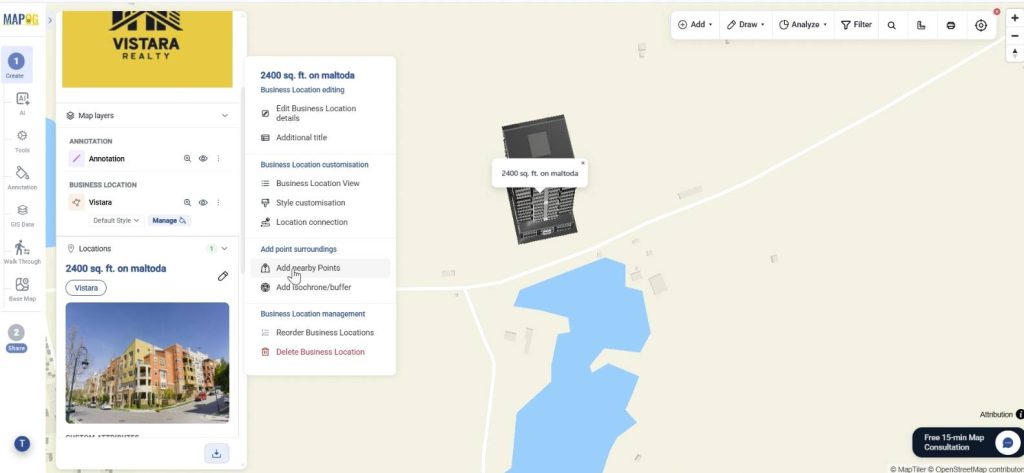
Search locations or place them manually and confirm. Add name and assign icons to points as well as calculate distance from location. Then save it.
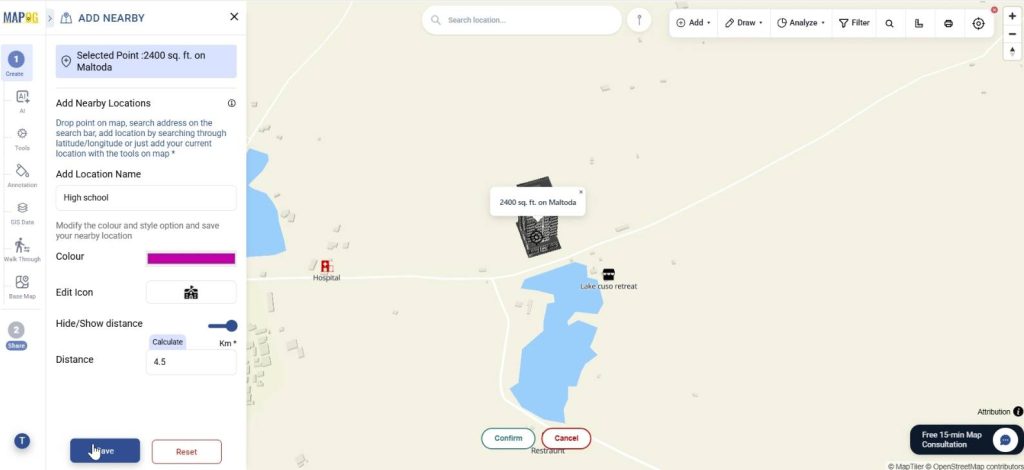
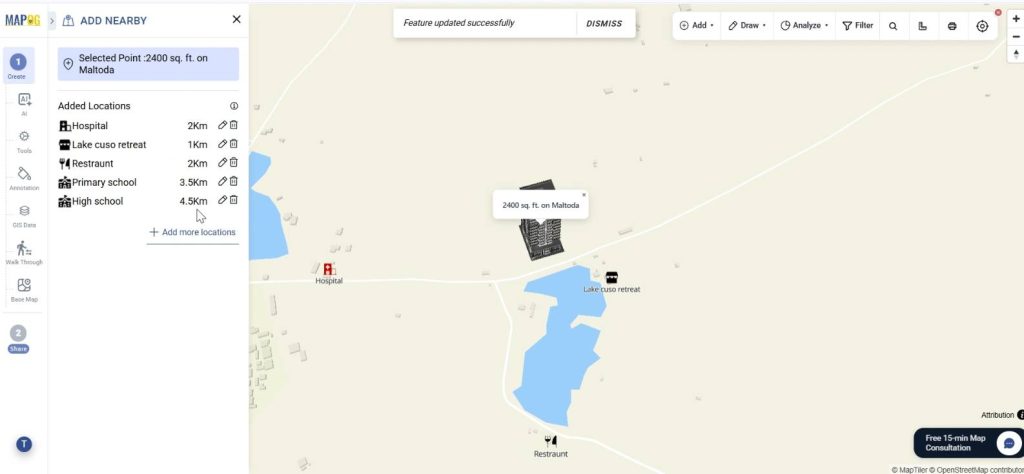
Like this add other nearby amenities also.
Step 5: BBOX settings & Call to action button
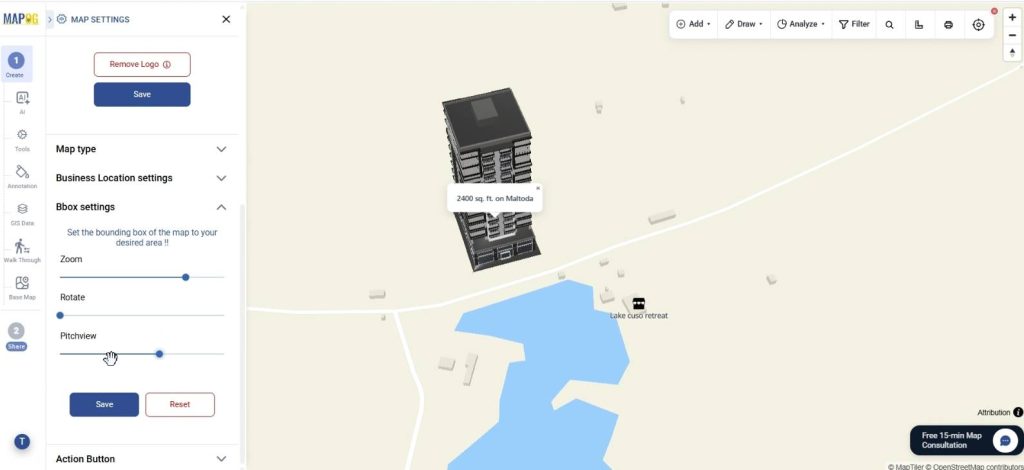
Refine the viewing experience, in map settings, using BBOX settings to control zoom, pitch, and map rotation.
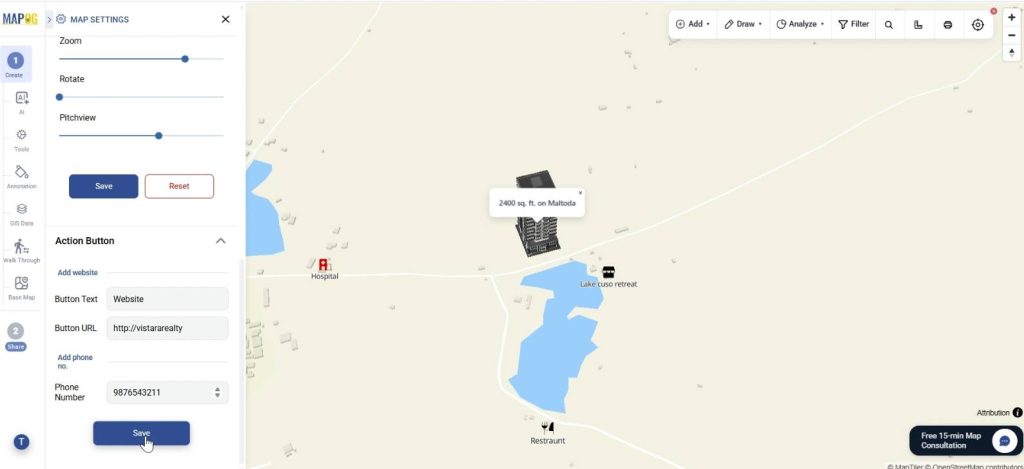
You can even add action buttons with website links and contact details so viewers can directly connect from the map itself.
Step 6: Preview and share
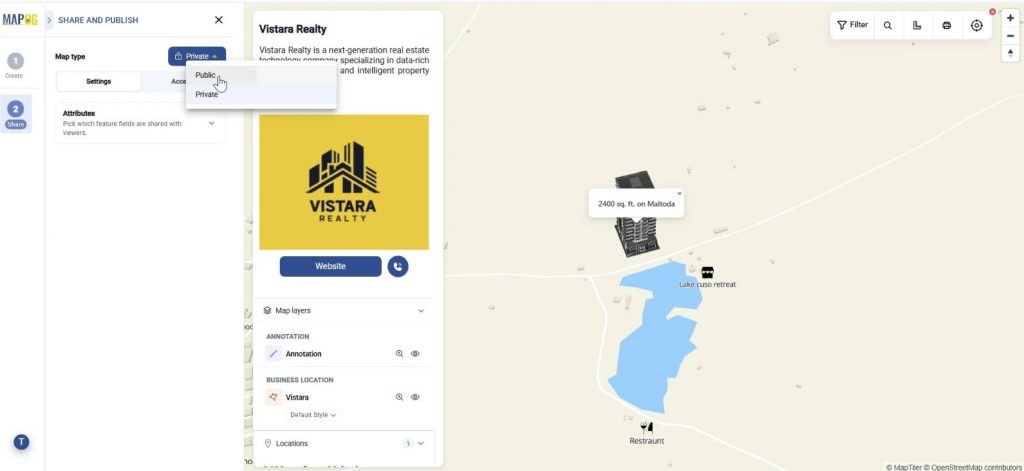
Finally, go to Preview and share. Set your map to private or public depending on your audience.
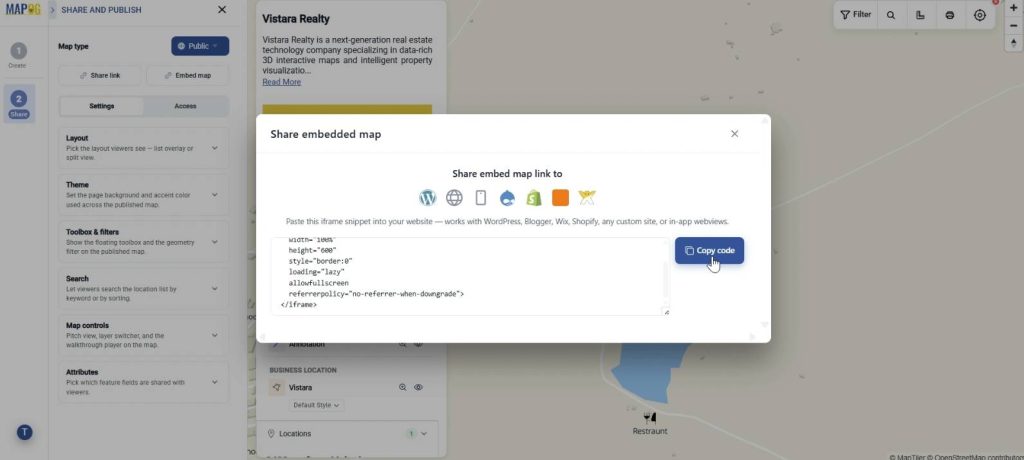
You can add users and assign roles for collaboration. Share via link or embed it on websites. From real estate showcases to urban infrastructure planning, data-rich 3D interactive maps make it easier to present, explore, and understand spaces with greater clarity and impact.
Industrial Benefits
Data-rich 3D interactive maps help industries make faster and more informed decisions by simplifying complex geographic data. In real estate, they improve property visualization and market analysis; in urban planning and infrastructure, they support better planning and resource management; while in logistics and smart city projects, they help optimize operations, monitor systems and improve overall efficiency through better spatial understanding.
Conclusion
Data-rich 3D interactive maps combine visualization, interactivity, and layered data to make complex geographic information easier to understand and use. From concept to real-world applications, they change how industries work with spatial data. By making information more visual and accessible, they support faster insights, better decisions, and improved outcomes across sectors.