In today’s fast-paced operational environment, managing on-ground activities across multiple locations can quickly become complex and inefficient when handled through disconnected tools. With MAPOG, organizations can centralize their planning and monitoring processes on a single interactive map. By Verify and Manage Field Data in real time, businesses gain better control, improved coordination, and faster response times, ensuring operations remain streamlined, transparent, and highly efficient.
Key Concept
Before starting factory infrastructure and section monitoring, organize facility details such as factory name, machinery status, maintenance schedules, and issue reports in an Excel or CSV file. Include coordinates and a Unique ID for each section to ensure accurate real-time tracking. When integrated with MAPOG Mobile Data Collection, this data supports live updates, inspection records, image uploads, and interactive map-based visualization for efficient factory monitoring and management.
Steps involves in Verify and Manage Field Data
Step 1 :Create and Upload Locations
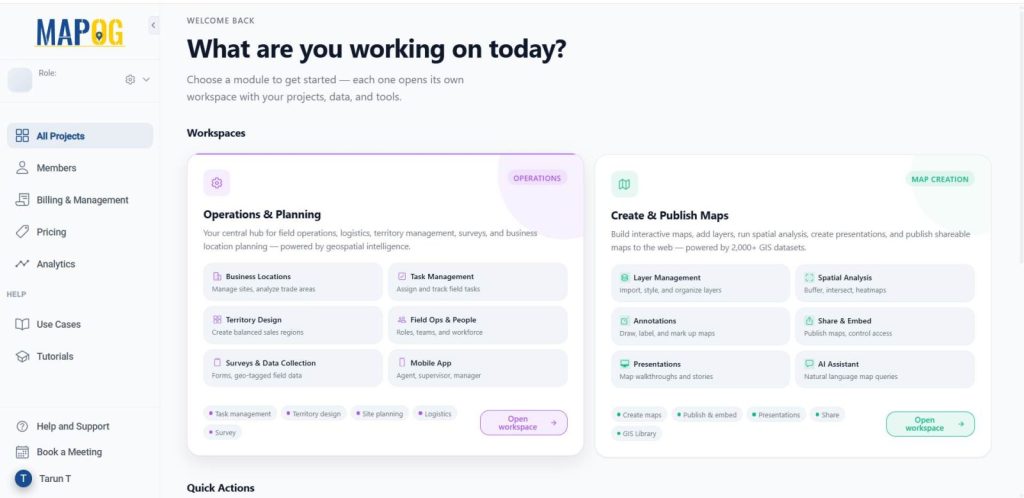
Open MAPOG, and click on Open Workspace in the Operations & Planning section — your central hub to manage field operations, logistics, surveys, and location planning in one place.
Now, open the Surveys & data section to access the feature built for structured, location-based data capture.
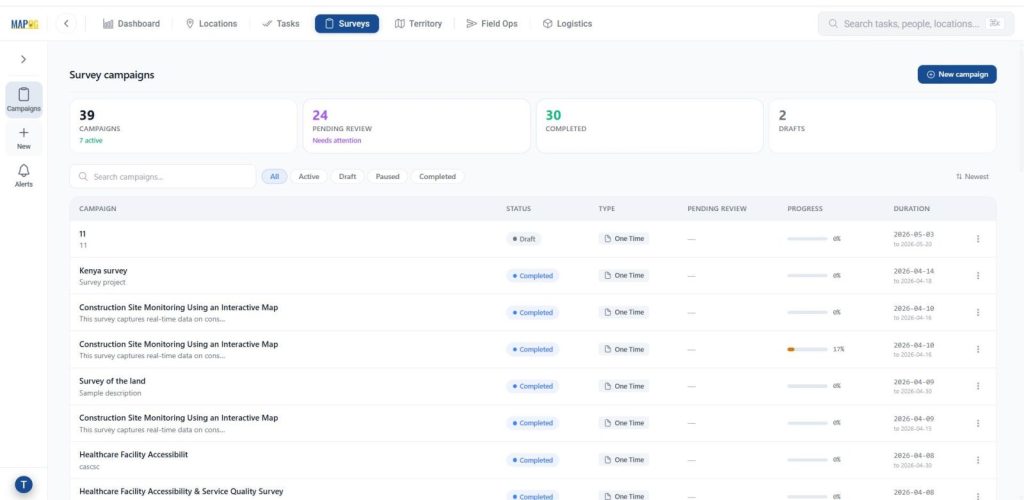
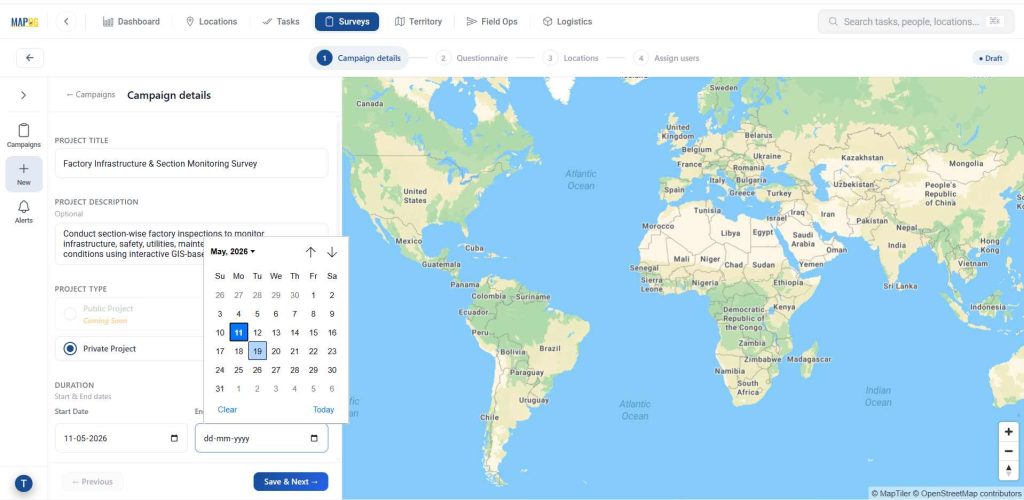
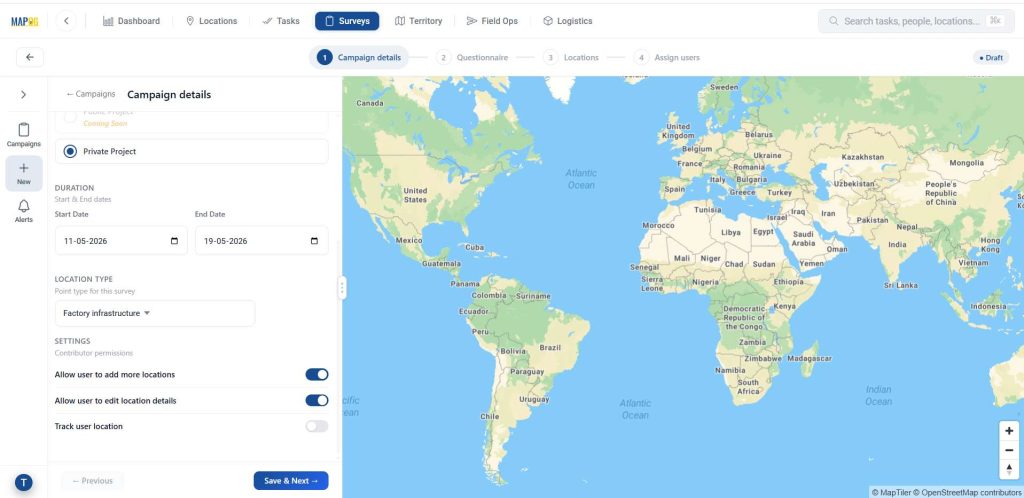
Then, click New Campaign and in the campaign details, Add project title and description and other basic details like project type, duration.
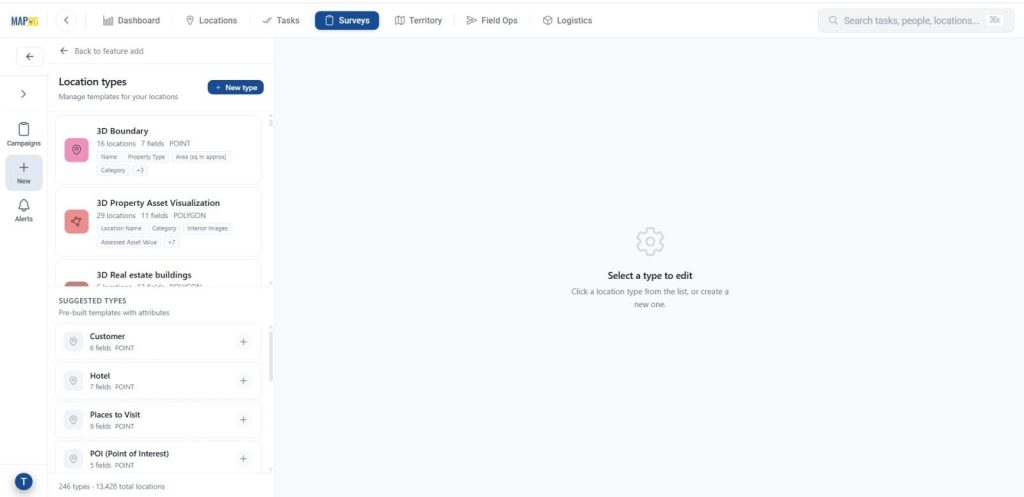
Go to Location type, and click on create new,
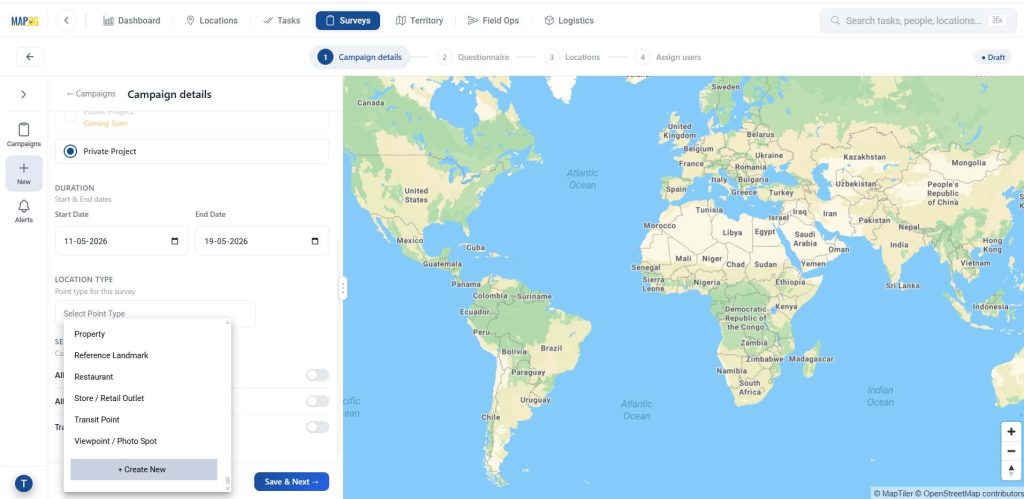
then give new type to create a new Business Location Template. This ensures consistency and reusability.
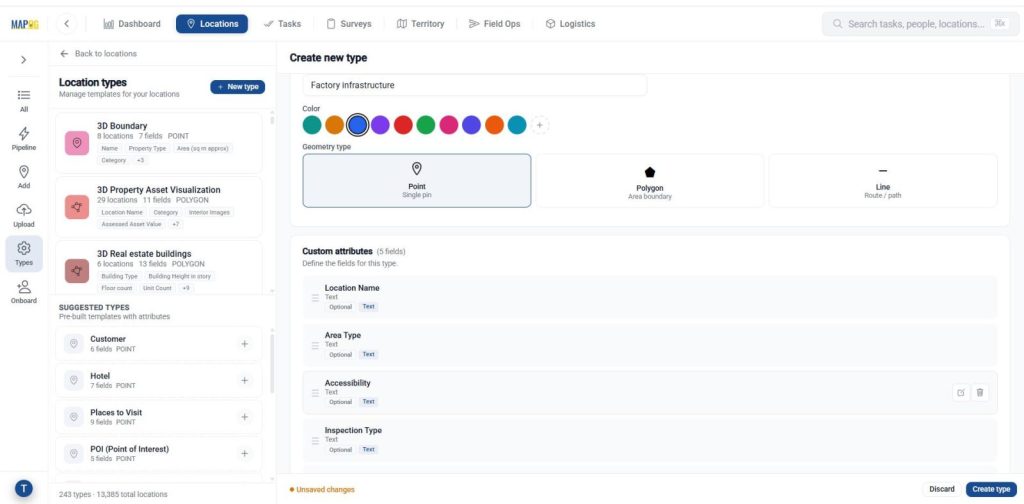
Give a name, assign a suitable colour and select geometry type as point.

Add attributes that define your point such as location name, accessibility, and date using text, number, dropdown, or multi-select fields based on the information you want to capture. Once configured, then click create type to save the template.
Once done, select the created location type from the drop down, then configure settings like Allow user to add more locations so field teams can capture new or missed sites on the go.
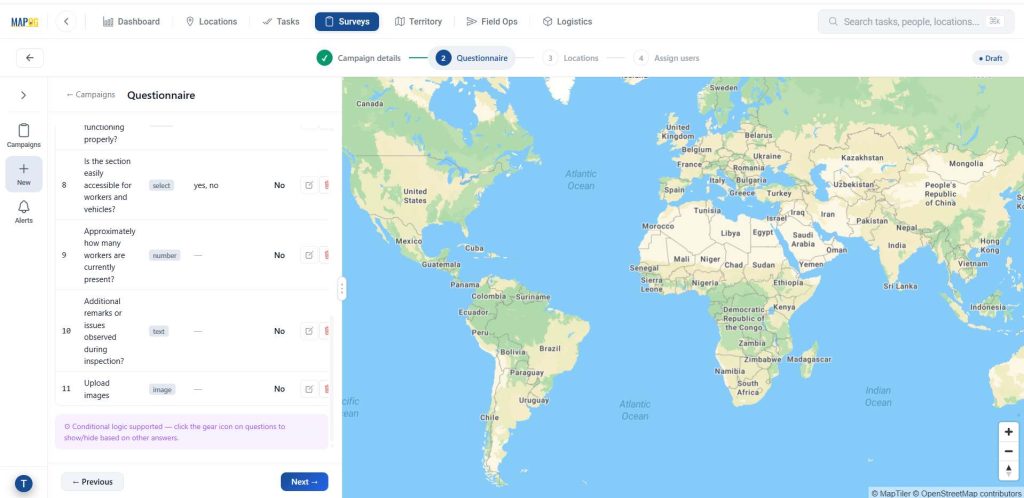
Step 2: Adding a Questionnaire
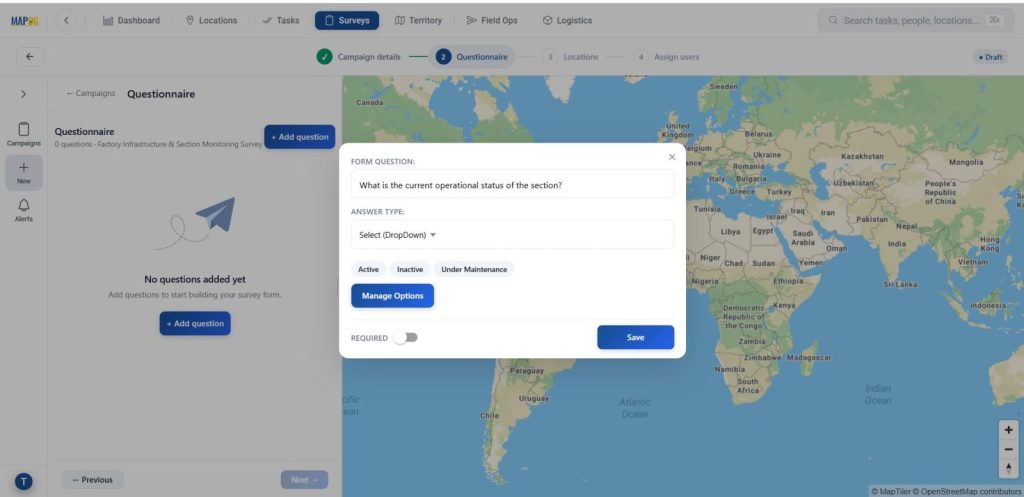
Add all the questions that seem relevant to the survey and add them one by one using the “add question” option. Add relevant questions using field types like text, select, multiselect, and image. To add options, use the Manage Options feature.
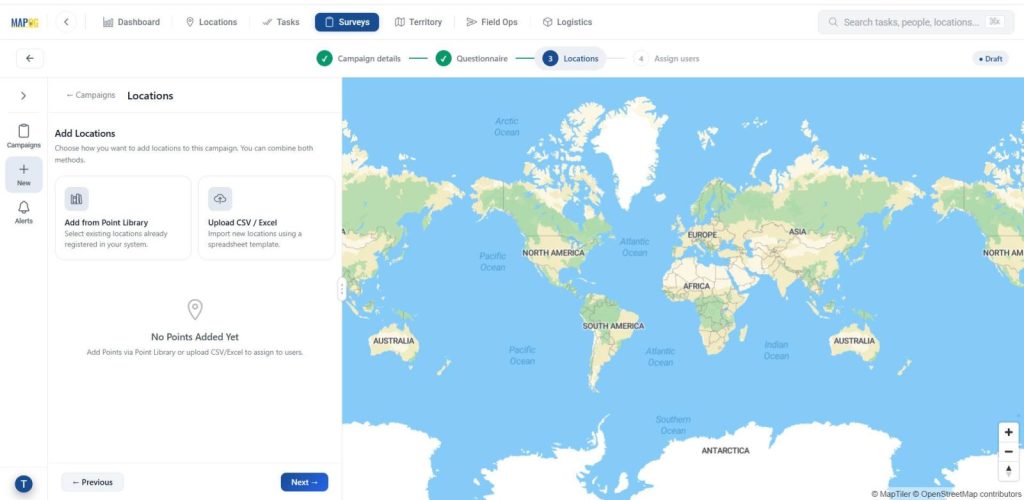
Step 3: Add New Locations
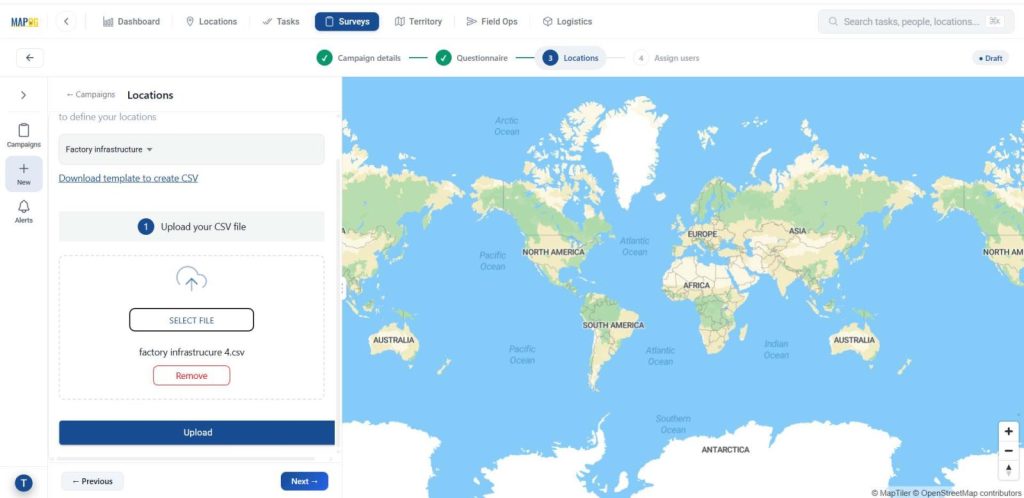
Now, in step 3, go to the locations’ & select upload CSV/Excel. The point type is already selected, just add your csv/excel file using upload csv/excel.
Make sure to set a Unique ID, this helps in proper data handling by identifying each location uniquely and managing updates efficiently.
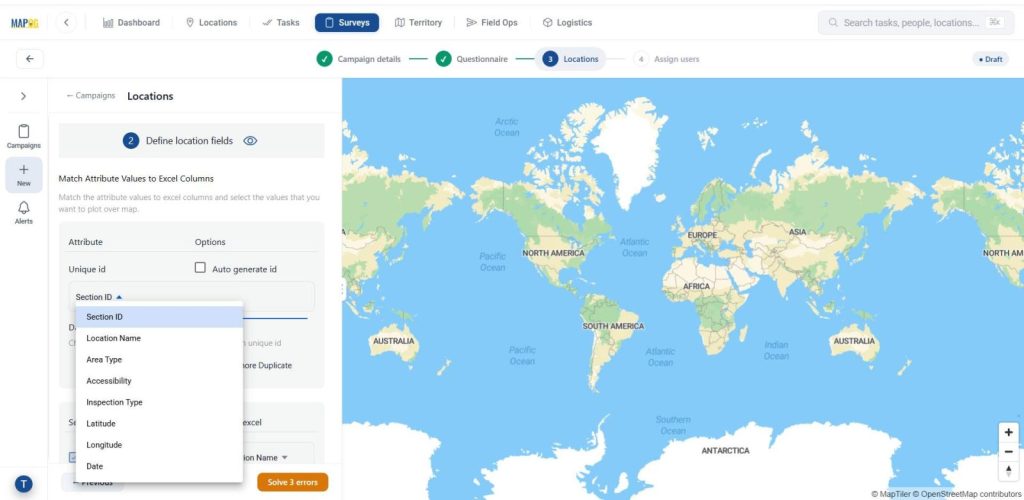
Then, match the excel columns to the attributes and submit. Further, match the coordinates to their excel values.
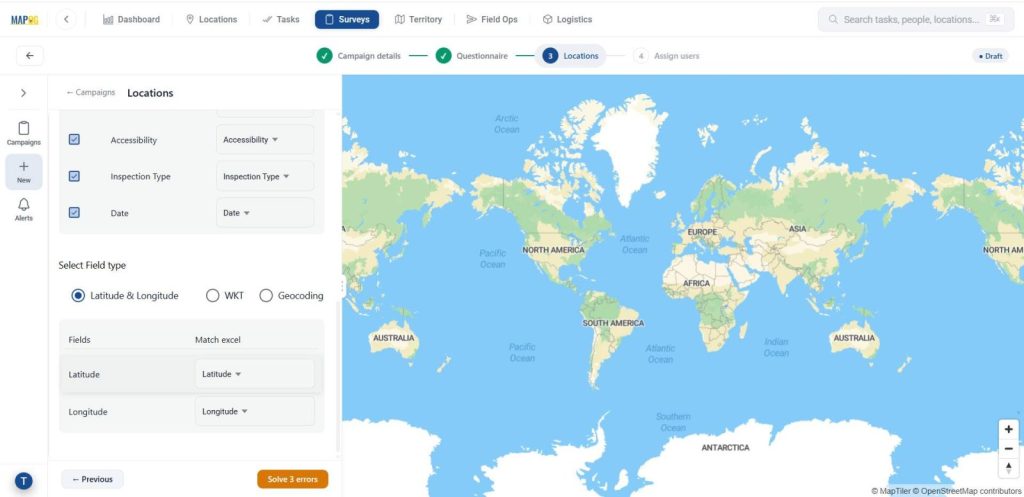
Your data will now come alive on the map.
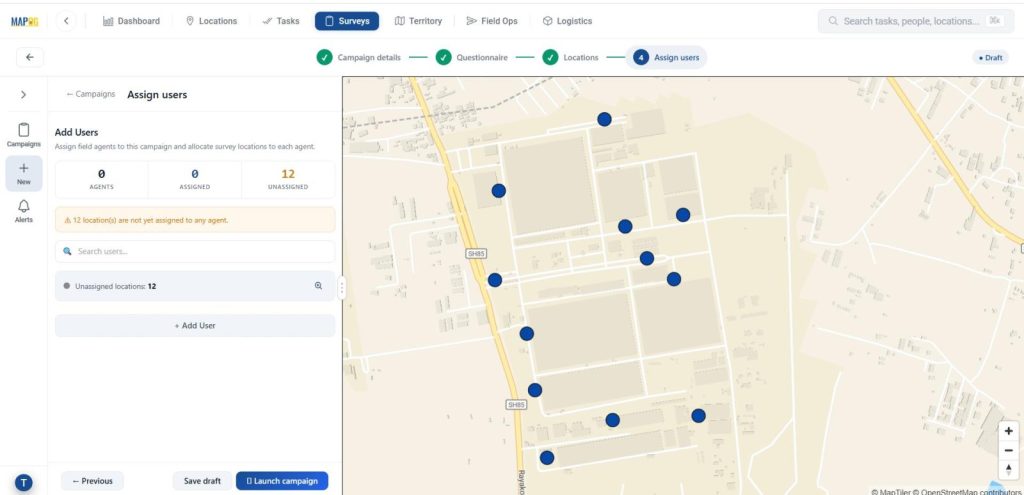
Step 4: Add users
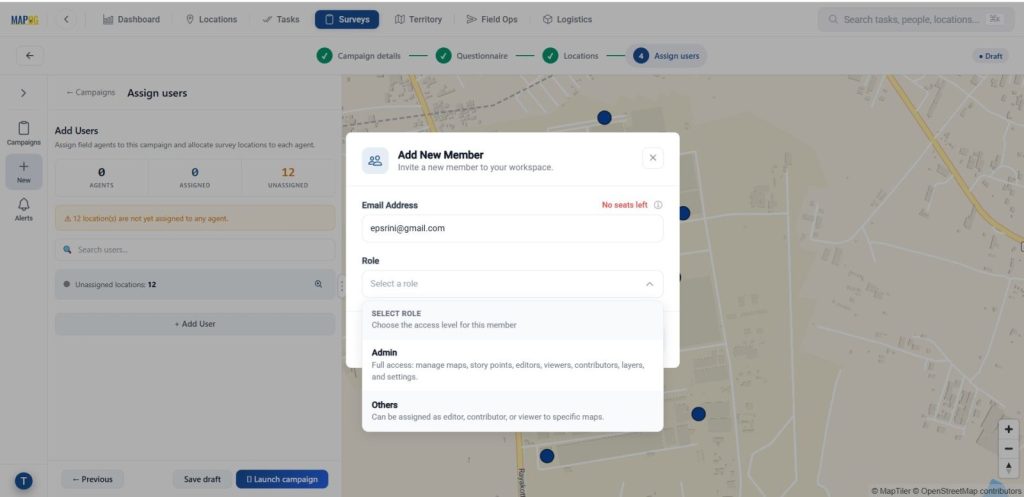
Next step add assignees for the task using the ‘Add user’ option. You can add new members using the ‘Add Members’ option and adding their email address and choose the role as admin or other users.
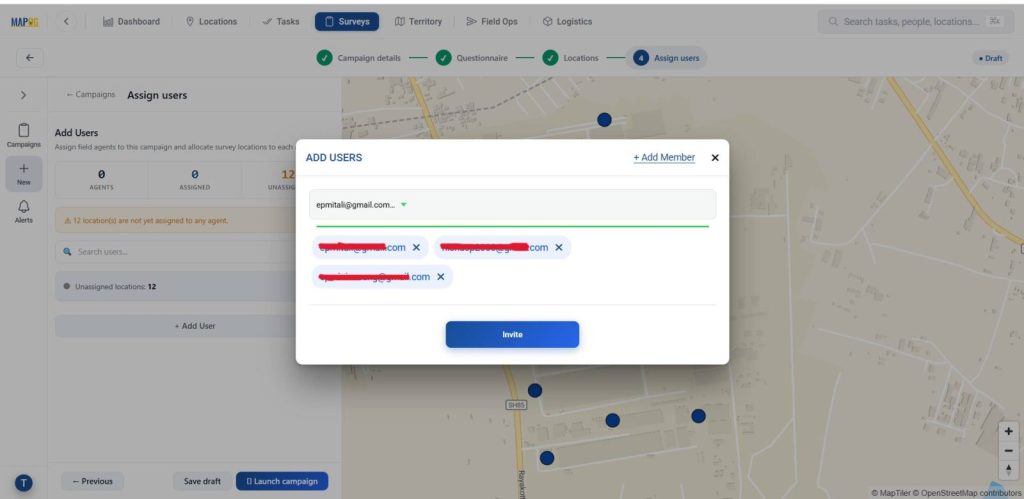
Thereafter, you can select the members and invite them as users.
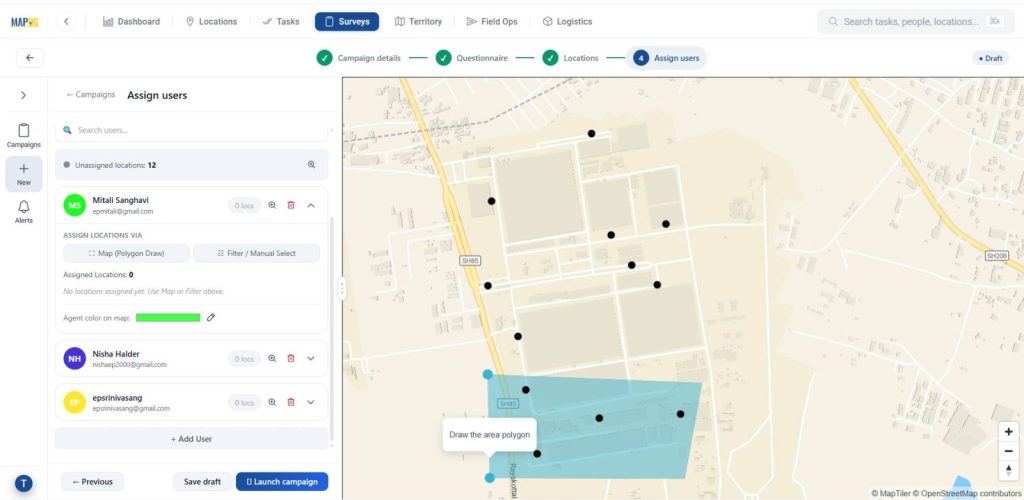
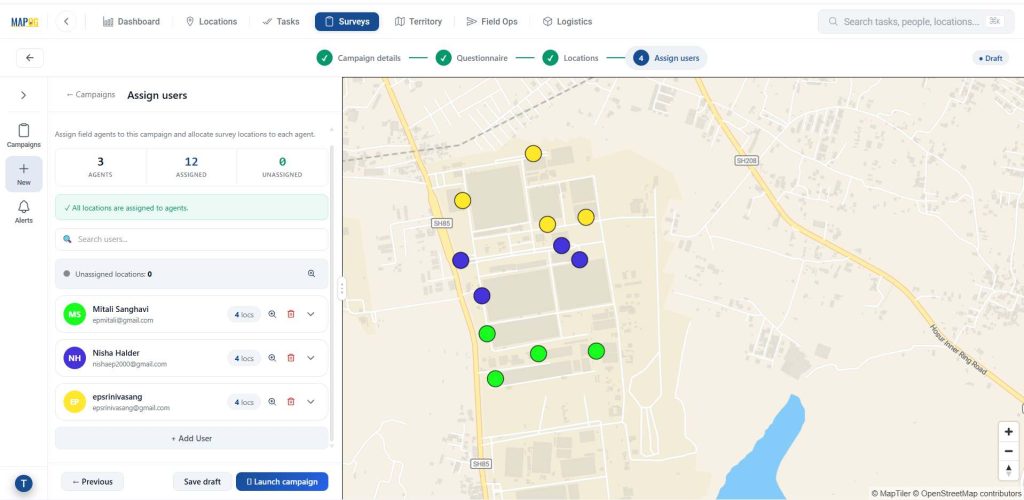
Then, assign each user a particular area by selecting the map option and drawing out a polygon for the particular area & conforming it.
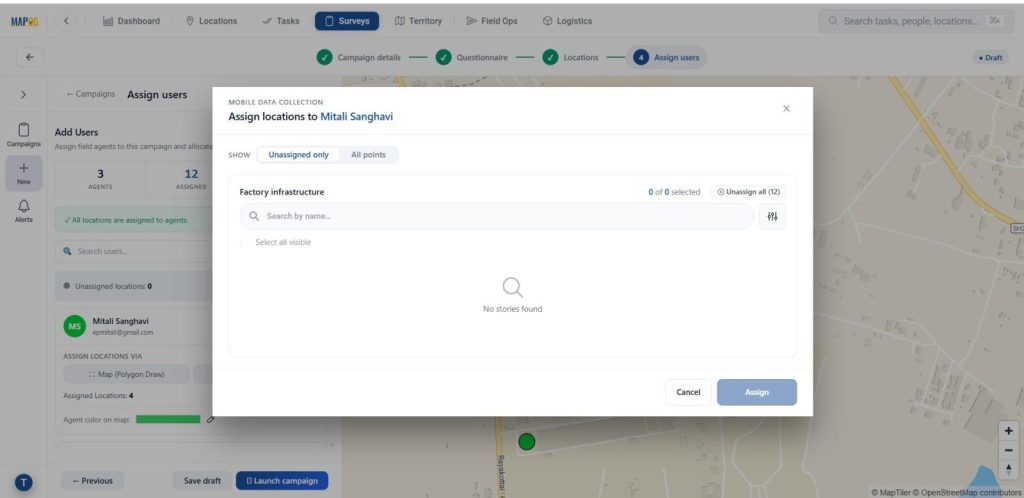
Optionally, you can use the filter option to assign users from unassigned or all points.
Step 5: Launching the survey
You can start the survey anytime by pressing the launch campagin.
Step 6: Mobile data collection
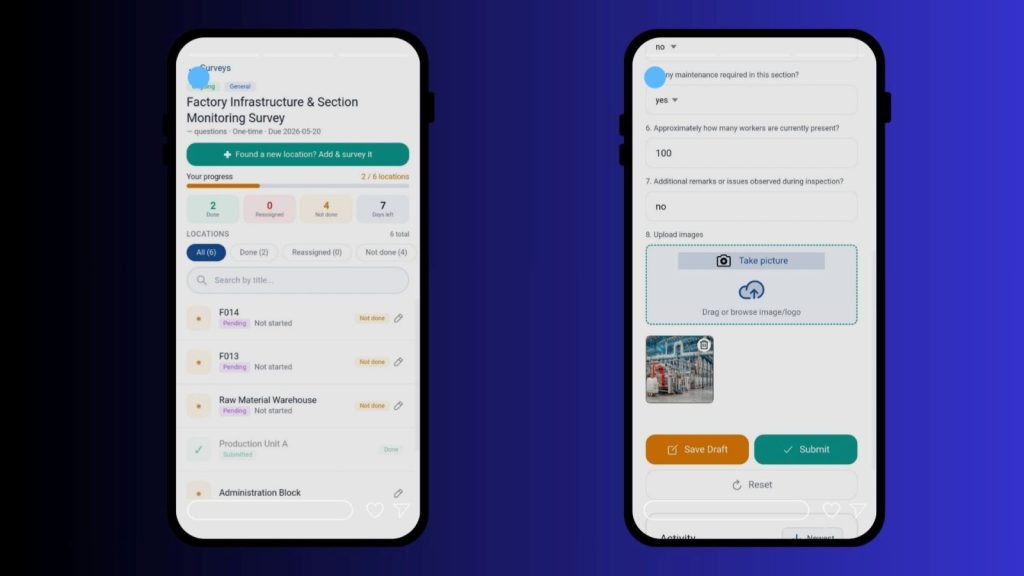
Further, the assigned users can see the locations assigned to them from the MAPOG contributor application in their personal devices. Add new locations, using the +Found a new location option and fill their title or description and optionally add images for clarity.
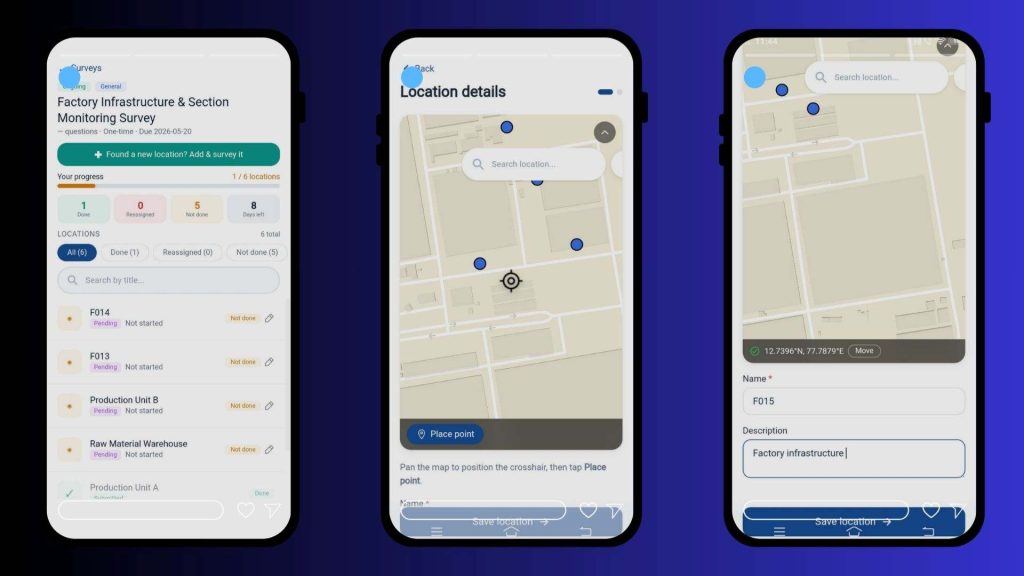
They can thereafter, fill out the surveys accordingly and collect data from their devices. There is an option in the survey to either save draft, submit or reset it.
8. Review Responses
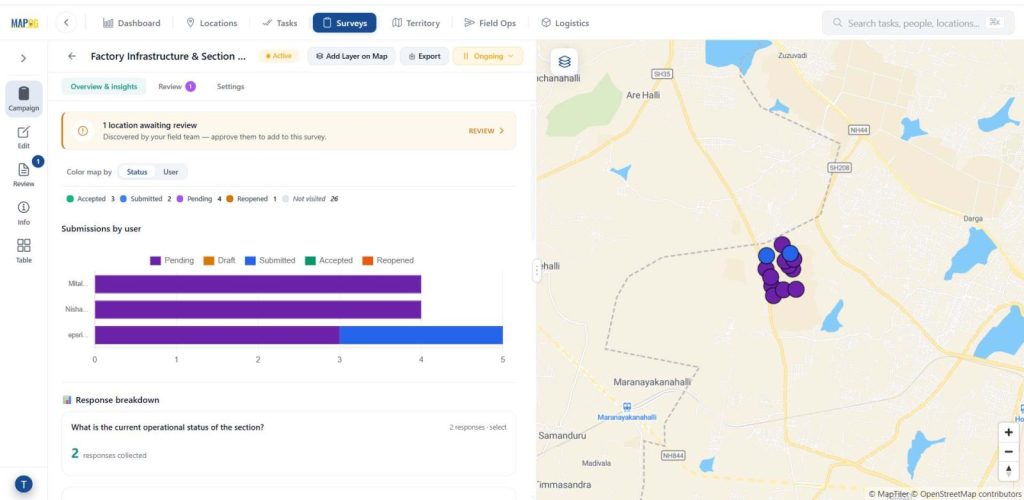
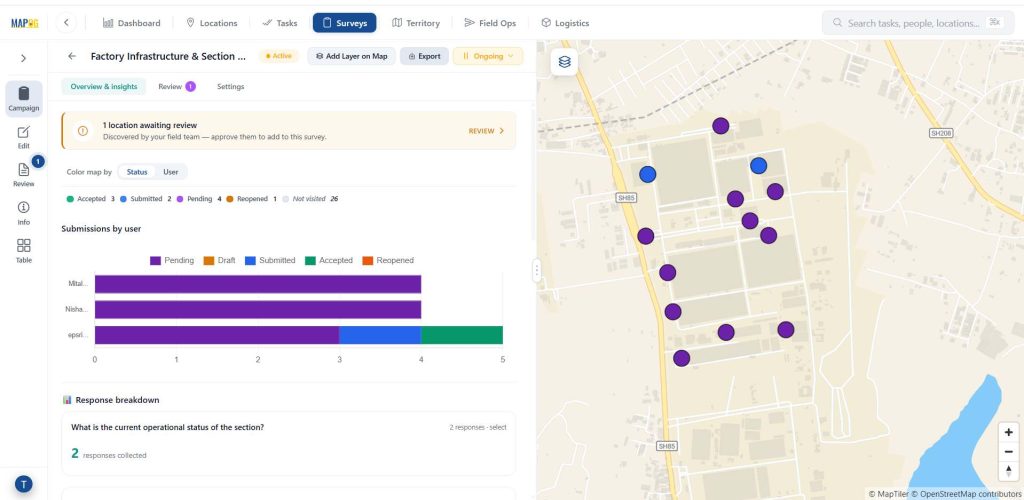
Subsequently, in the Overview dashboard, view and filter responses by status or contributor to quickly track progress and identify pending or completed entries.
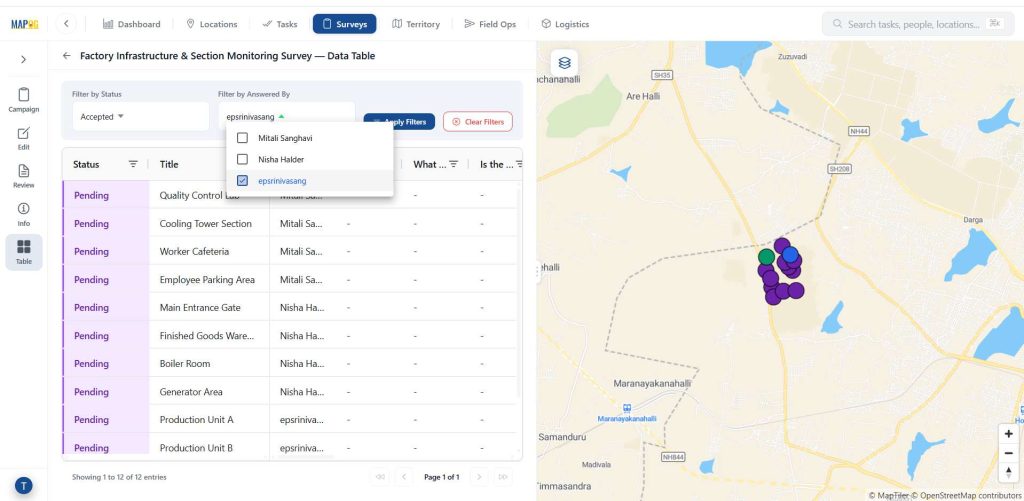
Finally, click on the data table and you can see your data filtered by status, answered by.
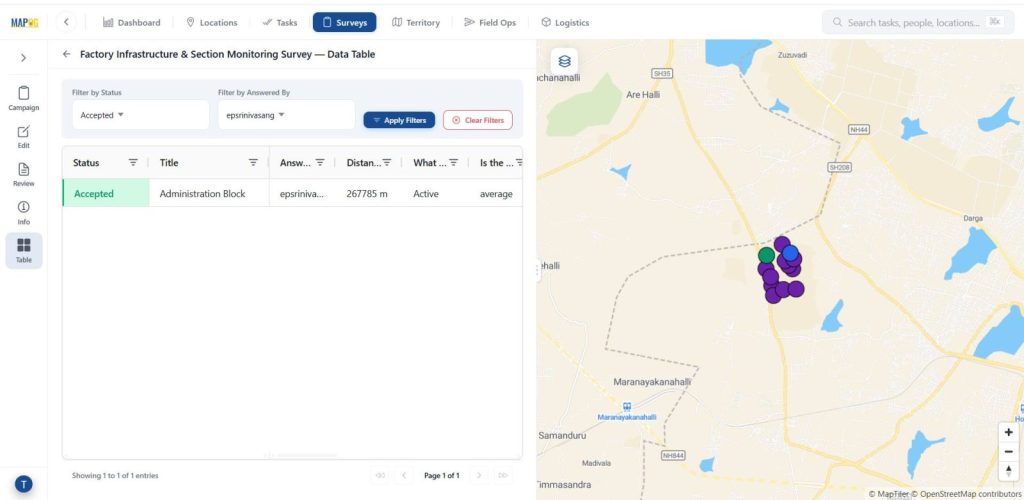
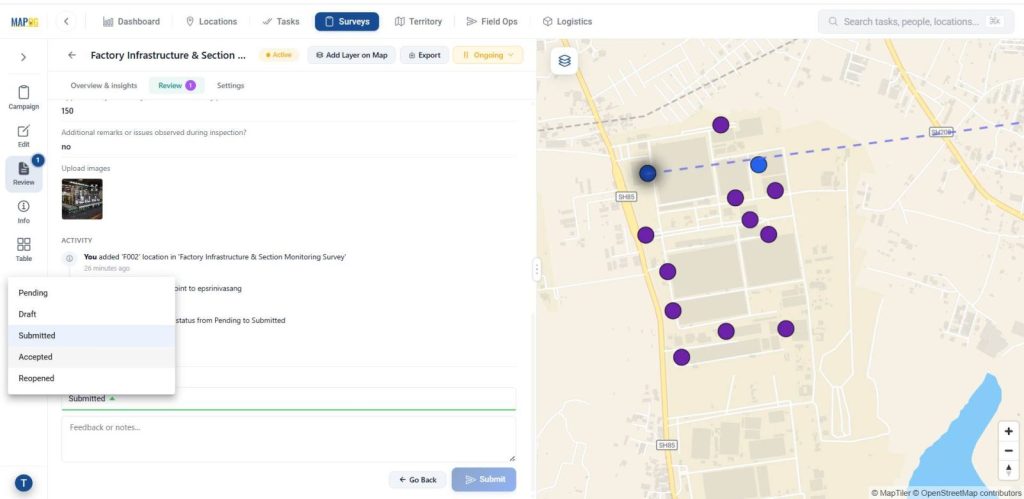
Then, review survey responses and accept, reject, or reopen entries to ensure data accuracy and maintain quality control.
9. Export and Integrate Data
Next, use the export option to download responses as a CSV file so the data can be shared or archived externally.
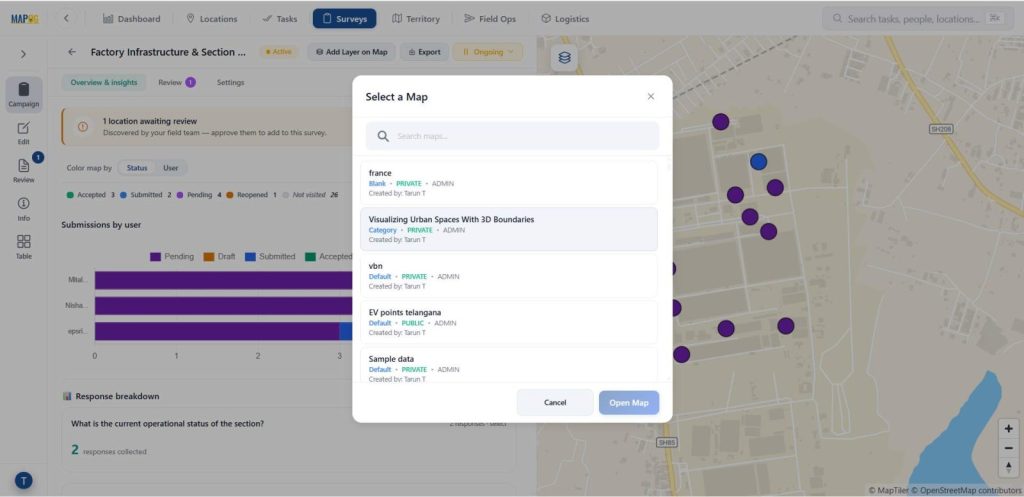
Finally, use Add Layer on Map to create a new map or open the survey in an existing one. It allowing you to visualize and integrate results into broader projects.
Industrial use and benefits of Verify and Manage Field Data
Mobile data collection apps help industries capture real-time, location-based data for inspections, surveys, audits, and maintenance. They reduce paperwork, improve accuracy, boost productivity, and support better decision-making.
Conclusion
Mobile data collection apps enable accurate, real-time capture of on-ground information by linking every record to a verified location. With MAPOG, organizations can centrally manage field data while ensuring GPS-based validation, full area coverage, and minimal duplication.
Mapog contributor app link:
Here are topics related to this topic: