In today’s fast-paced, connected world, dynamic maps have become essential tools for navigating both everyday life and complex journeys. Unlike traditional static maps, dynamic maps are interactive and responsive i.e. they allow users to zoom, pan, click for details, and customize views with layers or markers. From urban planning to planning efficient routes, these digital maps turn raw data into intuitive visuals. Whether you’re organizing a quick weekend getaway or managing logistics for a larger trip, you can make dynamic maps with the help of MAPOG.
Key concept of Dynamic map
The core concept of dynamic mapping is data integration and user interactivity. Dynamic maps pull in information and display it in a way that’s useful and easy to understand. Users can interact with the map by applying filters, adjusting routes and adding personalized markers, making it highly adaptable to specific needs. This flexibility transforms the map from a passive guide into an active decision-making tool, whether it’s used for travel planning, logistics, or data analysis. In essence, it empowers users to engage with geographic data in a more meaningful, responsive, and actionable way.
Step-by-step method of creating a dynamic map
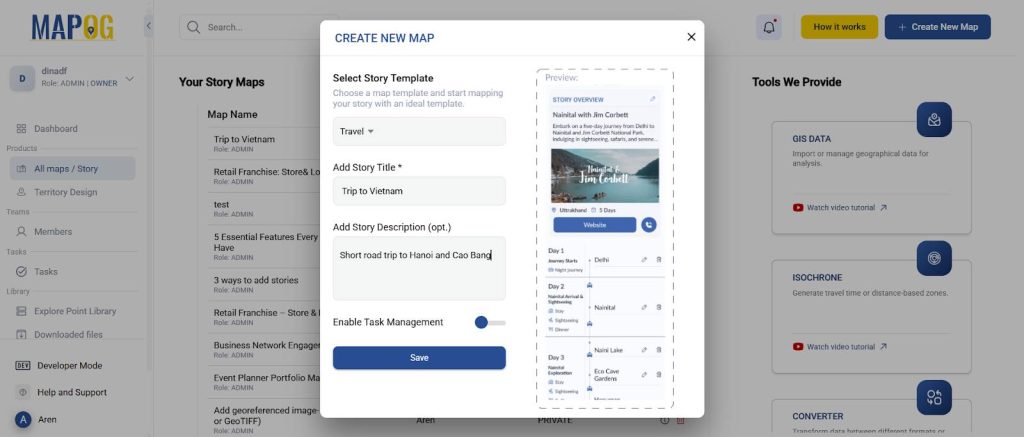
Step 1: Create the map
Go to MAPOG and create a new map. Select the story template as ‘Travel’ and add story title and description and save.
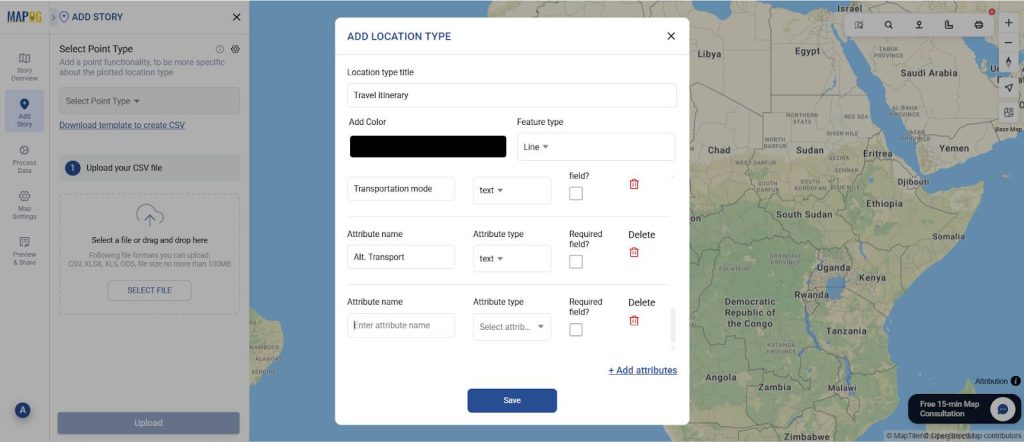
Step 2: Uploading your data and adding attributes
Now, go to add story and select add by uploading excel/CSV. Go to ‘Select point type’ settings and add your location type along with necessary attributes like address, transport, etc & set it as point. Select the point type that you created and upload your excel file with all the details.
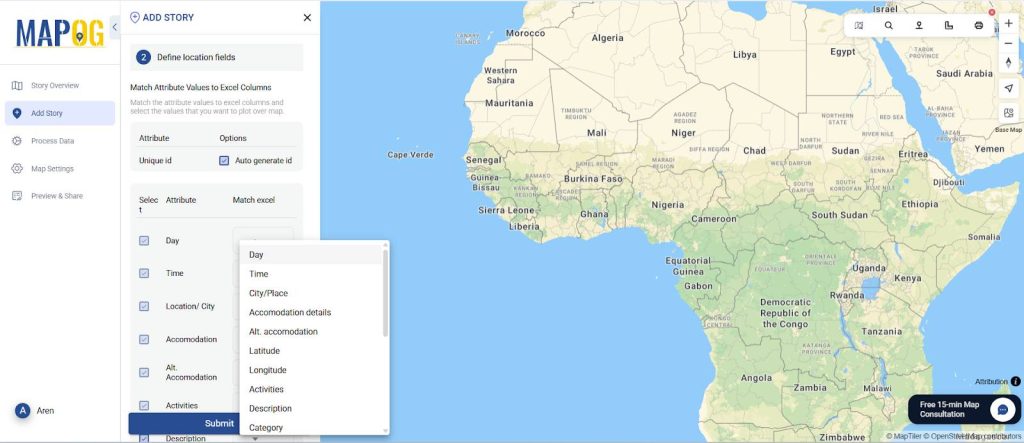
Now, match excel with the attributes including coordinates in location fields and submit. Your data will now come alive on the map.
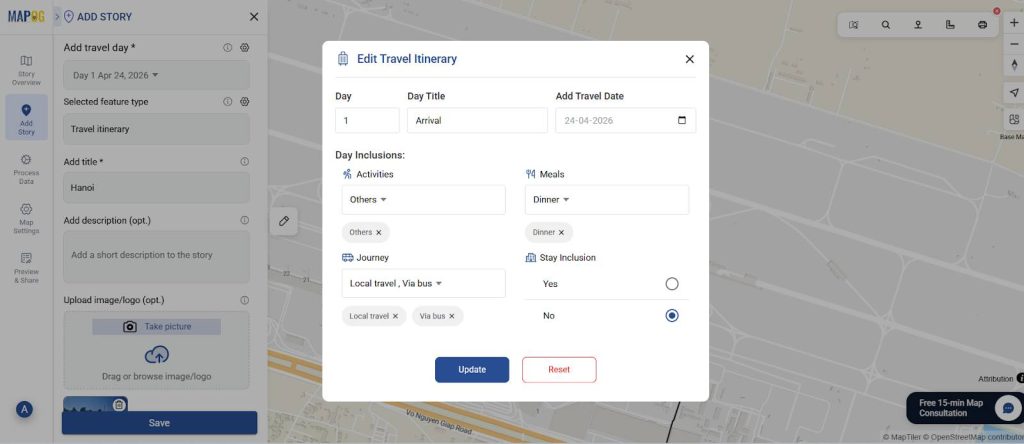
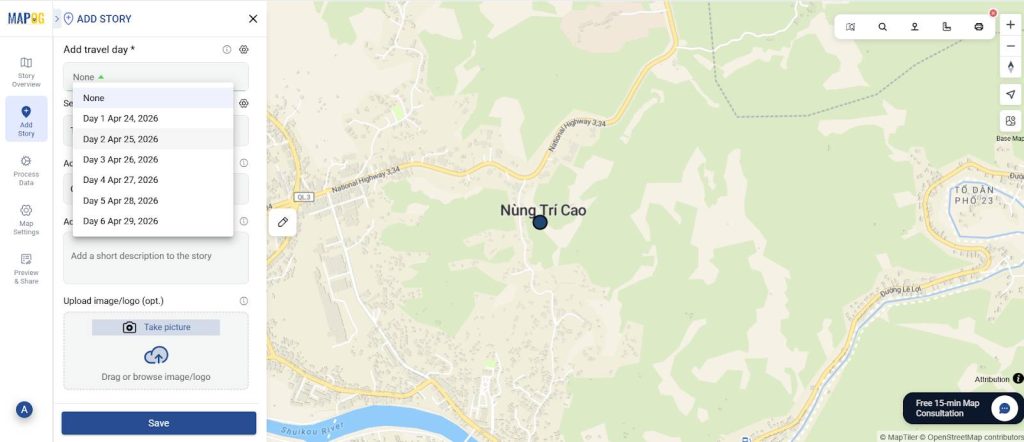
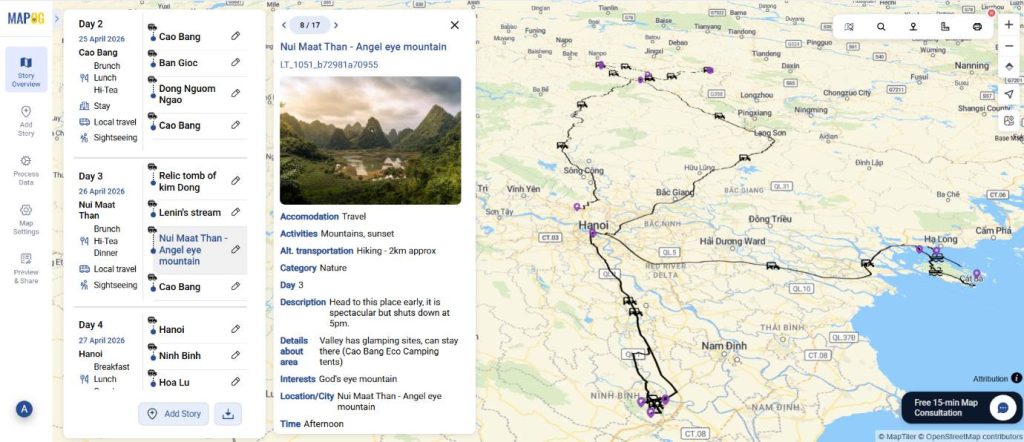
Step 3: Customize your itinerary details
Go to your location and select ‘Edit point details’.
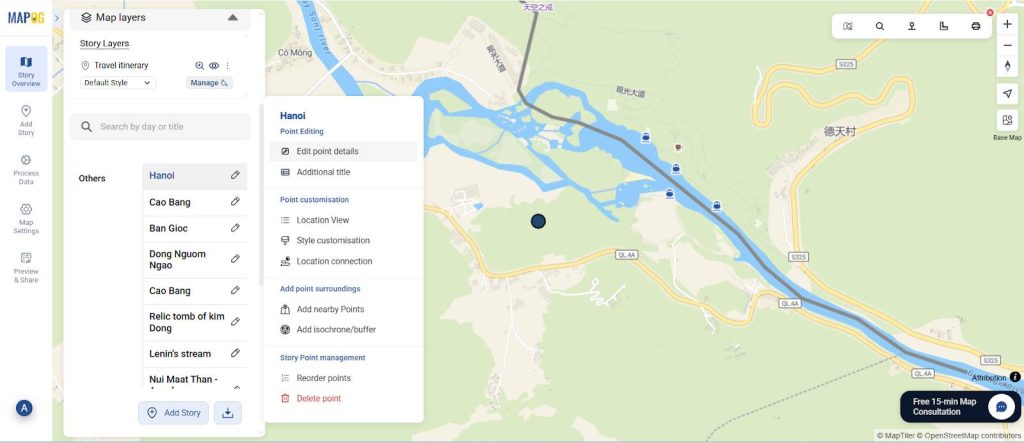
In the add travel day settings, add all the details in your travel itinerary, including all the days and inclusions related to that and save the information.
Step 4: Match the travel day to your place
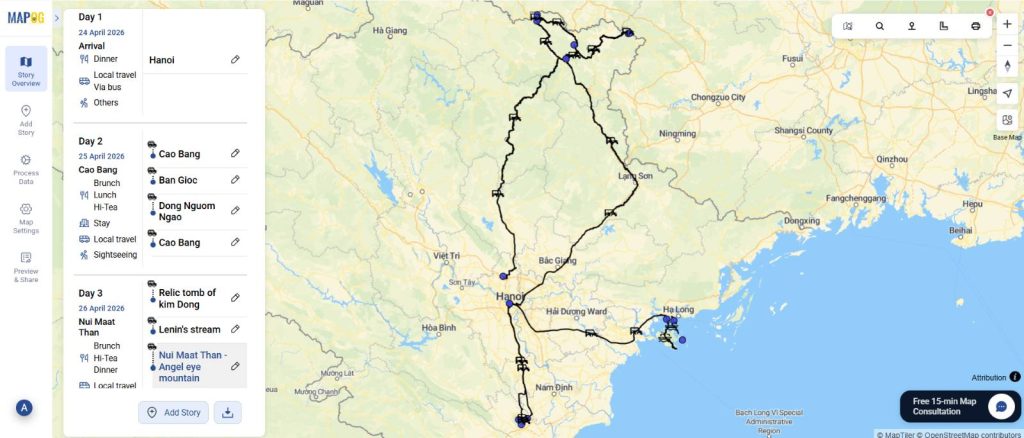
Add the travel day to your particular place and customize each point to add your travel itinerary to your liking. Optionally, you can upload images for clarity and save the point.
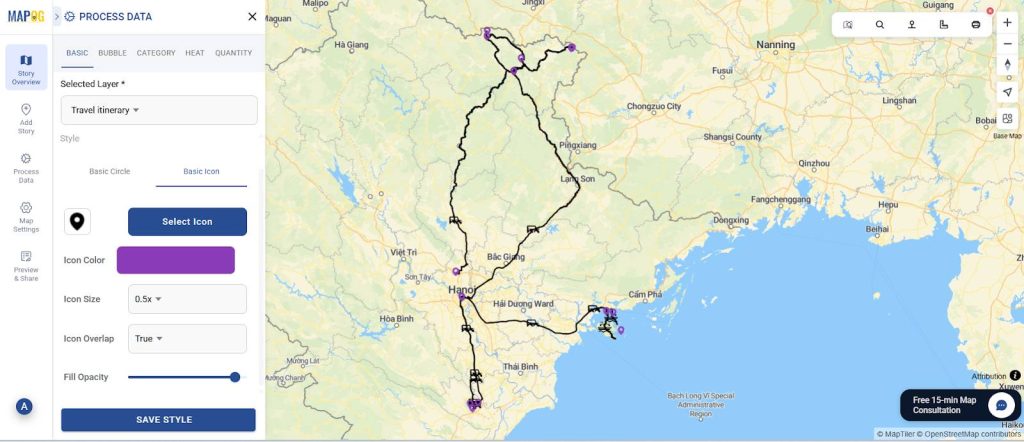
Step 5: Connect all the locations
Next, use the location connection tool to connect all the points via road or as straight lines. You can choose any icon to represent the mode of your travel. Do this for all the points that you want to connect.
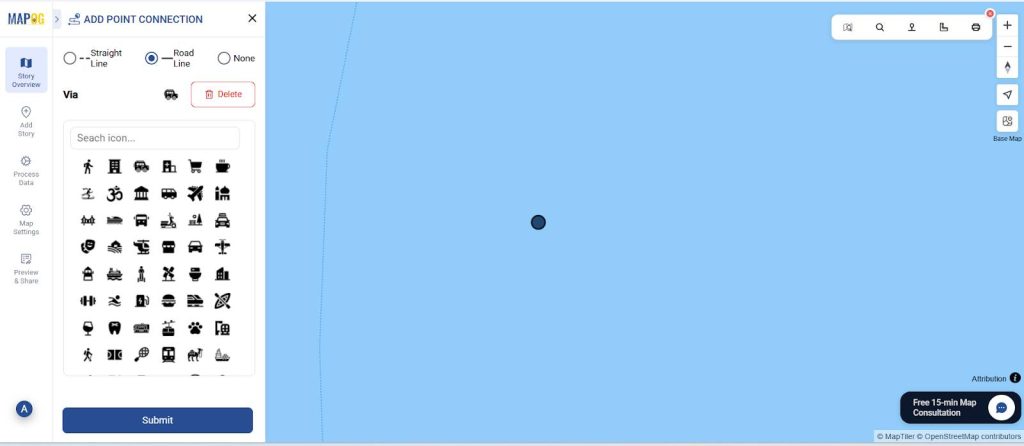
And then all of your points will be connected.
Step 6: Customize your points
After that, you can customize all the points in your layer. Go to Add layer style and proceed to style icons on your map.
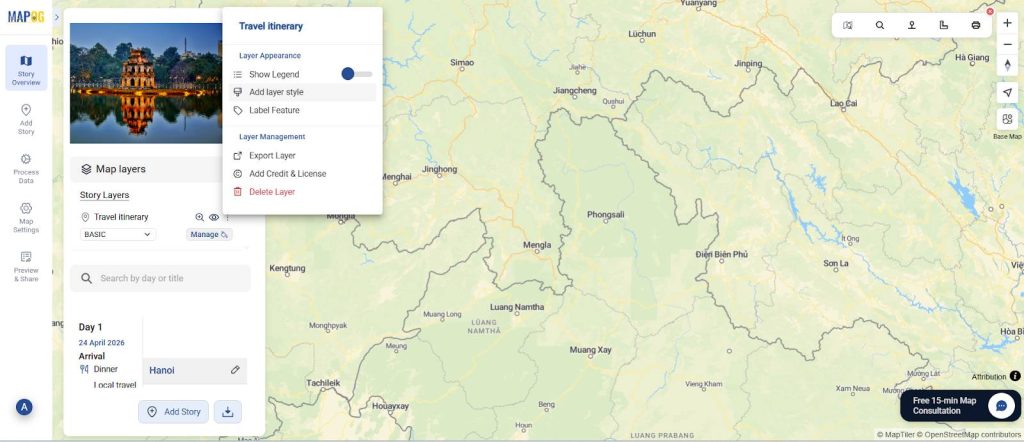
You can choose any icon or colour of your choices shown below.
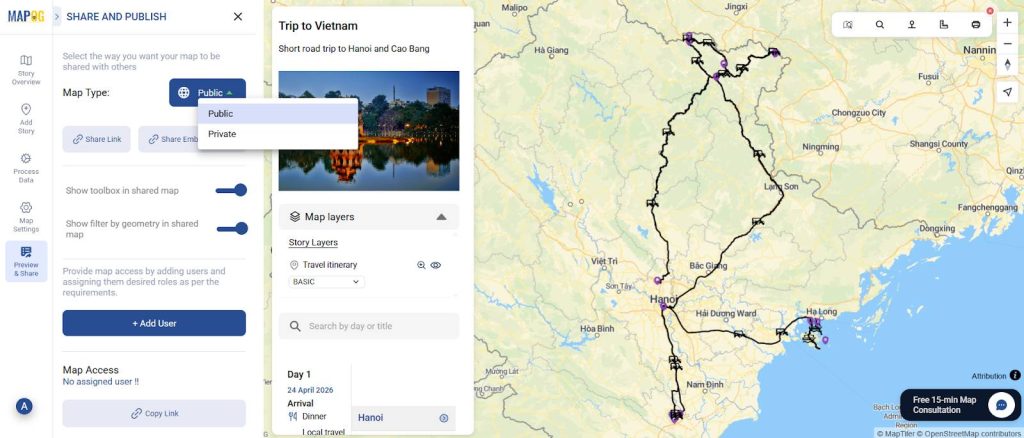
Step 7: Preview and publish your dynamic map
Finally, once your itinerary is complete, click “Preview and Share”. This will generate a public link you can send to anyone whether it’s your travel group, family, or social media.
Industrial use and benefits of a dynamic map
Dynamic maps help visualize information using customizable icons and layers therefore making it easier to identify patterns, track progress, and uncover opportunities for improvement. They offer a powerful way to transform complex data into clear, interactive visuals that support smarter decision-making across various industries. For example, in the travel industry, dynamic mapping can be used to create interactive itineraries that display travel routes, accommodation options, and key attractions. Dynamic mapping boosts clarity, engages users, and aids strategic planning for both companies and customers.
Conclusion
Finally, a dynamic map stands out as an ideal solution for turning data into actionable insights. Its ability to visually represent complex information with customizable icons, colors, and layers makes it highly effective across various sectors like retail analysis, logistics, or travel industry. MAPOG not only enhances decision-making and operational efficiency but also improves user experience through clear, interactive maps.