To begin with, Color-Code Map Points is a simple yet powerful way to transform raw data into clear, visual insights. Moreover, this approach enables governments, planners, and communities to classify projects, services, or assets into instantly understandable categories on a single interactive map. As a result, we can instantly track and visualize metro stations in the real world creating a color-coded progress map without coding using MAPOG.
Key Concept: Interactive Color-Code Map Points
- In particular, project or service locations can be mapped.
- Additionally, layers can be added for categories like Completed, Ongoing, and Faulty.
- Therefore, red highlights issues, yellow shows progress, and green signals success.
What is Color-Coded Map?
Color-Coded Mapping uses GIS to visualize data by assigning different colors to represent categories, statuses, or conditions of map points. Instead of displaying raw numbers or text, it organizes information visually, allowing users to understand complex datasets at a glance.
Identifies
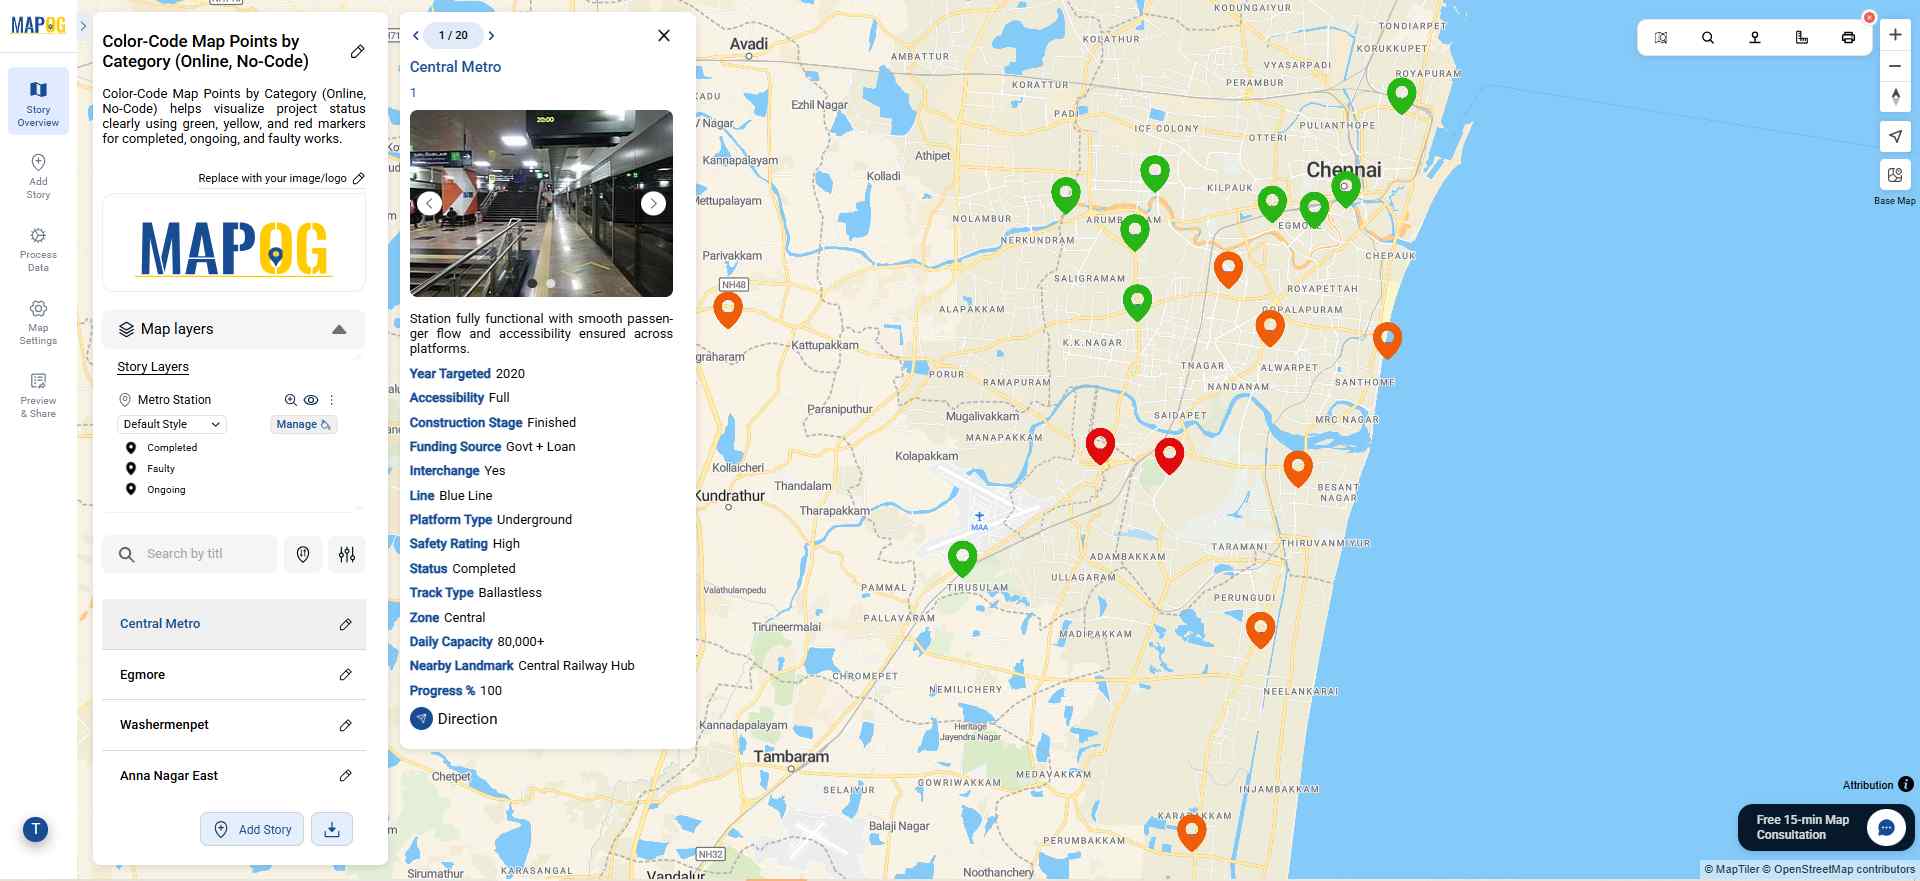
- Specifically, 🟢 Completed Projects (Green): fully operational.
- Meanwhile,🟠 Ongoing Projects (orange): construction in progress.
- On the other hand, 🔴 Faulty Projects (Red): having technical/structural issues.
Uses of Color-Code Map Points with GIS
- Government Dashboards: Authorities can build live dashboards to track project progress, budgets, and timelines with instant clarity.
- Planning & Prioritization: Planners can identify delays or problem areas quickly, allowing smarter allocation of funds and resources visualizing through color coded icons.
- Cross-Sector Applications: Useful for monitoring transport, schools, healthcare, utilities, and disaster management projects.
Style Layer as Category
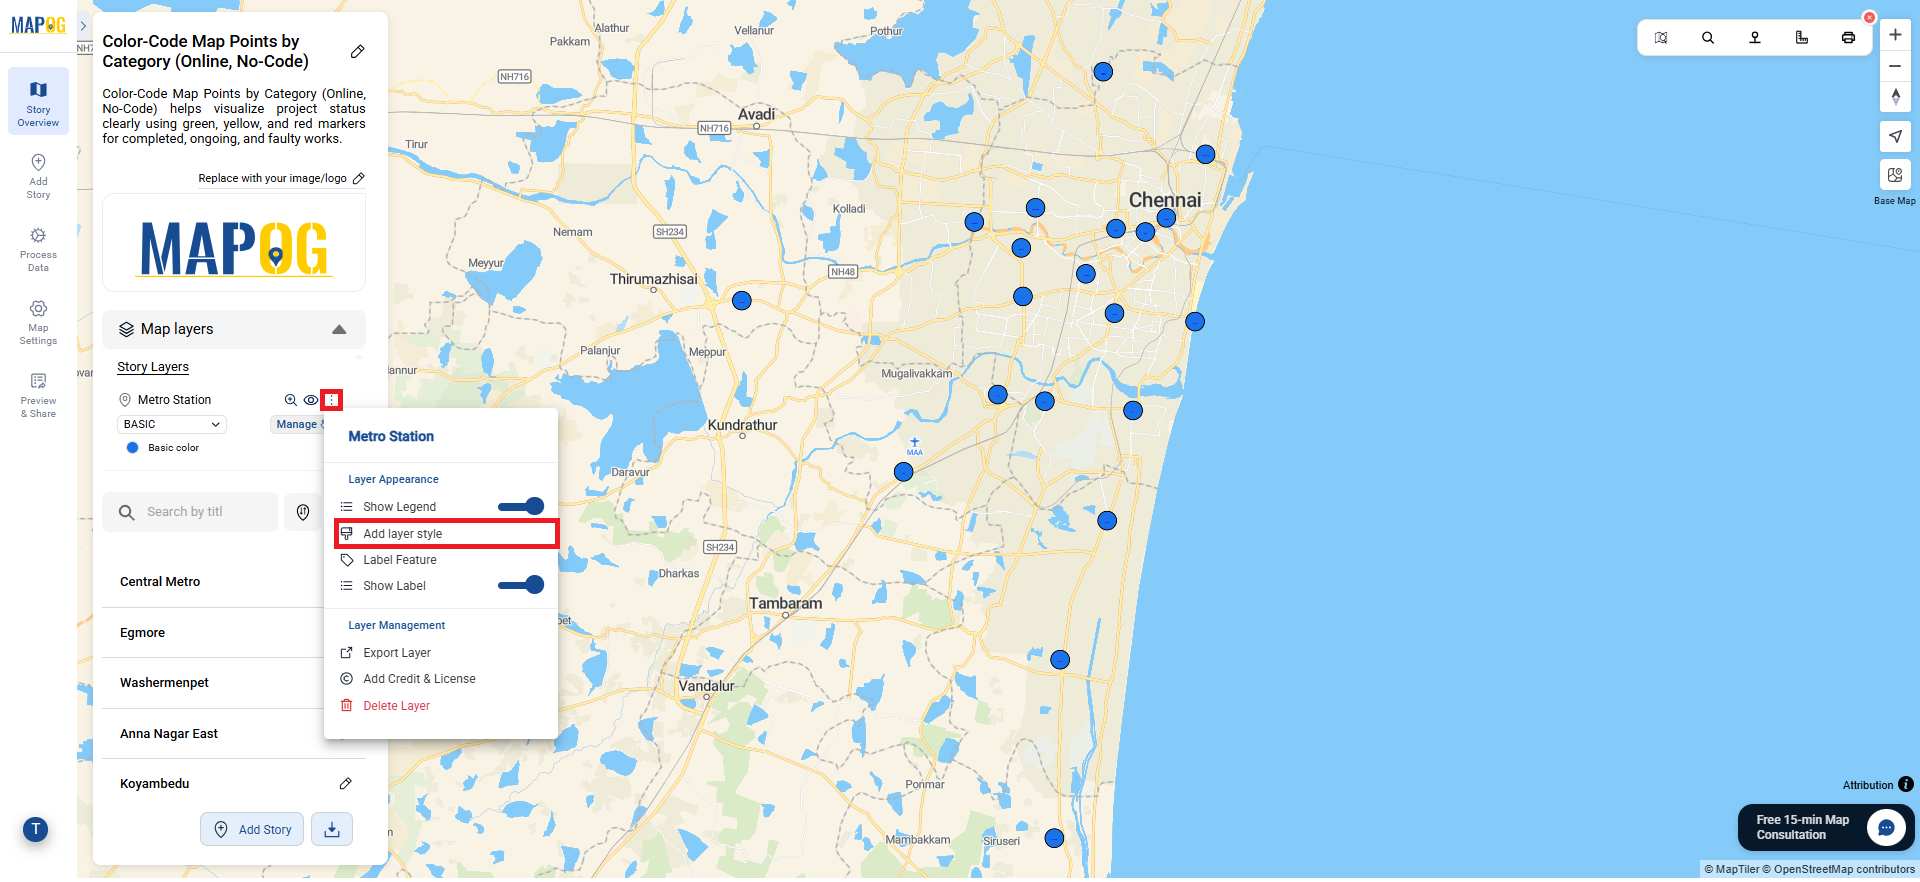
- Go to MAPOG & You can create a new map, for example, for metro stations, and style the metro station icons to clearly display their construction status. To begin, go to the Layer Settings of the Metro Station layer and click Add Layer Style.

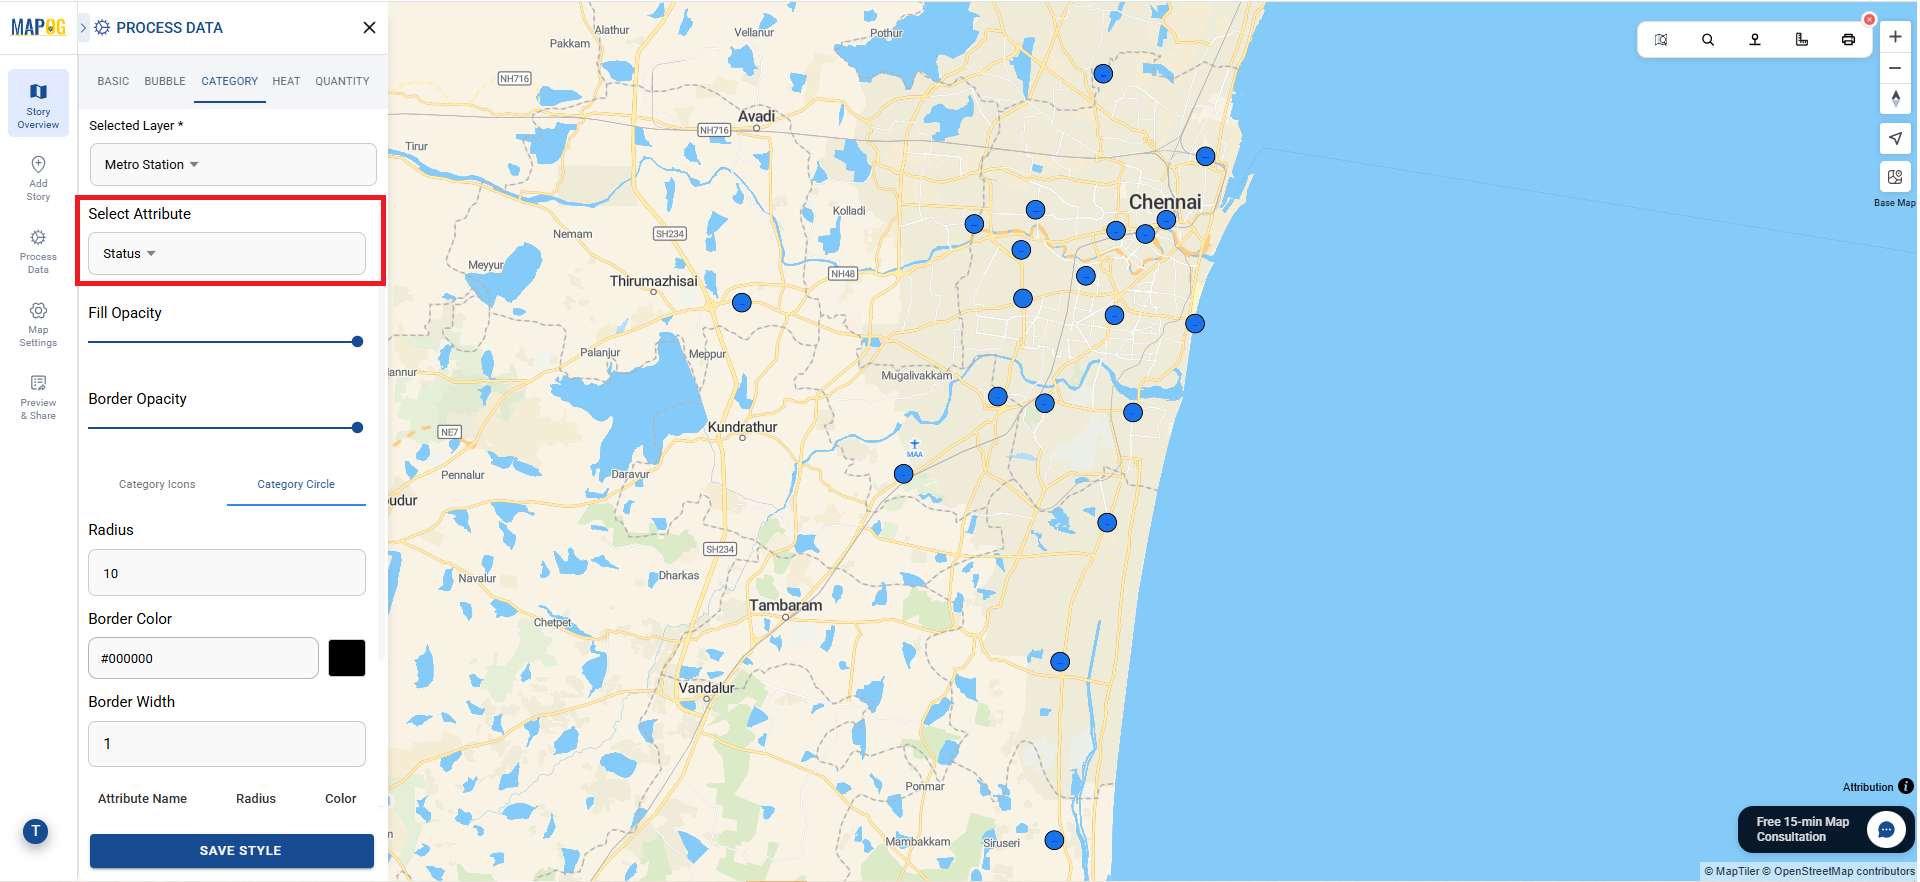
- Next, in the Style Editor, choose Category as the visualization type so that the stations can be grouped and shown according to their attributes.

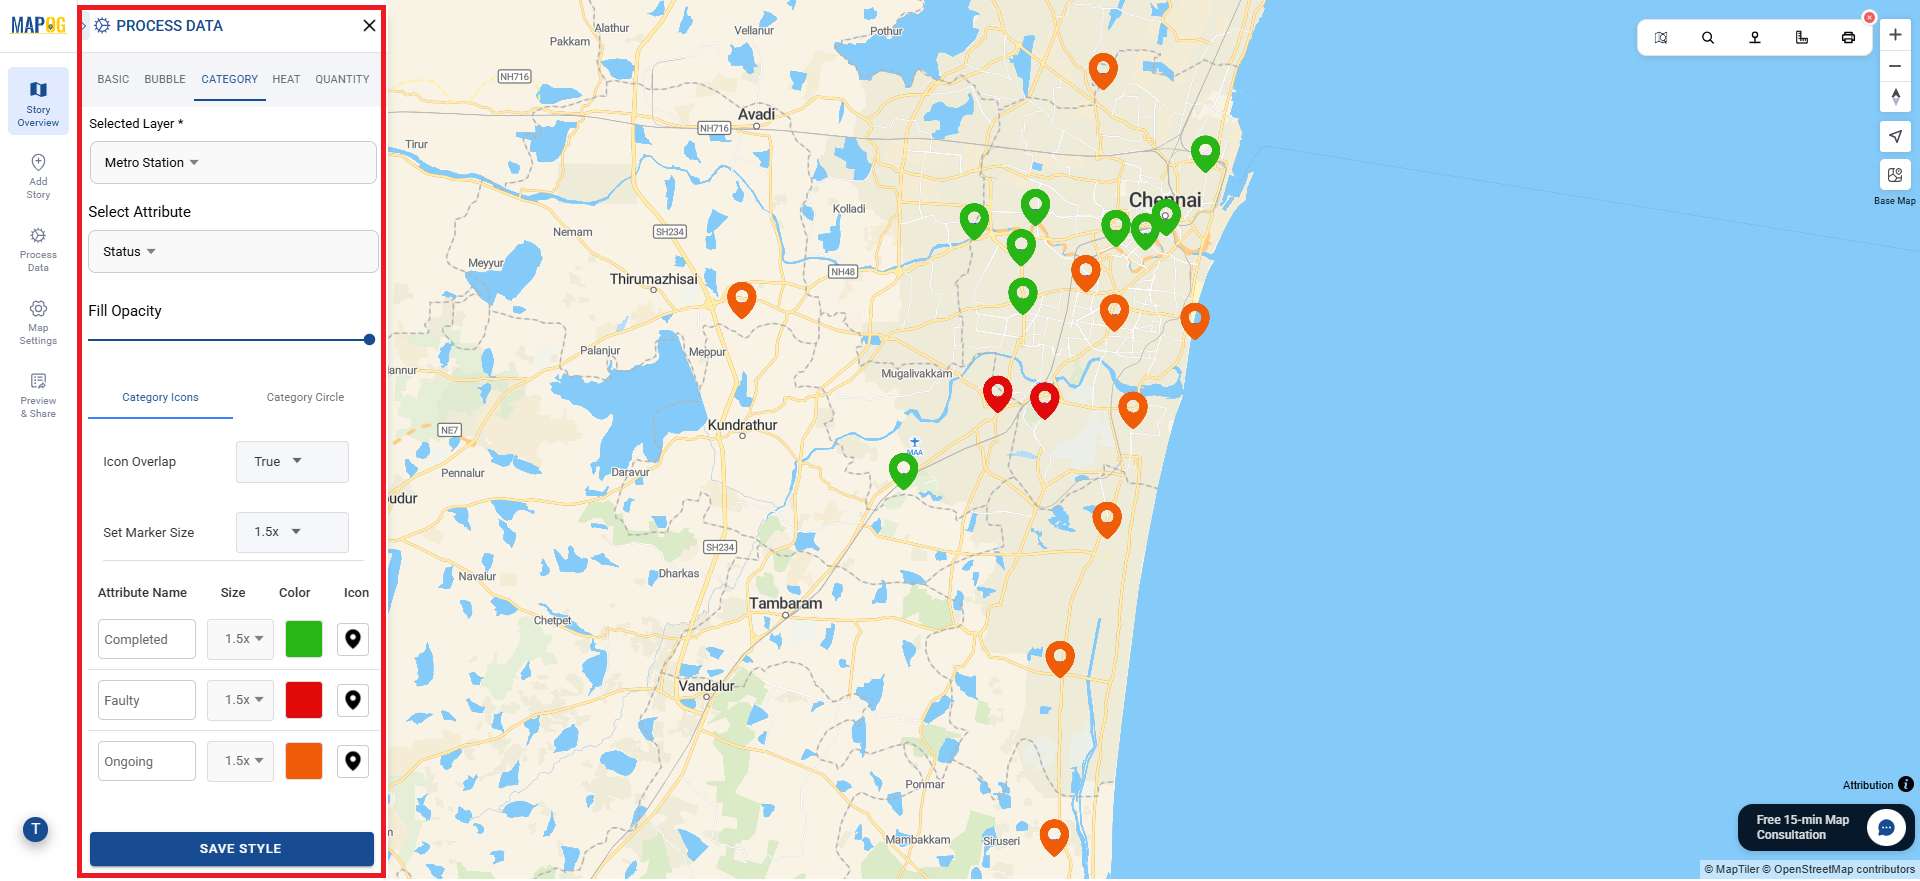
- Then, assign the attribute Status as the key field, since it contains the categories Completed, Ongoing, and Faulty move to the Category Icon part and select the icon as per your requirement.
- After that, configure the appearance by assigning distinct styles — use Green 🟢 for Completed stations, Orange 🟠 for Ongoing stations, and Red 🔴 for Faulty stations. You can also adjust the icon sizes if you want to make progress variations more visible.
- Finally, click Save Style to apply the changes, giving you a clear, color-coded visualization of metro project progress.

Insights and Applications
- Instantly spot problem areas: Color-coded icons highlight delays, faults, and risks immediately.
- Show accountability in projects: Maps display real-time progress, tracking investments and timelines clearly.
- Engage communities easily: Simple visuals help communities understand progress and stay informed quickly.

Relevant For Color-Code Map Points
- Urban Planners & Government Departments: Use maps to track progress, allocate resources, and ensure accountability in public projects.
- NGOs & Monitoring Agencies: Monitor development, identify gaps, and advocate for transparency.
- Citizens, Students & Researchers: Explore data, analyze patterns, and engage with community projects through simple visuals.
Benefits of Color-Coded Mapping
- Boosts Engagement: Transforming complex data into visual maps helps the public easily understand information.
- Supports Decisions: It guides decision-makers to allocate resources by highlighting delayed projects.
- Eco-Friendly: Digital maps cut reliance on static paper reports, promoting sustainability.
Conclusion
In conclusion, color-coded mapping with MAPOG makes categories instantly visible whether it’s ongoing, completed, or faulty projects. Although this example uses metro projects, you can apply this approach to any dataset, from schools to utilities, to help cities and organizations track progress, engage citizens, and plan effectively.
Additionally, several research works mentioned in this context have utilized MAPOG.