Converting Excel/CSV into an interactive map is a practical method for visualizing location-based information without programming skills. In other words, users upload spreadsheet data , such as addresses, coordinates, or place names into a mapping platform that displays it spatially. Therefore, no-code tools like MAPOG make this process accessible enabling users to geocode locations, categorize data, and create shareable maps for planning, research, or engagement.
Key Concept: Why Mapping Excel/CSV Data Matters?
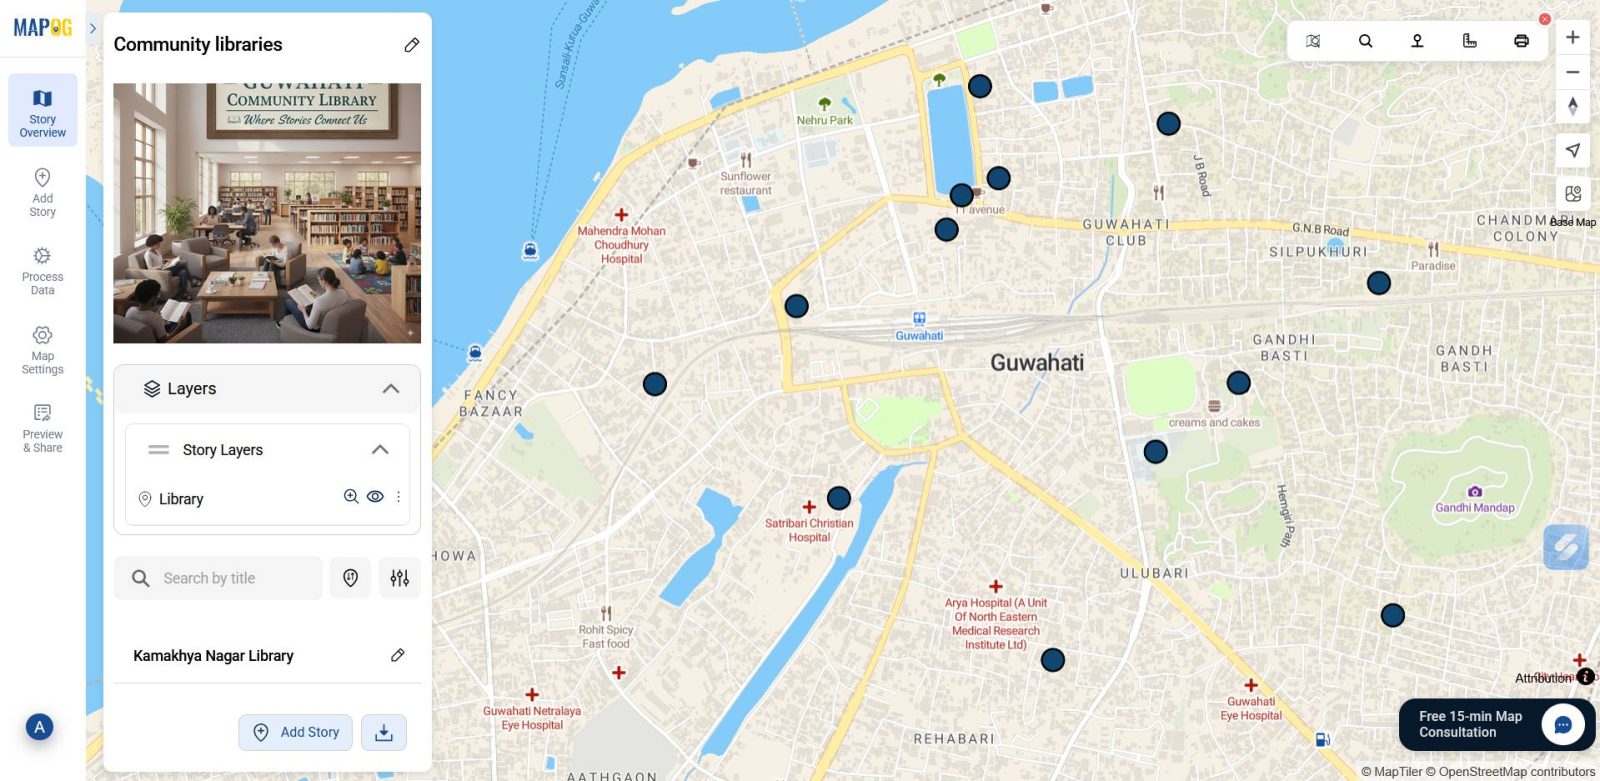
Mapping Excel or CSV data helps turn static tables into clear, visual maps. As a result, users can spot patterns and gaps instantly. This leads to better planning and communication, especially in public services and outreach. Furthermore, platforms like MAPOG allows users to add location points and details easily. For example, community library access demonstrates how tabular data can be transformed into an interactive, no-code map.
Steps to Build an Interactive Map from Excel/CSV
1. Add Your Data to the Map
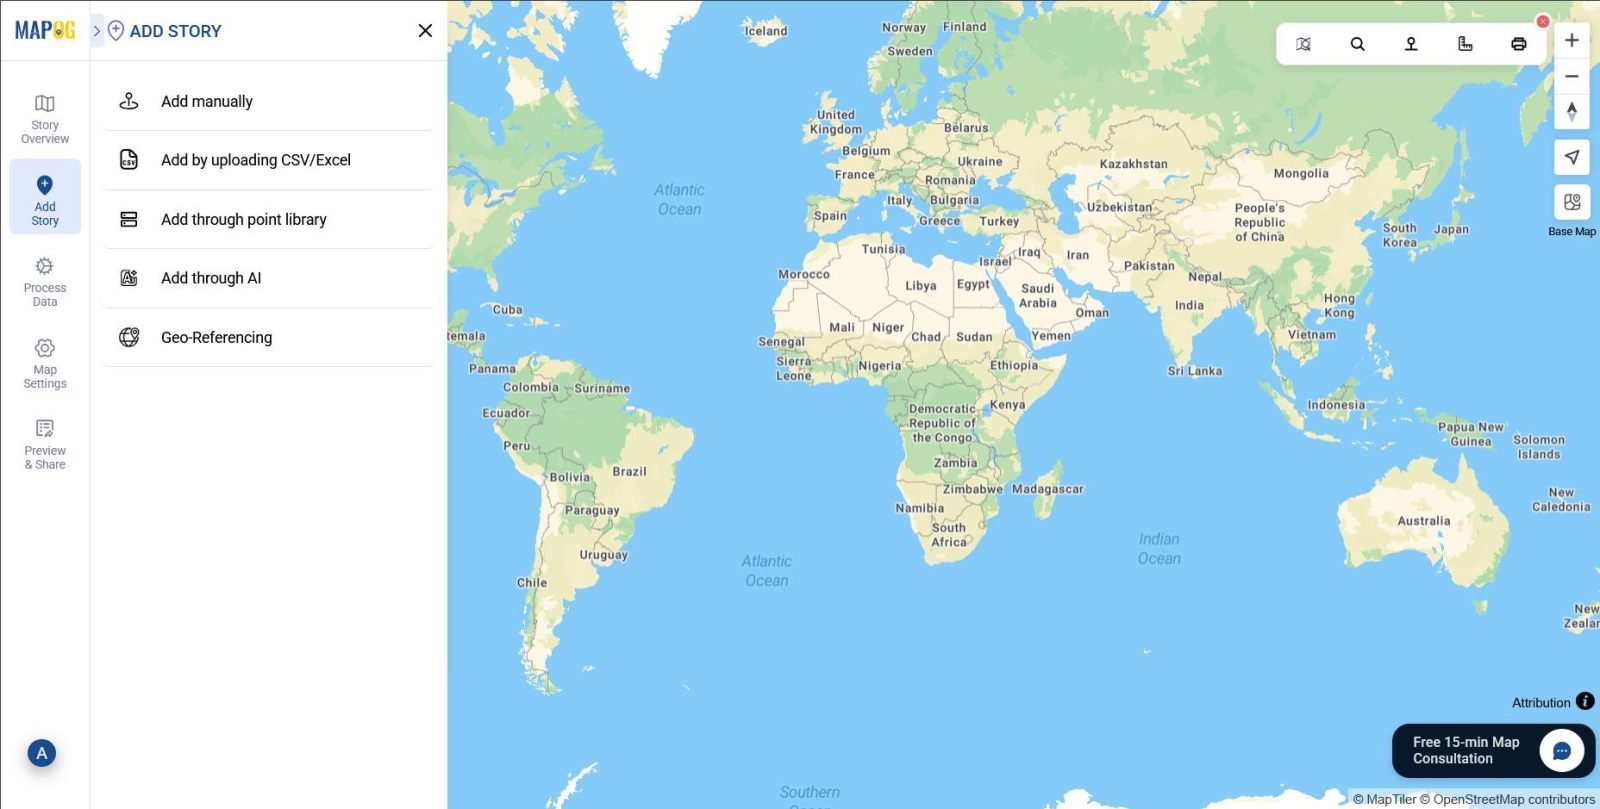
First, create a new map in MAPOG, go to the “Add Story” section. Then choose “Add by uploading CSV/Excel” to begin importing your spreadsheet.
2. Set Up Location Type and Attributes
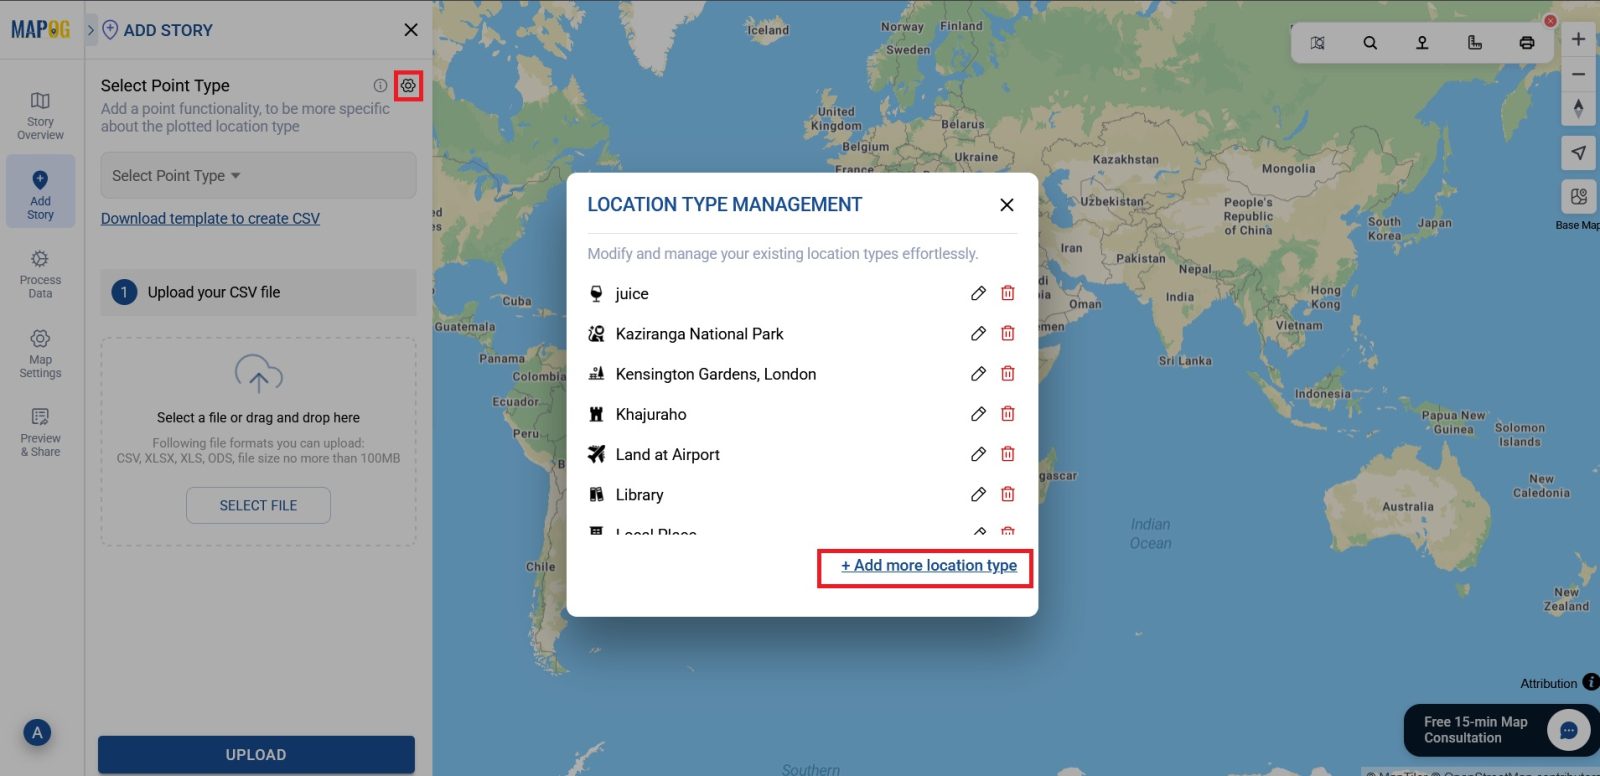
Then, click on the Select Point Type settings icon to categories a location on the map (like for e.g library, ATM, hotel etc), to which attributes like address, contact or timings are added. So,either choose an existing location type or create a new one by giving it a title in the Add more location type section (for e.g. library).
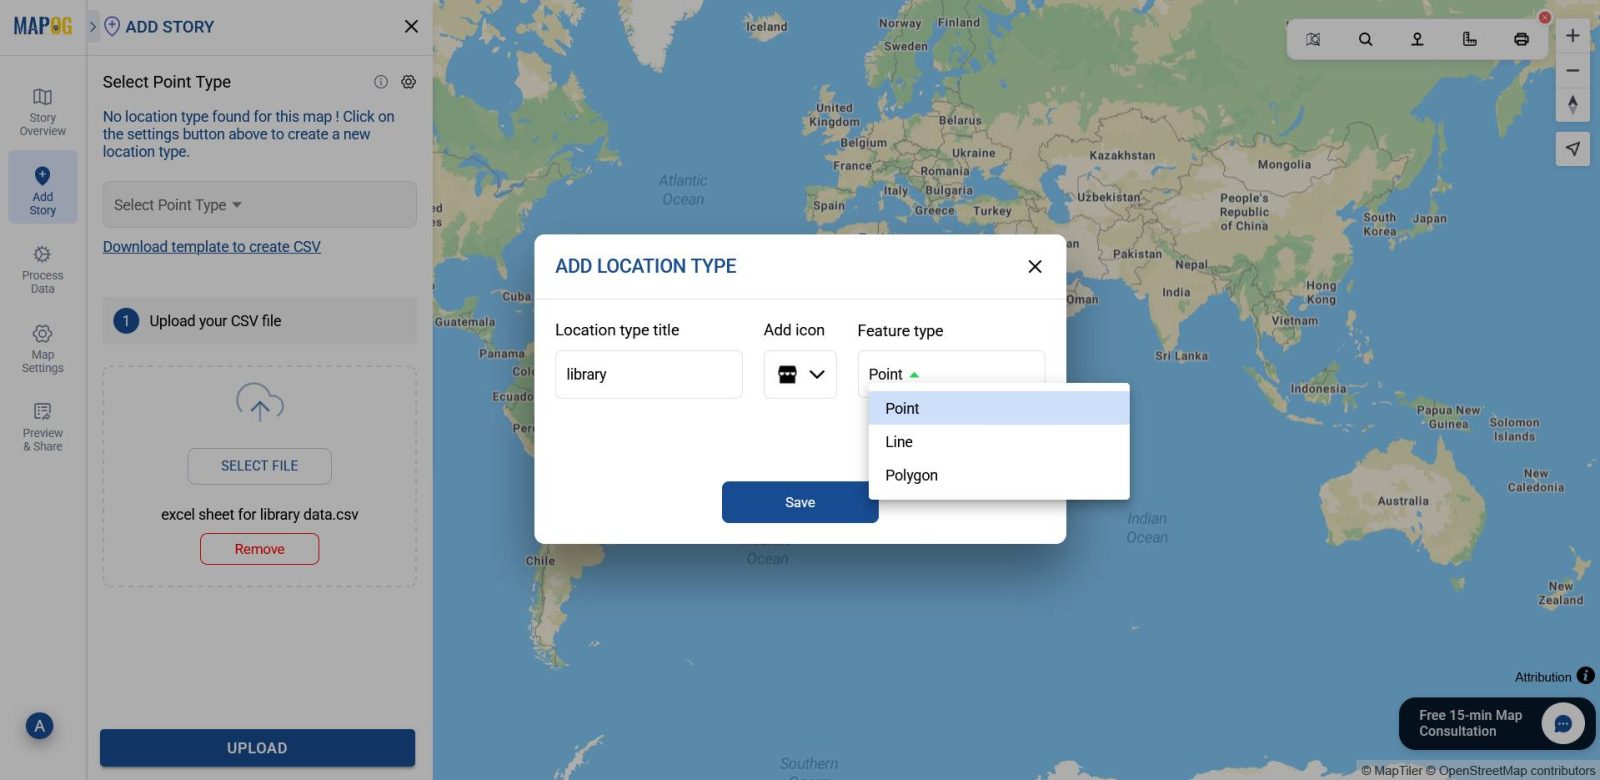
Further, provide a suitable icon & select a feature type, typically “Point” for individual locations.
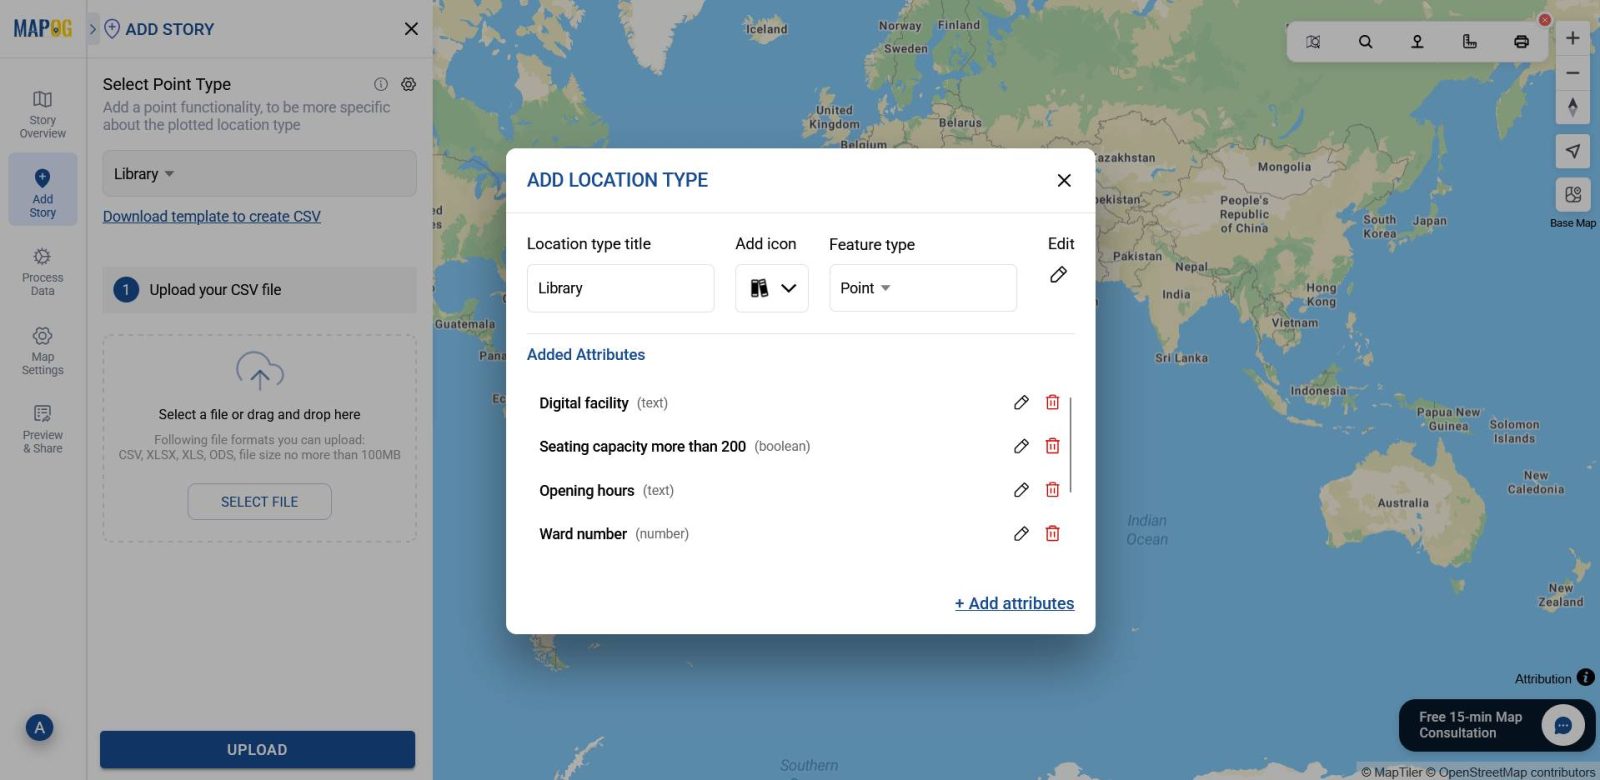
Then, add relevant attributes, which are data fields (such as for library data, digital facility, opening hours etc.) You can provide different kinds of features to each attribute, like Digital Facility in text format, ward number in number format, These things help you arrange your map. These attributes will further need to be manually matched with the corresponding data in the excel/CSV file.
3. Select Location Type and Upload Your File
At this point after selecting your point type from the list, browse your computer to choose the Excel or CSV file you want to map. Then, click “Upload” and the data will be uploaded into MAPOG.
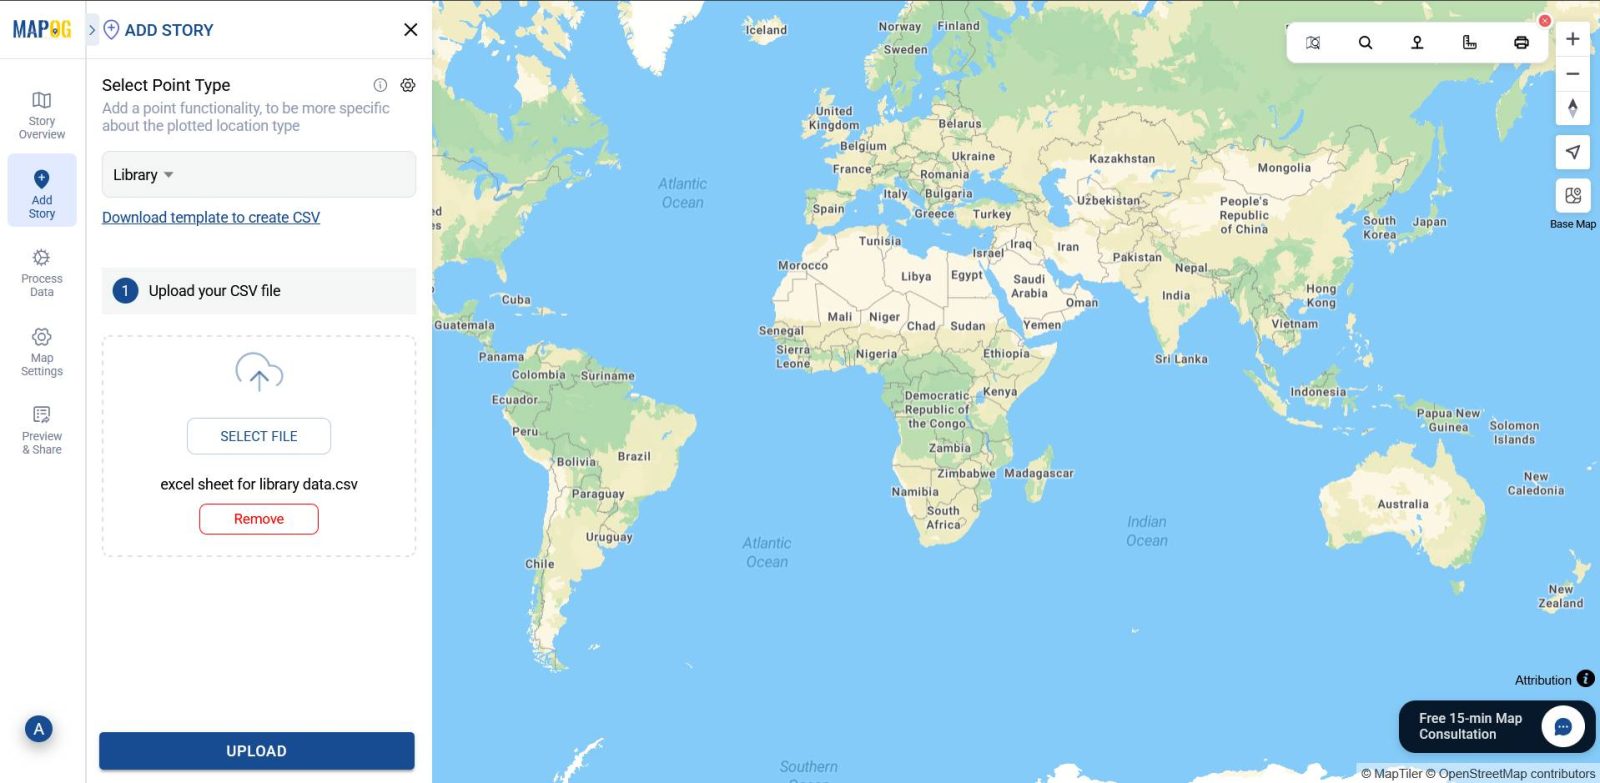
4. Define Location Fields
After that, once file is uploaded, match the attribute values to the columns in your Excel/CSV file.
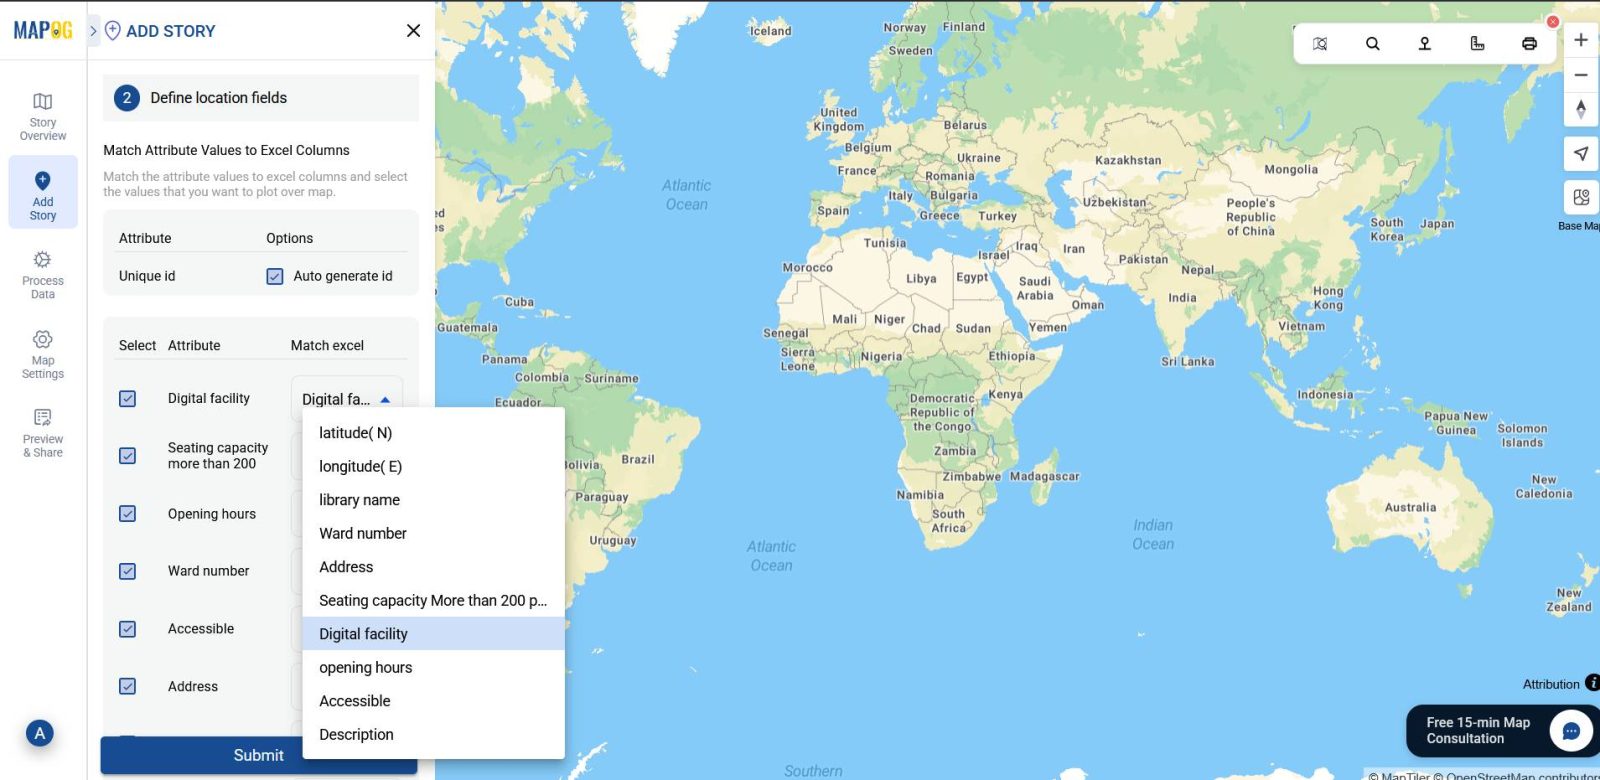
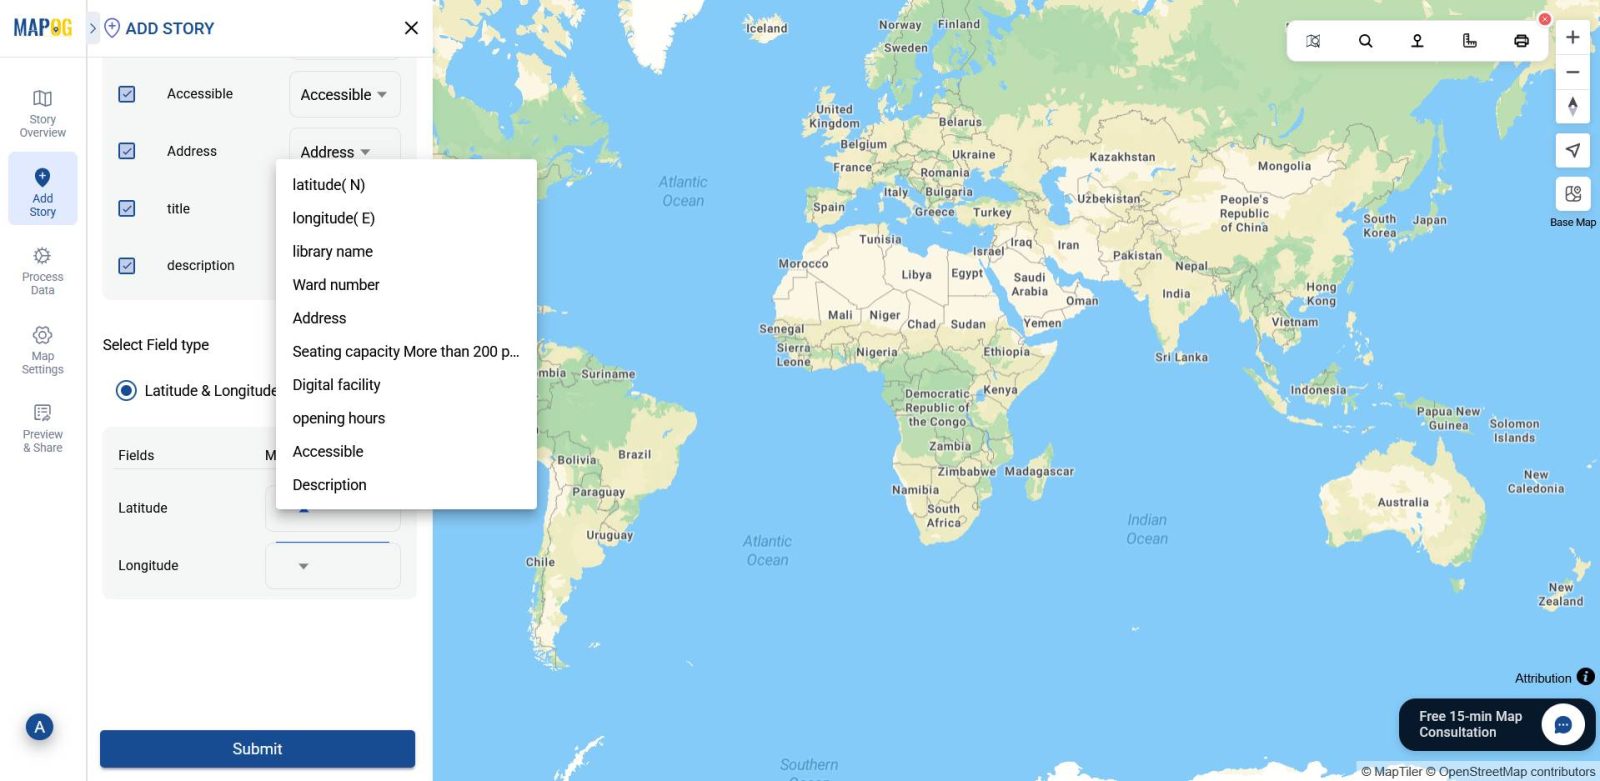
Further, for location placement, select the field as Latitude and Longitude, and ensure these match the correct columns. Once aligned, click “Submit” to proceed.
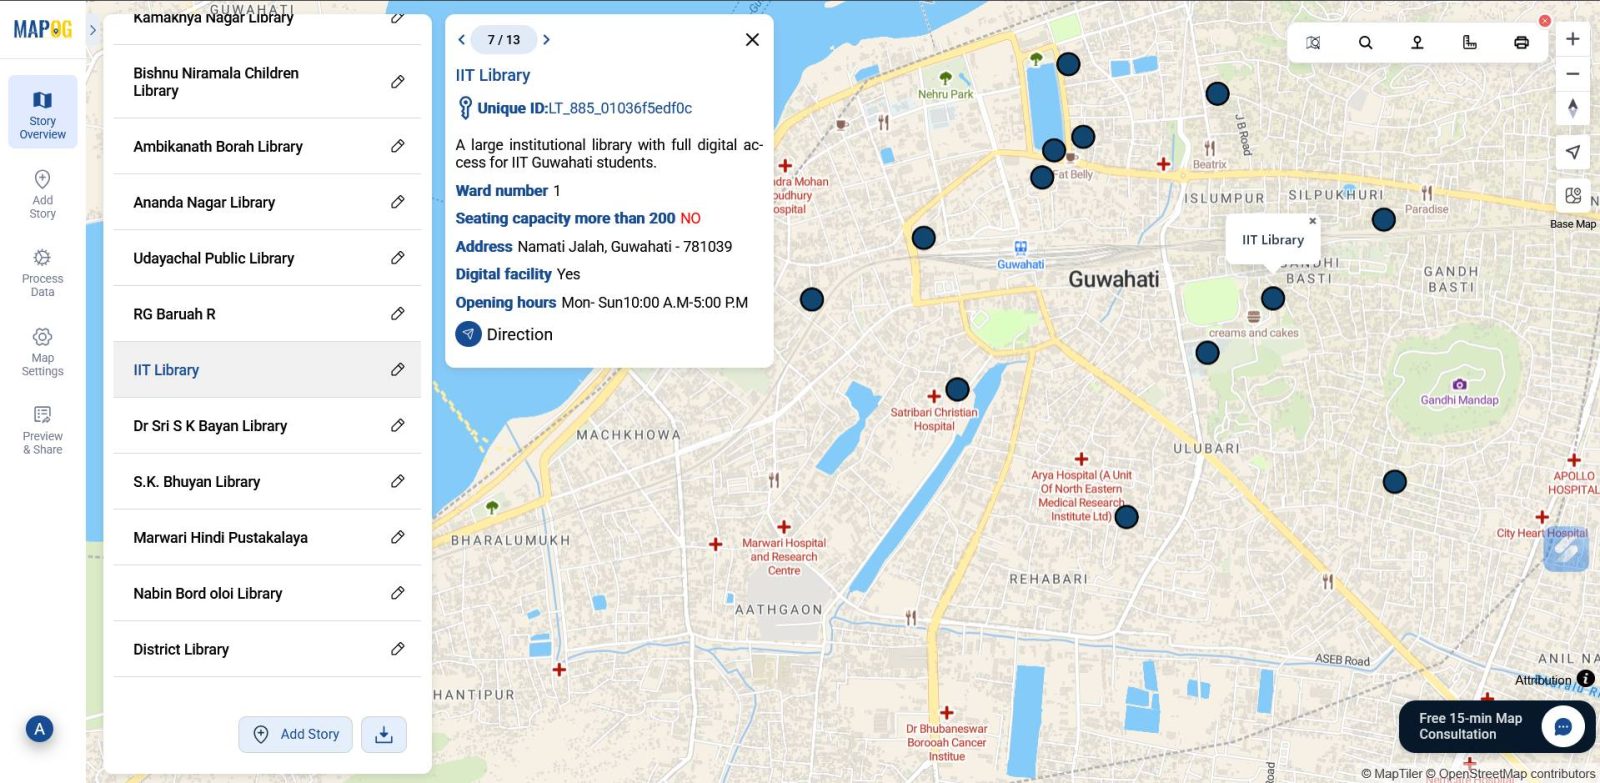
5. Final visualization with data attached
Once you upload everything, you can visualize all the points on the map and can also click on each point to see the details you attached.
Industrial use and benefits
Interactive maps help industries transform raw location data into actionable insights. With MAPOG, Excel/CSV files become powerful planning tools. Key use cases include:
- Logistics and Supply Chain Management
Companies upload delivery schedules, warehouse locations, and route data to visualize operations on a map. - Retail and Market Planning
Businesses use customer and store data to identify market gaps and plan expansion. - Urban Planning and Infrastructure Monitoring
Planners map infrastructure data—roads, utilities, public services—to monitor development and coverage. - Agriculture and Environmental Management
Farmers and agencies visualize crop health, soil conditions, and resource usage by mapping field data. - Healthcare and Emergency Services
Health departments map hospitals, clinics, and service gaps using location data.
Conclusion
Converting Excel/CSV data into an interactive map offers a simple, powerful way to visualise location-based information. As a result, industries like logistics, retail, and healthcare gain clearer insights and faster decisions. In particular, platforms like MAPOG make this process accessible, letting users upload spreadsheets and instantly map data. These interactive maps improve communication and present complex data in a user-friendly format. Ultimately, they turn static tables into dynamic tools for planning, outreach, and impact.
Check out more helpful reads below:
- How to Map Electric Vehicle Charging Stations Using GIS for Smarter Route Planning?
- The Ultimate Guide to Uploading GIS Data Formats (CSV, KML, Shapefile)
- How to Find Hotels with Nearby Attractions: Interactive Maps for Smarter Travel Planning?
- How GIS Maps the Nearest Blood Banks to Hospitals for Faster Emergency Response?