To Map Drainage Points effectively is one of the most critical parts of urban infrastructure, since clogged or damaged drains often remain unnoticed until monsoons cause flooding. For example, during heavy rains, municipal teams in many cities spend hours locating hidden or encroached drains before cleaning begins—by then, water logging has already disrupted traffic and damaged property.
With MAPOG, it’s now possible to map the entire stormwater network of a city on a single platform. Such visibility makes it easier to identify clogged drains, monitor their condition, and plan preventive maintenance. Projects like Mapping Sewage and Drainage Systems Using Cross Intersection Tool show how spatial mapping improves monitoring.
Key Features of an Interactive Drainage Map
Drainage mapping can be organized into four main categories:
- Culverts – Channels carrying stormwater beneath roads.
- Drains – Open or covered surface drains in urban areas.
- Outlets – Discharge points into rivers, lakes, or canals.
- Junctions – Points where multiple drains meet.
With filters for condition (good, clogged, damaged), last-cleaned dates, and complaints, maps act as maintenance dashboards. Extracting Drainage Networks for Hydrological Analysis: Step-by-Step Guide with GIS Tools highlights how drainage data can be systematically analyzed for smarter planning. Teams can filter clogged drains, plan cleaning schedules, and take preventive action instead of reacting after floods.
Steps to Build Your Drainage & Pipeline Map with MAPOG
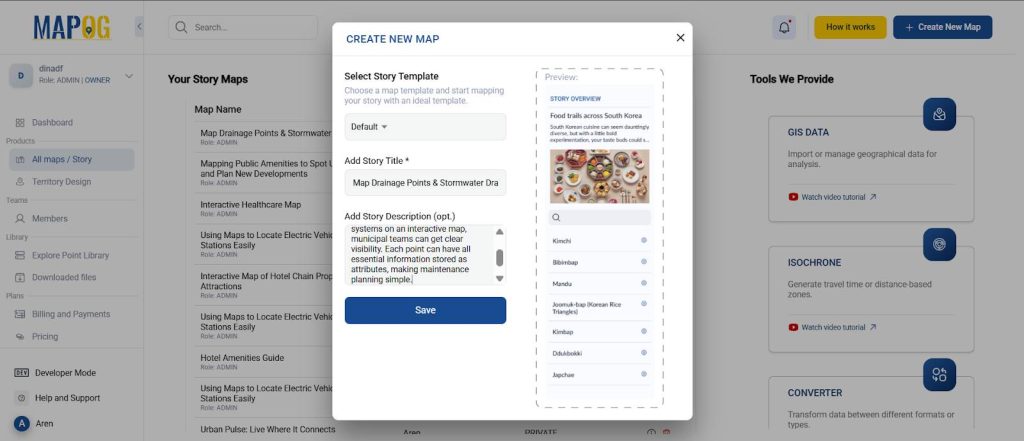
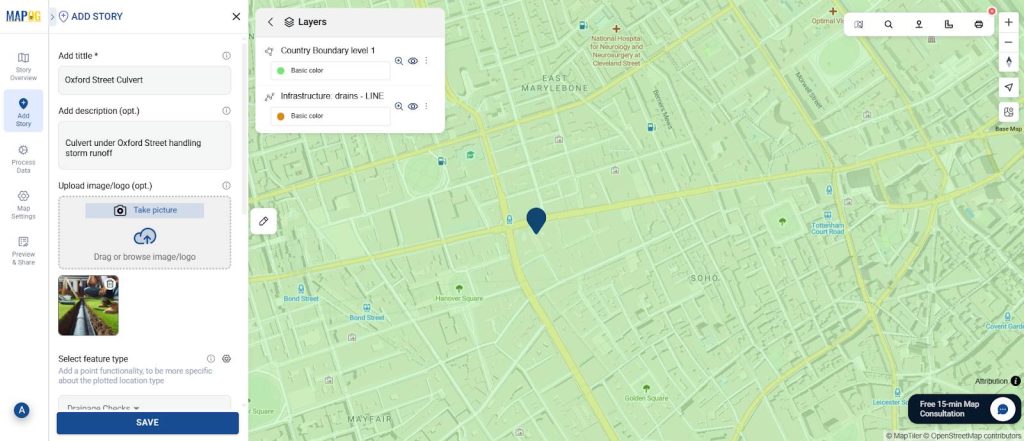
Step 1: Start a New Project
Log in to MAPOG and create a new story map.
Then, give it a name like “Drainage & Pipeline Maintenance Map” and write a short description.
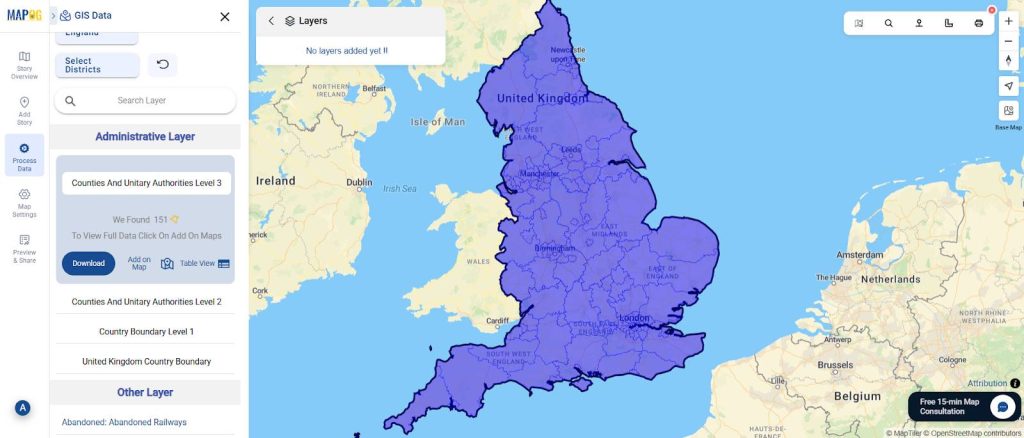
Step 2: Add GIS Data Layers
Go to “Process Data” → “GIS Data.”
From here, extract the following base layers to build your map:
- Country Boundary
- Drainage Network
These layers provide the geographic framework on which you will add your pipeline data.
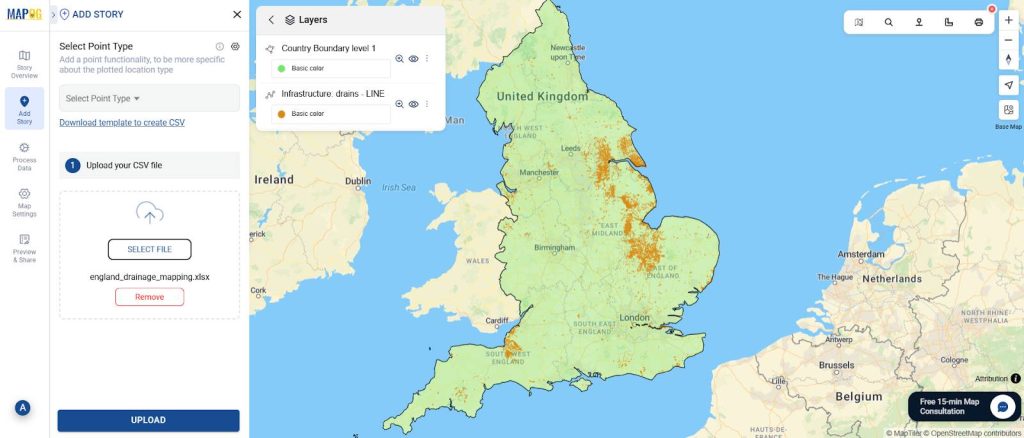
Step 3: Upload Data with CSV/Excel
Go to “Add Story” → “Add by Uploading CSV/Excel.”
Upload your prepared CSV of drainage points, damaged drains, and broken pipelines.
Include attributes such as:
- Name
- Location/Address
- Condition (Good, Damaged, Broken)
- Last Inspection Date
- Description (e.g., “Pipeline blocked due to debris buildup”)
This lets you add multiple points quickly instead of entering them manually.
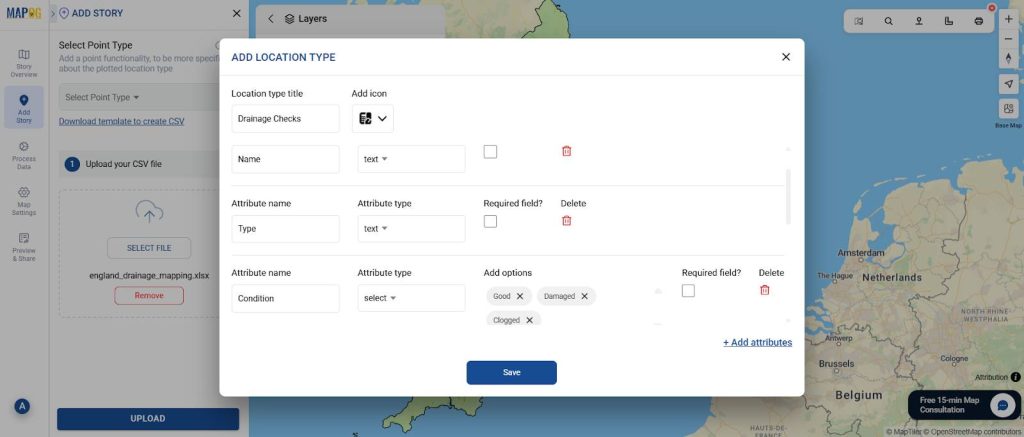
Step 4: Set Up Location Types, Custom Fields & Match Attributes
When uploading, go to “Select Point Type” → “Location Type Management.”
Create custom fields that match your CSV attributes (Condition, Last Cleaned Date, Inspection Notes, Urgency Level, etc.).
Then use “Match Excel” to connect your CSV columns with these fields along with coordinates, so MAPOG can auto-fill all points.
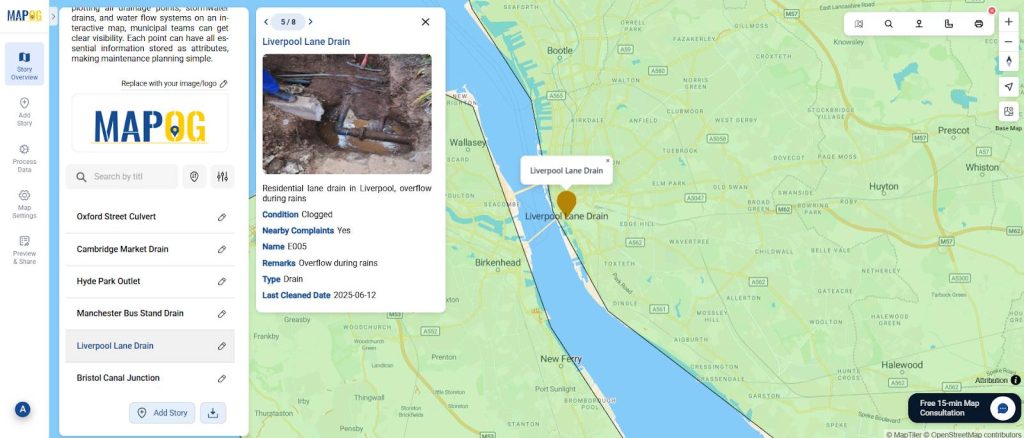
Step 5: Add Images
For each mapped point, upload reference photos using the edit point details option(e.g., broken pipelines, clogged drains, or inspection snapshots). These visuals help teams confirm issues before field visits.
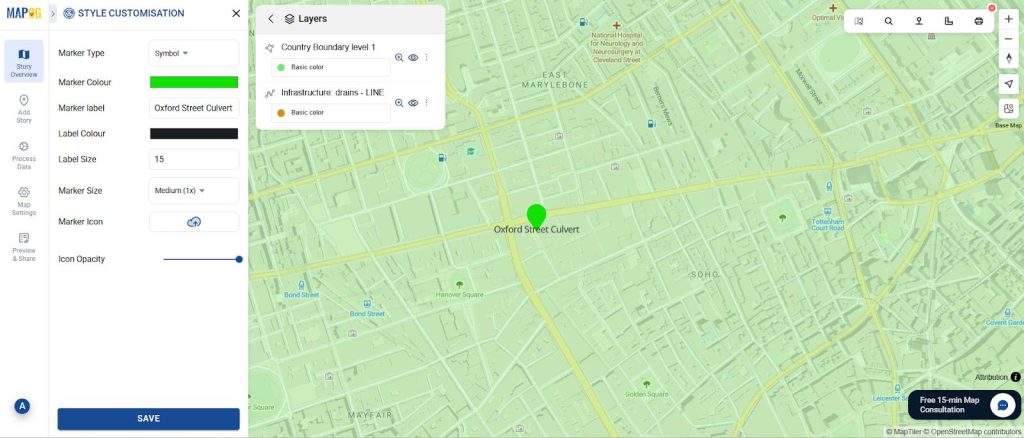
Step 6: Style Points by Condition
To make the map more intuitive, style your points based on their Condition field:
- Green = Good
- Yellow = Damaged
- Red = Broken/Clogged
Hence, this allows teams to instantly see which drainage points need urgent attention.
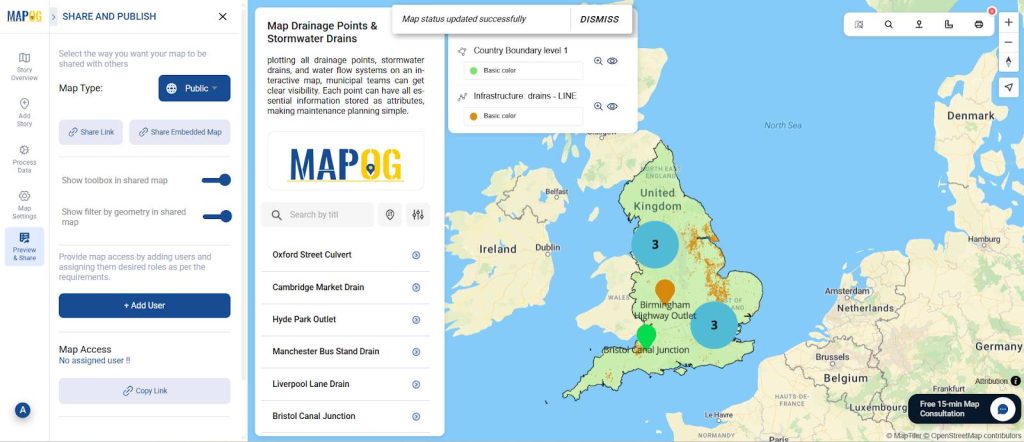
Step 7: Share & Publish
Go to “Share & Publish.”
- Choose Public or Private access.
- Then, share the link with your municipal team, email it, or embed it on your website for wider visibility.
Industry Applications
Interactive drainage and pipeline maps are not just for display — they have a wide range of real-world applications. When you Map Drainage Points, you create a stronger foundation for planning. Create Map of Sewage Lines and Water Cross-points for Urban Infra Projects is a strong example of how mapping can be adapted for infrastructure planning and smarter maintenance.
- Urban Planners: Spot waterlogging risks and integrate new drains with existing networks.
- Also, Municipal Corporations: Monitor inspections, schedule cleaning, and coordinate teams.
GIS Data Used
Conclusion: Smarter Drainage Mapping
An interactive drainage and pipeline map is more than just pins on a screen—it’s a decision-support tool. By choosing to Map Drainage Points, planners and municipal teams can track drainage conditions, prevent waterlogging, and make informed decisions in real time.
Hence, with MAPOG, anyone can build a clear, data-rich, and shareable drainage map that makes urban maintenance, planning, and communication easier.
Here are some other blogs you might be interested in: