To begin with, understanding the intersection between rivers and road networks is essential for effective environmental planning and risk management. In particular, these road and river intersections can indicate areas vulnerable to flooding, erosion, or pollution. By doing so, urban planners, environmental analysts, and disaster response teams to make data-driven decisions that improve sustainability and resilience.
In this blog, we’ll guide you step-by-step through the process of identifying road – river intersections using MAPOG. Ultimately, this knowledge can enhance both preventive strategies and responsive actions in the face of environmental challenges.
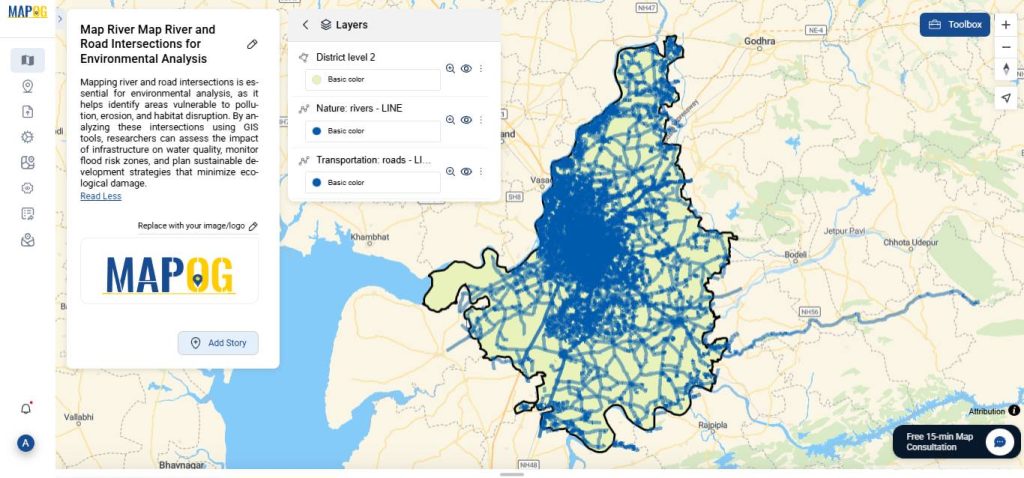
Key Concept: Why Use Cross Intersection for River and Road Mapping?
Mapping river and road intersections involves the spatial analysis. Using cross intersection tools allows planners and analysts to pinpoint these overlaps with precision. Indeed, this is especially important for assessing environmental vulnerabilities. As a result, it effectively highlights the potential impact radius around rivers. Consequently, this visualization becomes a vital tool for guiding infrastructure planning. Ultimately, it bridges the gap between spatial data and practical action.
River and Road Mapping for Smarter Environmental Planning
Discover how, by mapping river and road intersections using modern GIS tools, you can transform your environmental analysis. In this quick guide, we walk you through how spatial data enhances planning and supports sustainability.
How to Perform Cross-Intersection Analysis
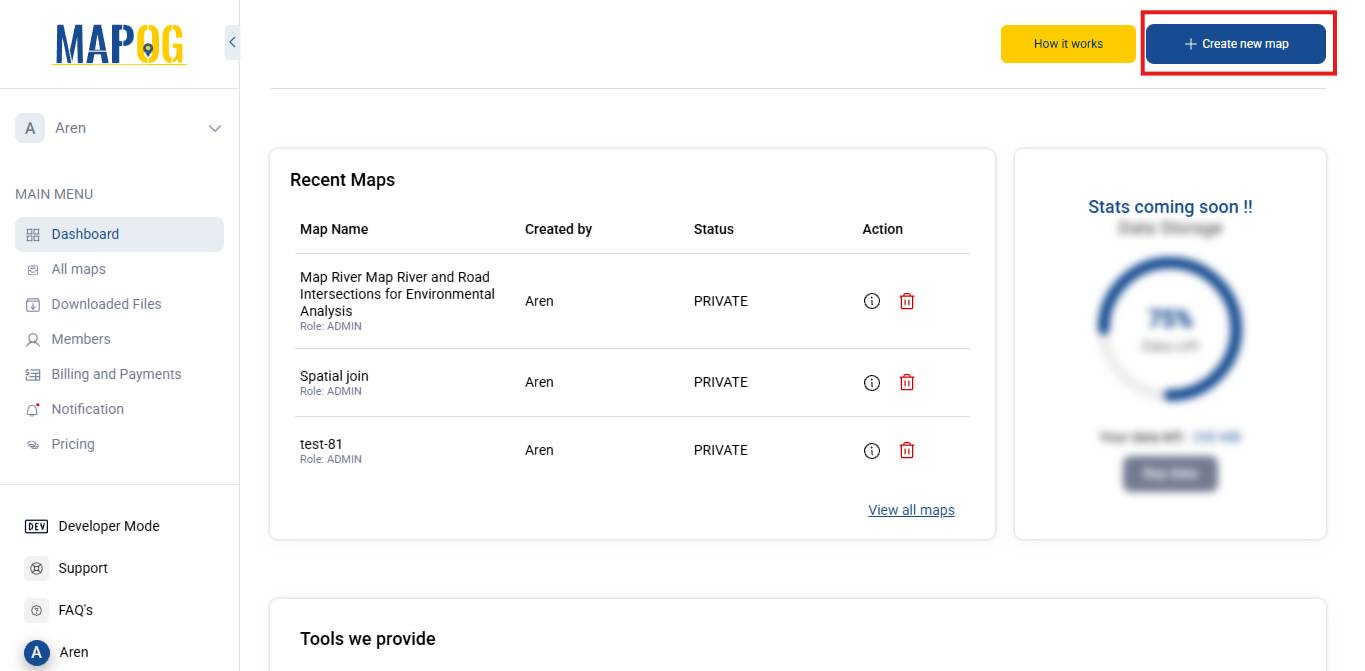
Step 1: Create a New Map
- To get started, go to MAPOG.
- Then, click on “Create new map” .
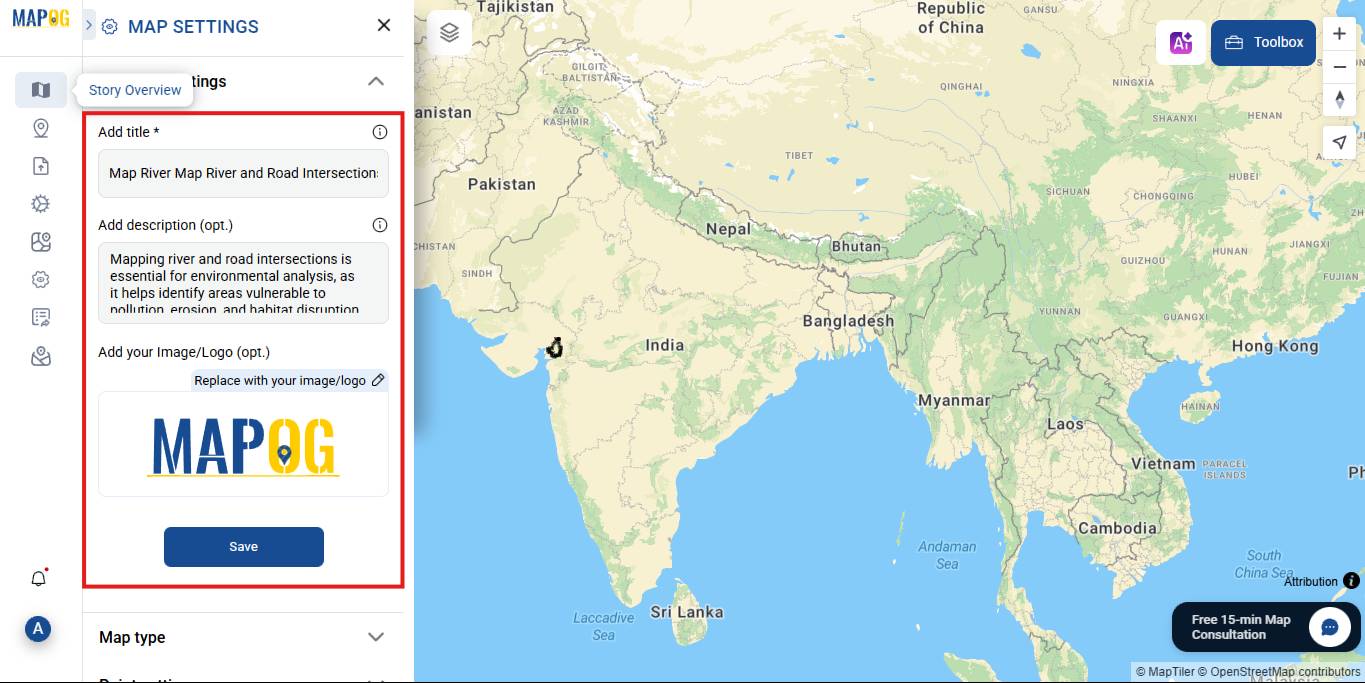
3. Next, add a title and a description for your map to provide context.
4. After that, click Save.
Step 2: Add GIS Data to the Map
Navigate to the GIS Data section.
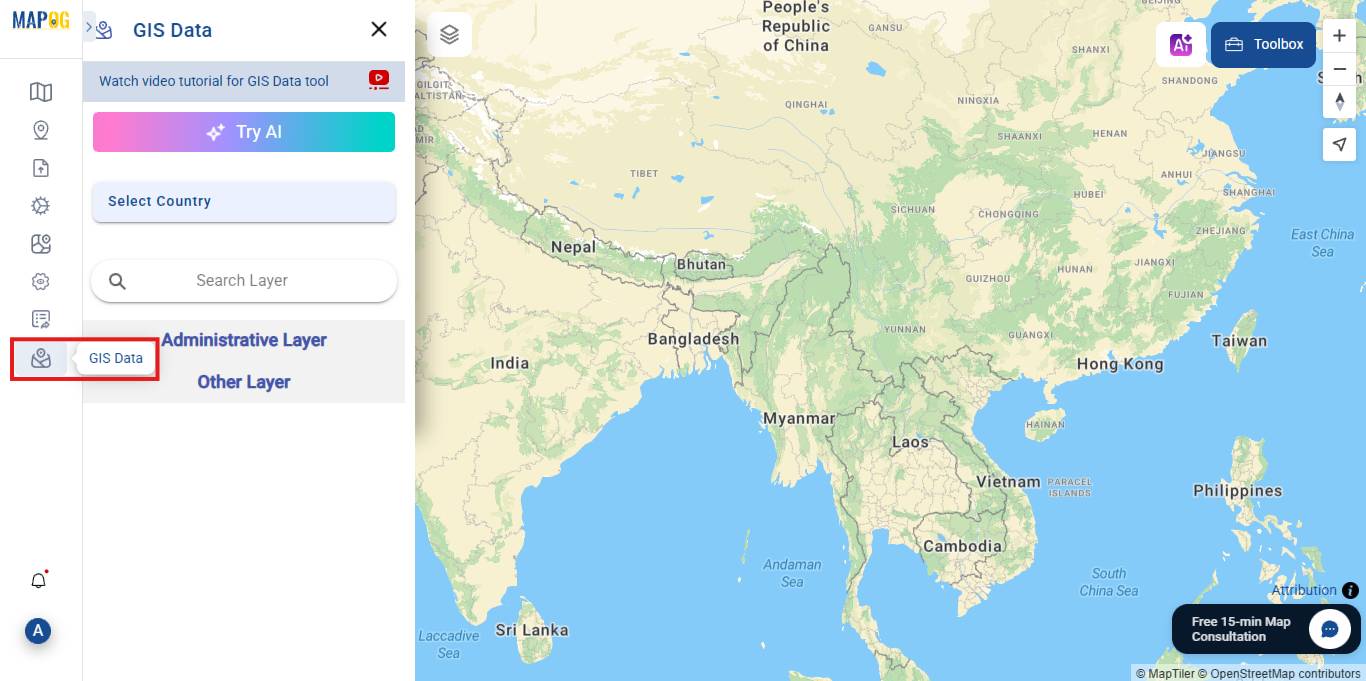
Next, to proceed further, at this stage, you should now select the following layers. During this step, it is important that the correct data is chosen, since, ultimately, this will directly impact the accuracy of the analysis.
- Country, State, District
Click Add to map.
Add Road and River Data:
- Now, Use the search bar to look for Roads and Rivers.
- After that, click Add to map for each dataset.
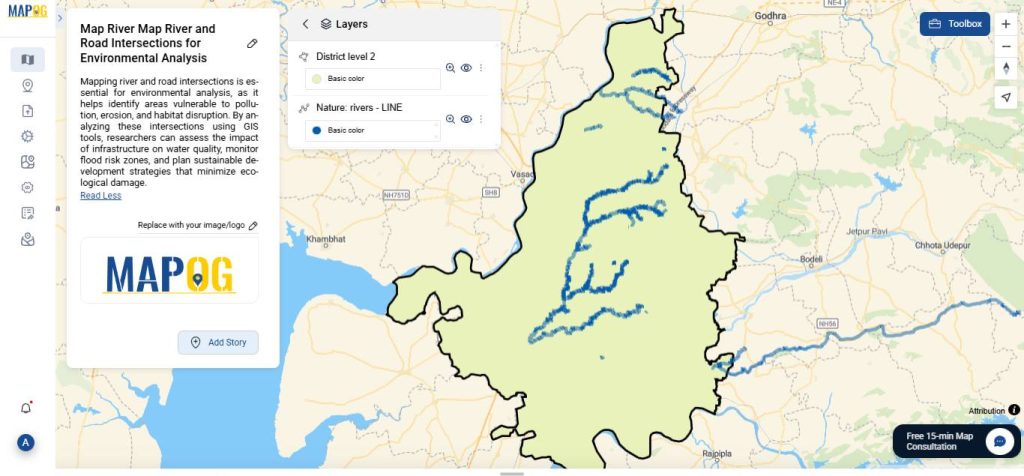
6. Once added, you can then view all your layers. At this point, it’s helpful to review them.
Step 3: Cross Intersection Analysis
- On the left-hand side of the screen, click on “Process data”.
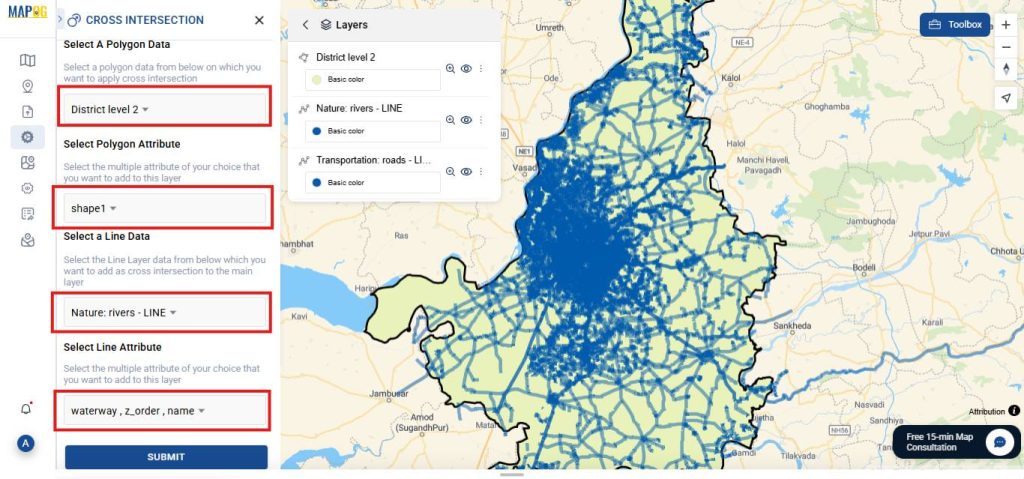
- Select Cross Intersection.
After that, moving forward-
- Select a Polygon Data: Choose District level 2. Attribute: Select shape1.
- Select a Line Data:
- First, choose the River line and assign the attribute.
- Then, choose the Road line.
- Click Submit.
Click on Style layer to change color, or width of the layer added.
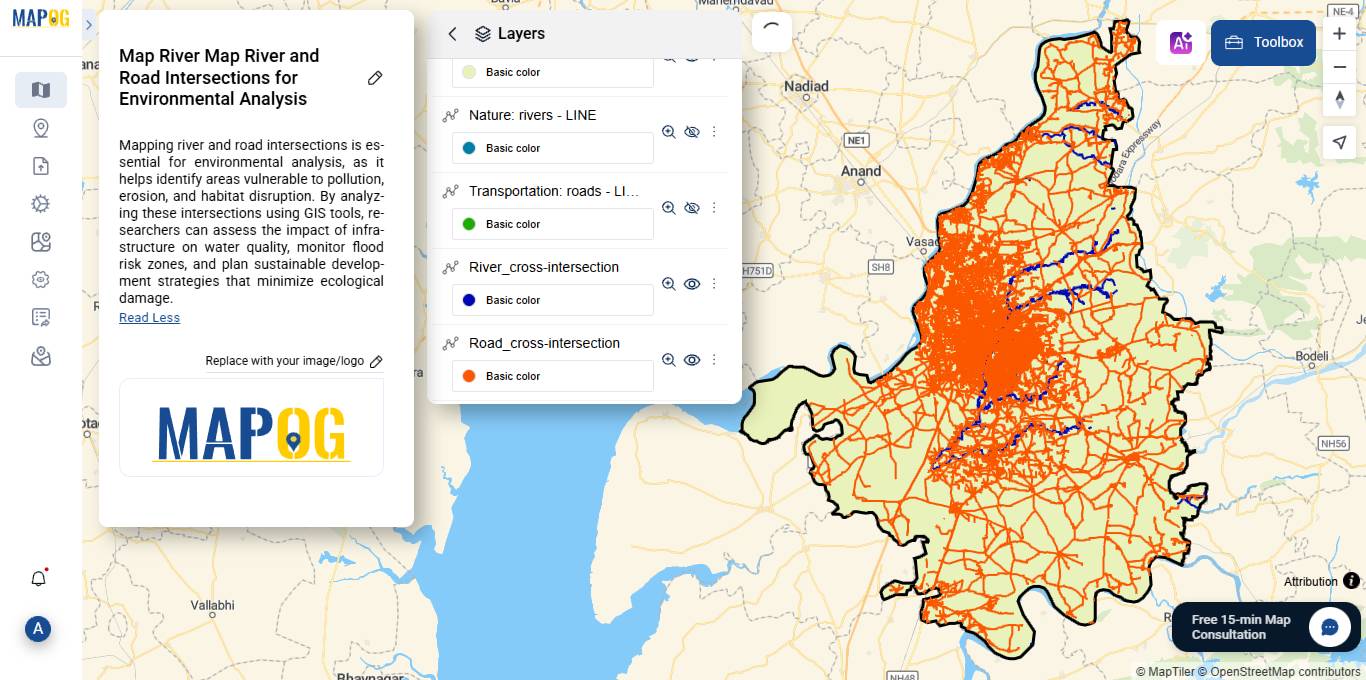
After submission, it will generate a new layer named road cross intersection. At this stage, you can begin analyzing these critical overlap points.
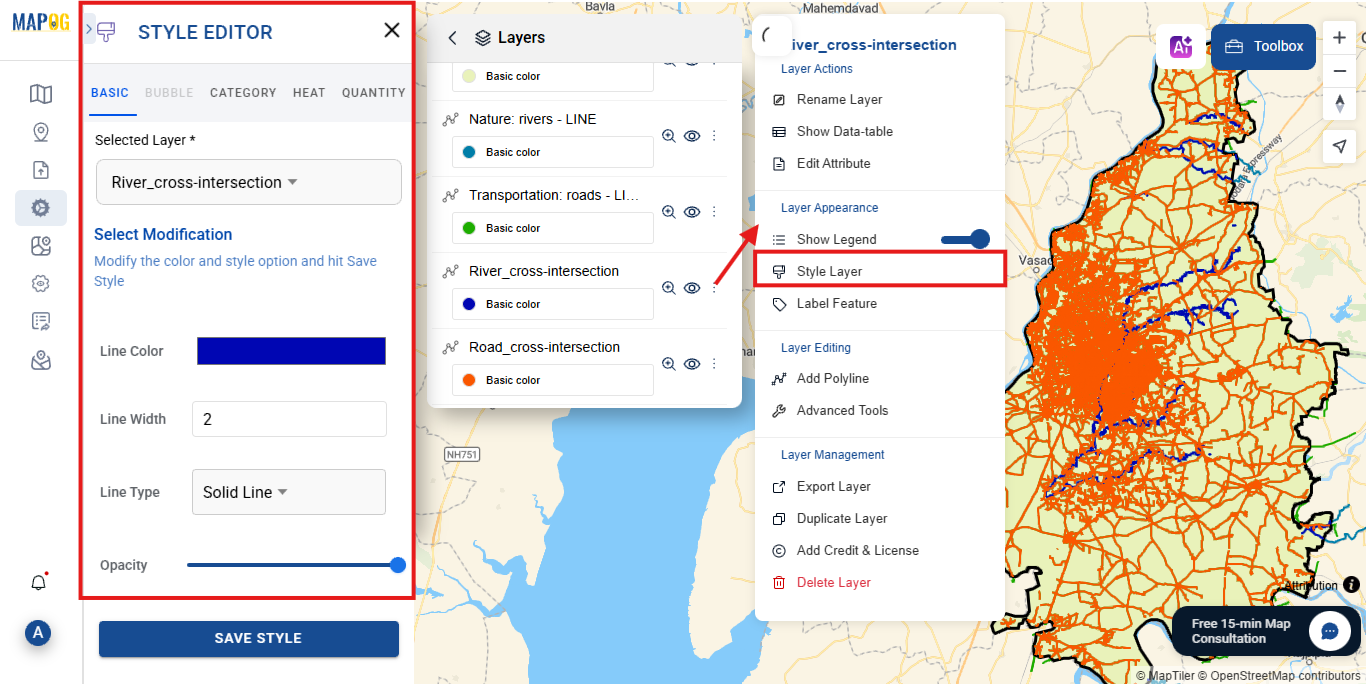
Step 4: Style Your Layers
To enhance the visual presentation of your data:
- Go to the Layer section.
- Click the three dots icon next to any layer.
- Select “Style layer”.
- Additionally, at this stage, you should further modify parameters. In particular, adjusting these settings helps visual clarity.
As a result, the level of customization makes analysis easier. Moreover, it allows users to distinguish overlapping features, thus improving spatial interpretation.
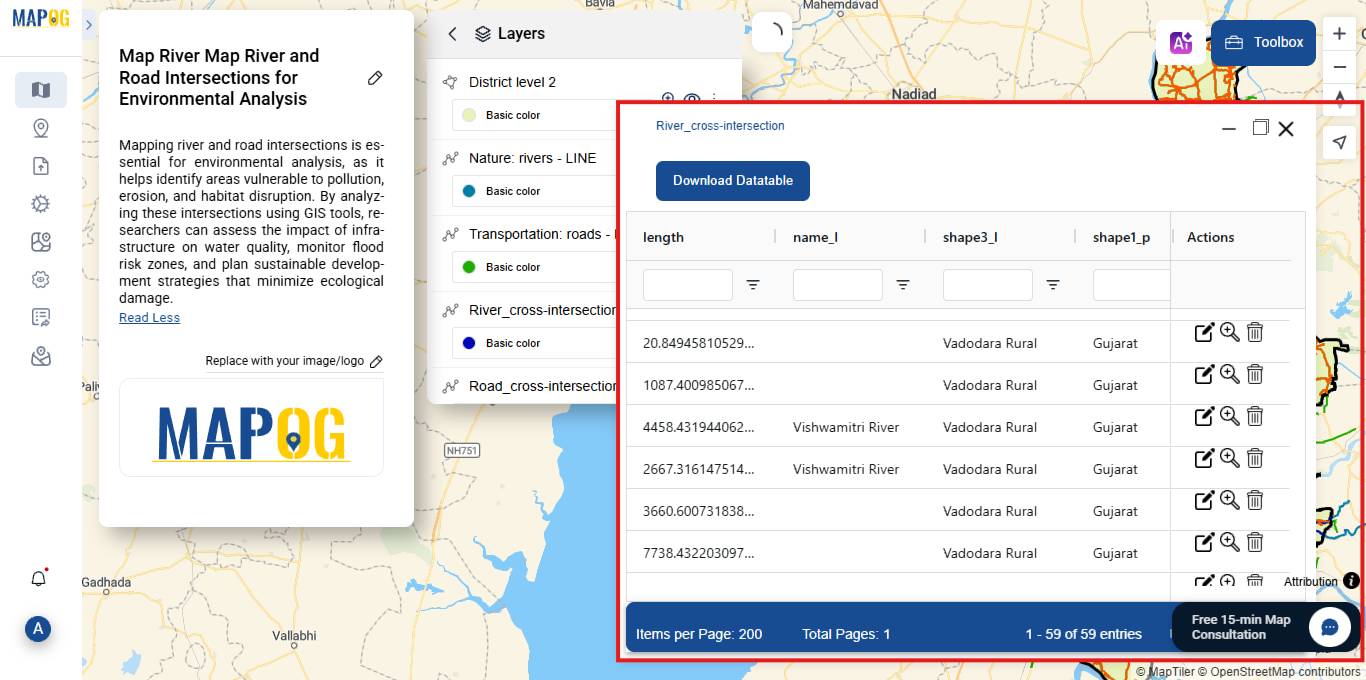
Step 5: View Layer Data
- Click the three dots next to the layer.
- Select “Show data table”.
Step 6: Explore the Intersections
Identify and visualize intersections of rivers with roads, railways, and administrative boundaries.
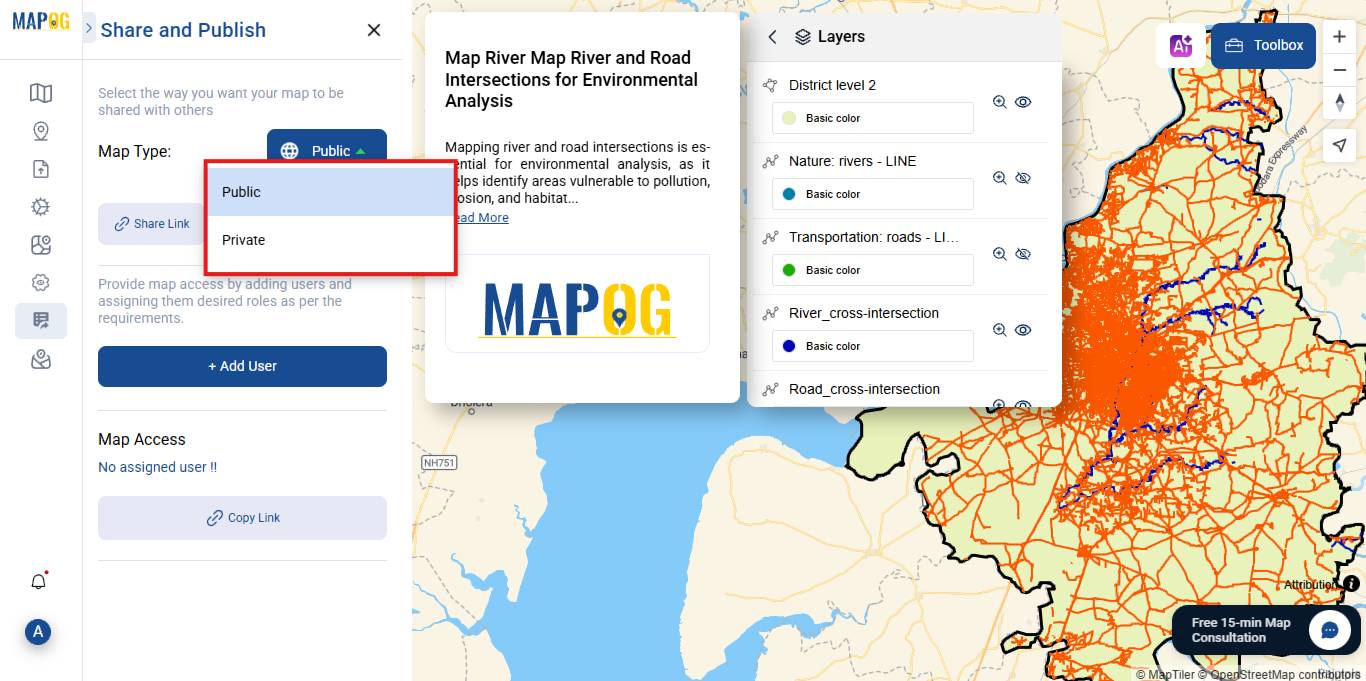
7. Export and Share
Once mapping is complete, export your results using publish and share option.
Why It Matters: Industry Use & Benefits
- Urban Planners – Reduce flood risks and improve drainage design.
- Environmental Scientists – Monitor pollution flow and ecosystem impact.
- Government Agencies – Prioritize repairs and plan disaster responses.
GIS Data Used:
District level 2 boundary of Vadodara Gujarat.
Rivers – Line
Roads – Line
Conclusion:
By leveraging cross intersection analysis and buffer zones in MAPOG, users can create meaningful, data-rich maps that reveal where rivers intersect with roads. These visual insights empower planners, engineers, and local authorities. Ultimately, it transforms raw spatial data into actionable insights. Ultimately, this practice serves as a crucial link between raw geospatial information and real-world applications.
Share your insights or questions in the comments below.
Here are some other articles you might be interested in:
Mapping Sewage and Drainage Systems Using Cross Intersection Tool.
Real- Life Crime Tracking Maps: Using GIS for Urban Safety.
How to create a travel itinerary on a map and share it online.