In today’s rapidly growing cities, climate change and infrastructure weaknesses have made urban flooding a significant challenge for communities and city planners alike. During heavy rain or storms, certain areas become prone to waterlogging, flood risks, and complaints, putting nearby properties and people at risk. At the same time, identifying high-risk zones and nearby shelters—and understanding their accessibility—is crucial for effective emergency response and mitigation. With MAPOG, city authorities and planners can leverage Urban Flood Hotspots Mapping to visualize problem areas, assess vulnerability, and develop strategies to keep communities safer and more resilient.
Key concepts
Mapping urban flood complaint hotspots and shelter accessibility using GIS is more than placing markers on a map—it’s about creating a spatially informed response system that safeguards lives and infrastructure. By combining flood complaint data with location-based tools, city planners can visualize patterns of waterlogging, identify high-risk areas, and assess the proximity of shelters to vulnerable neighborhoods. With MAPOG, users can define buffer zones around shelters to evaluate coverage areas, highlight gaps in accessibility, and plan emergency services more effectively.
Steps in Urban Flood Hotspots Mapping:
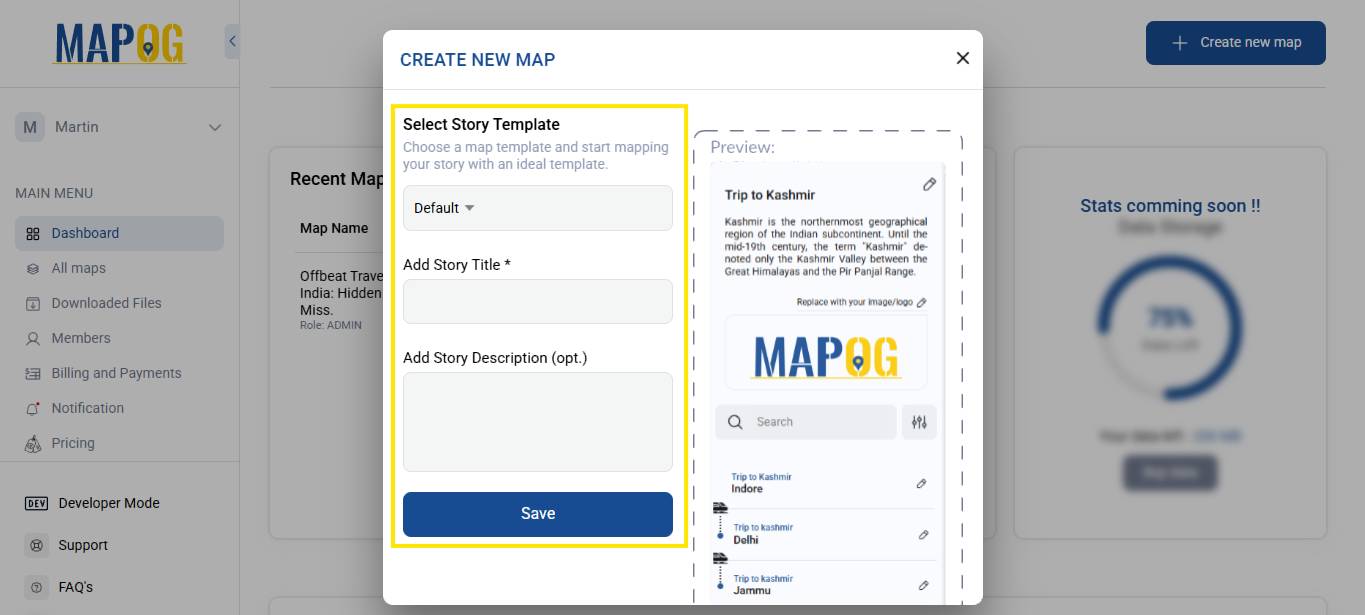
1. Access MAPOG’s Mapping Platform
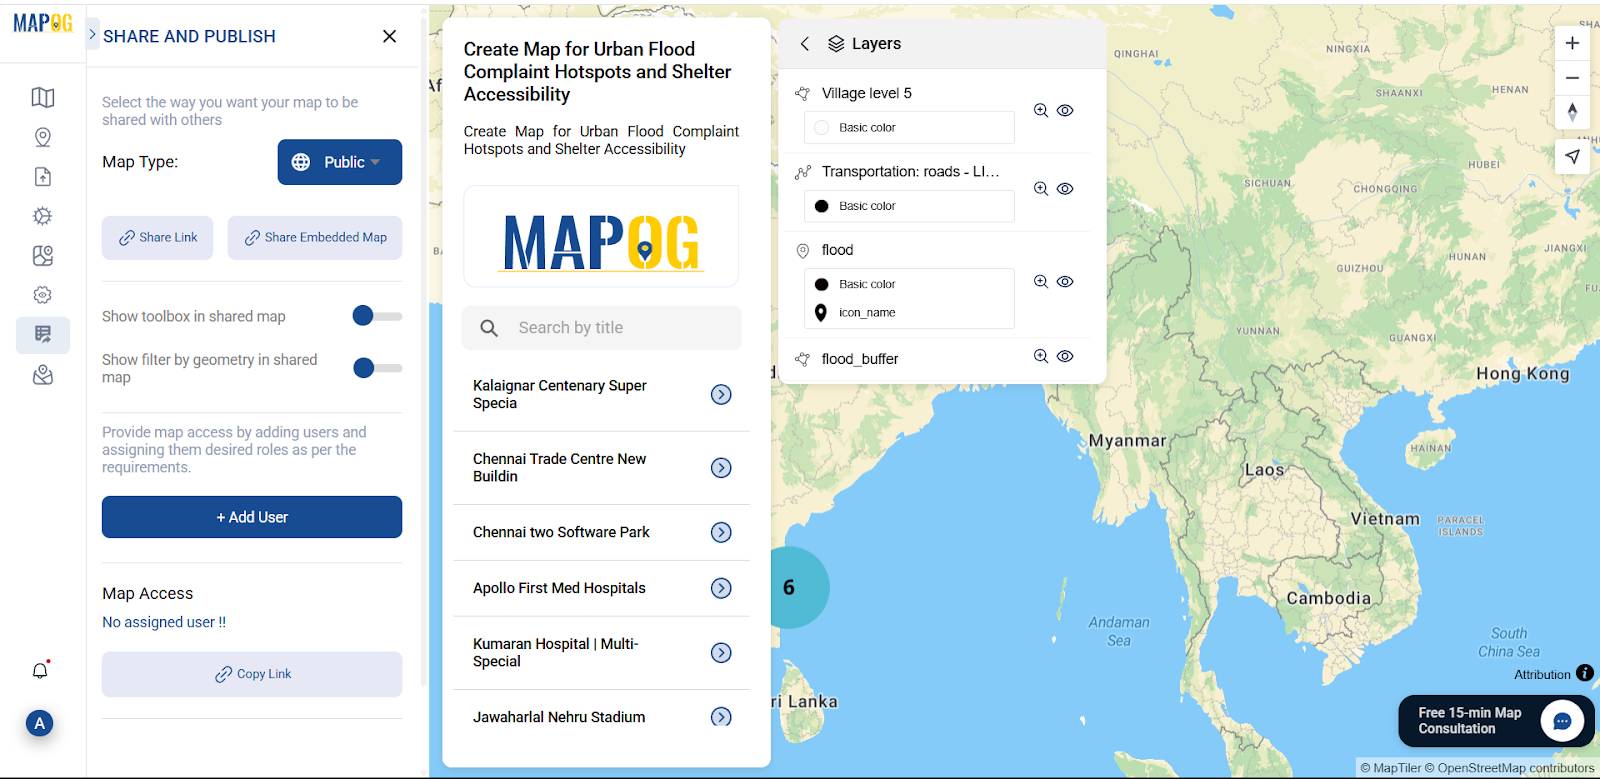
Visit MAPOG platform in your browser. Click on “Create New Map” in the top- right corner of the homepage to start creating your own map. Add the title of your map. Description telling us what it’s about. Then save.
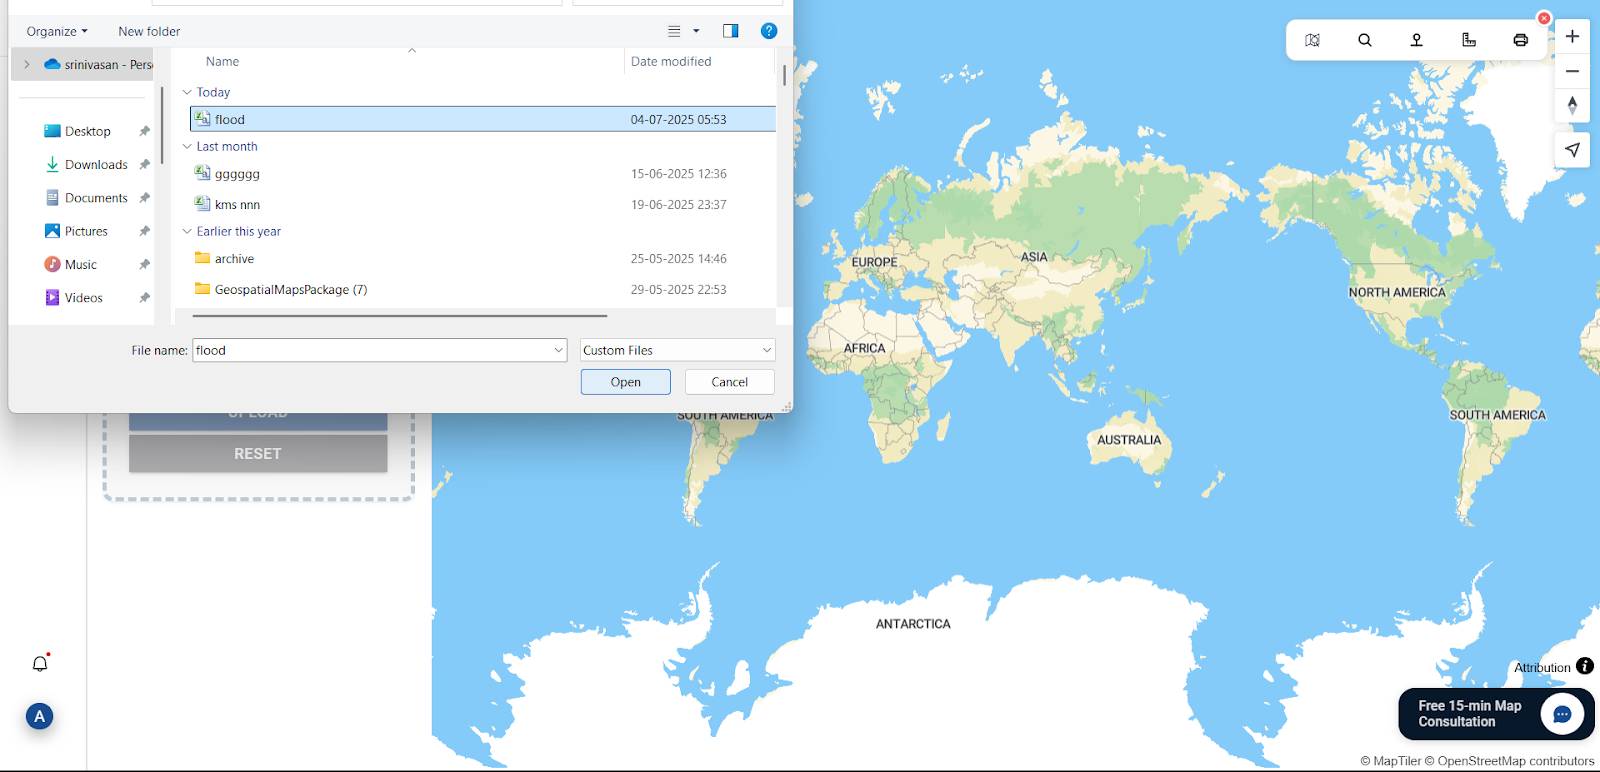
Step 2: Uploading flood Location Data
Go to the “Add/Upload File” section, then click on “Upload vector File” option, here upload your flood risk location file and click “Upload.”
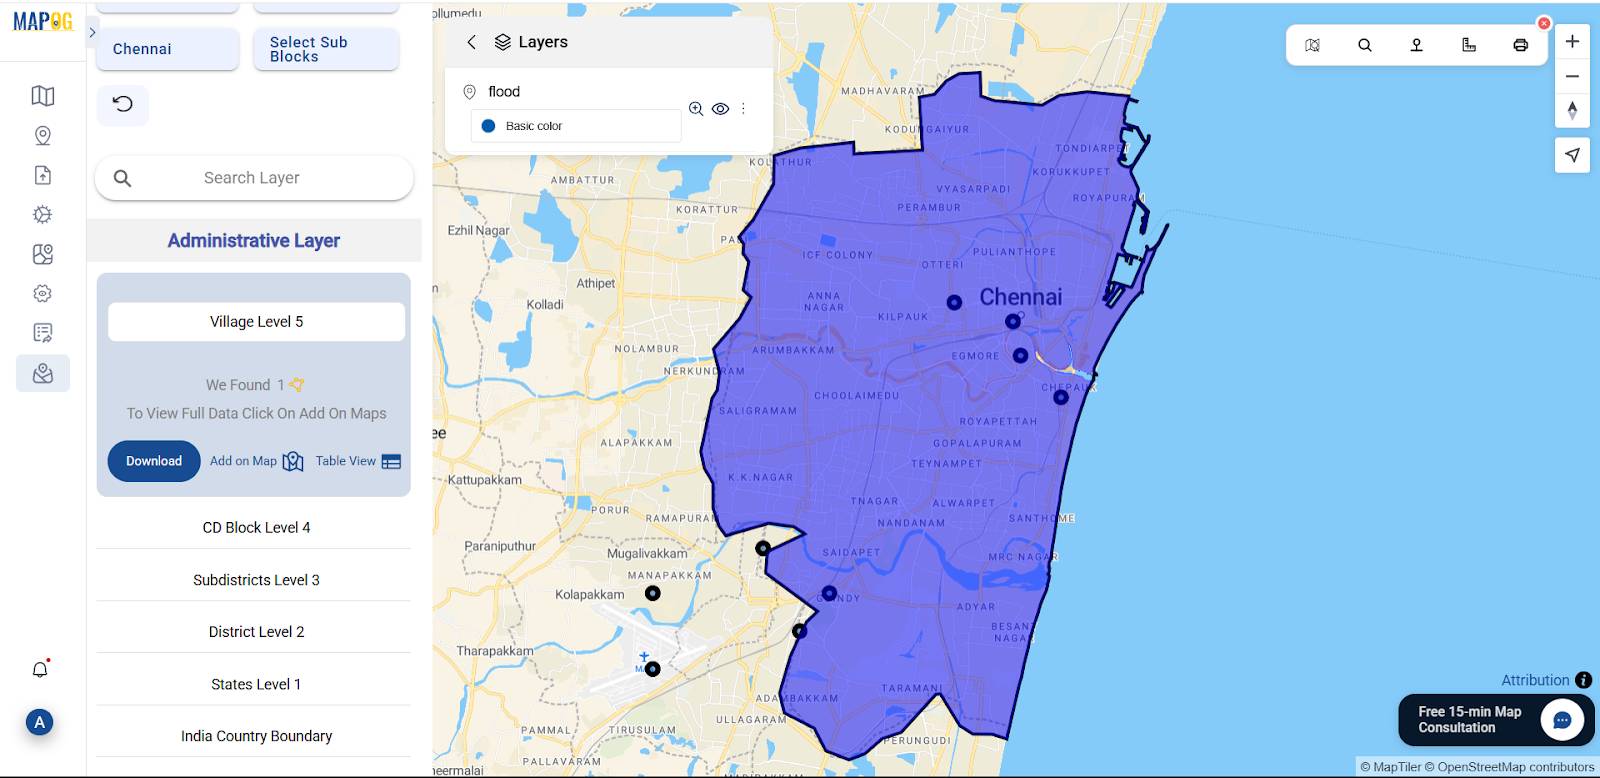
3. Load the Following GIS Layers
Then, open the GIS Data Library, choose your country → state → district→ blocks.
4. Transportation:
roads → This provides all road routes connecting villages.
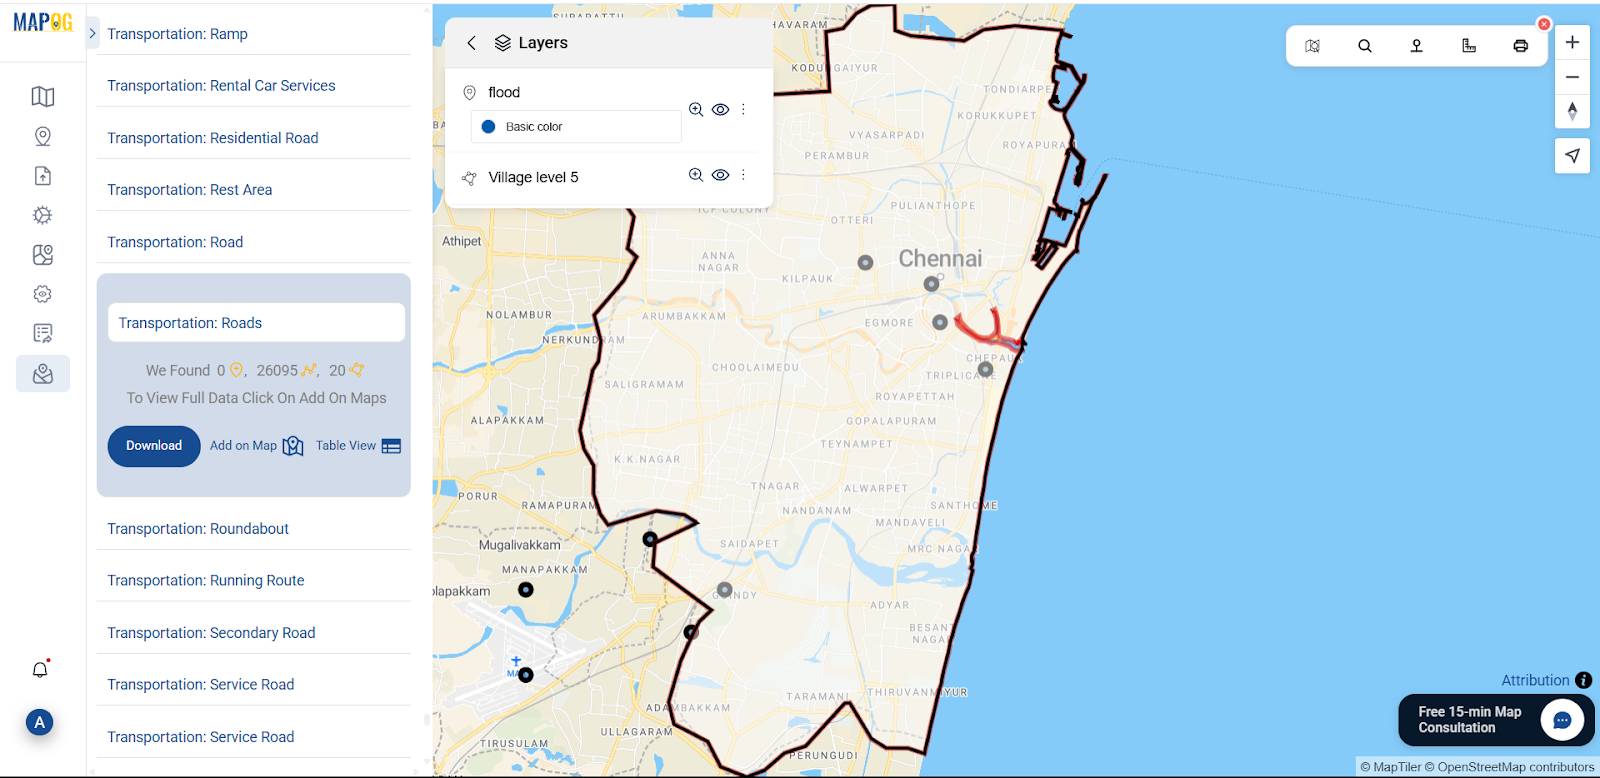
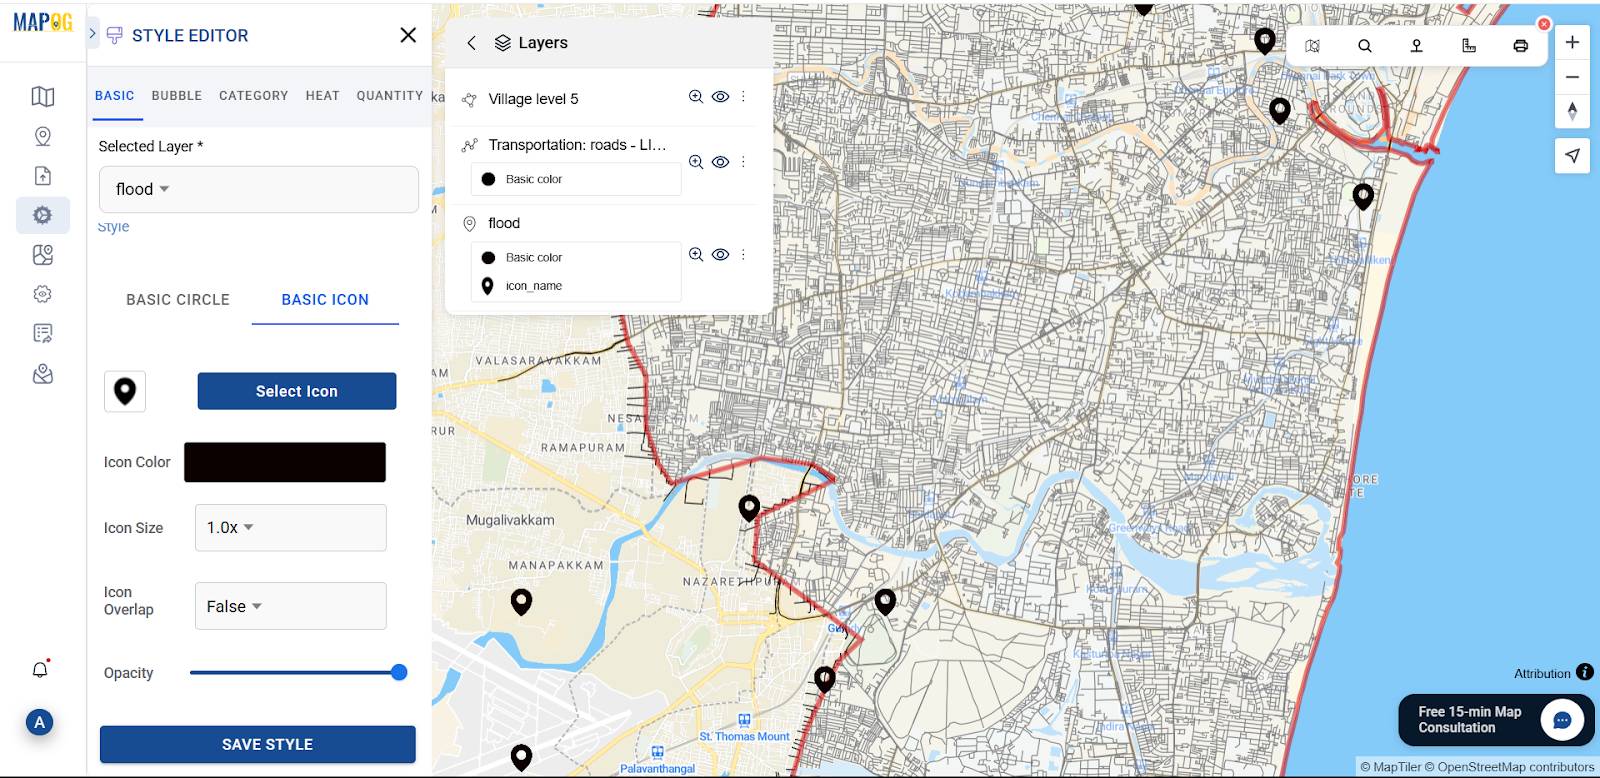
You can also customize your location logo by going to the “Style Layer” option.
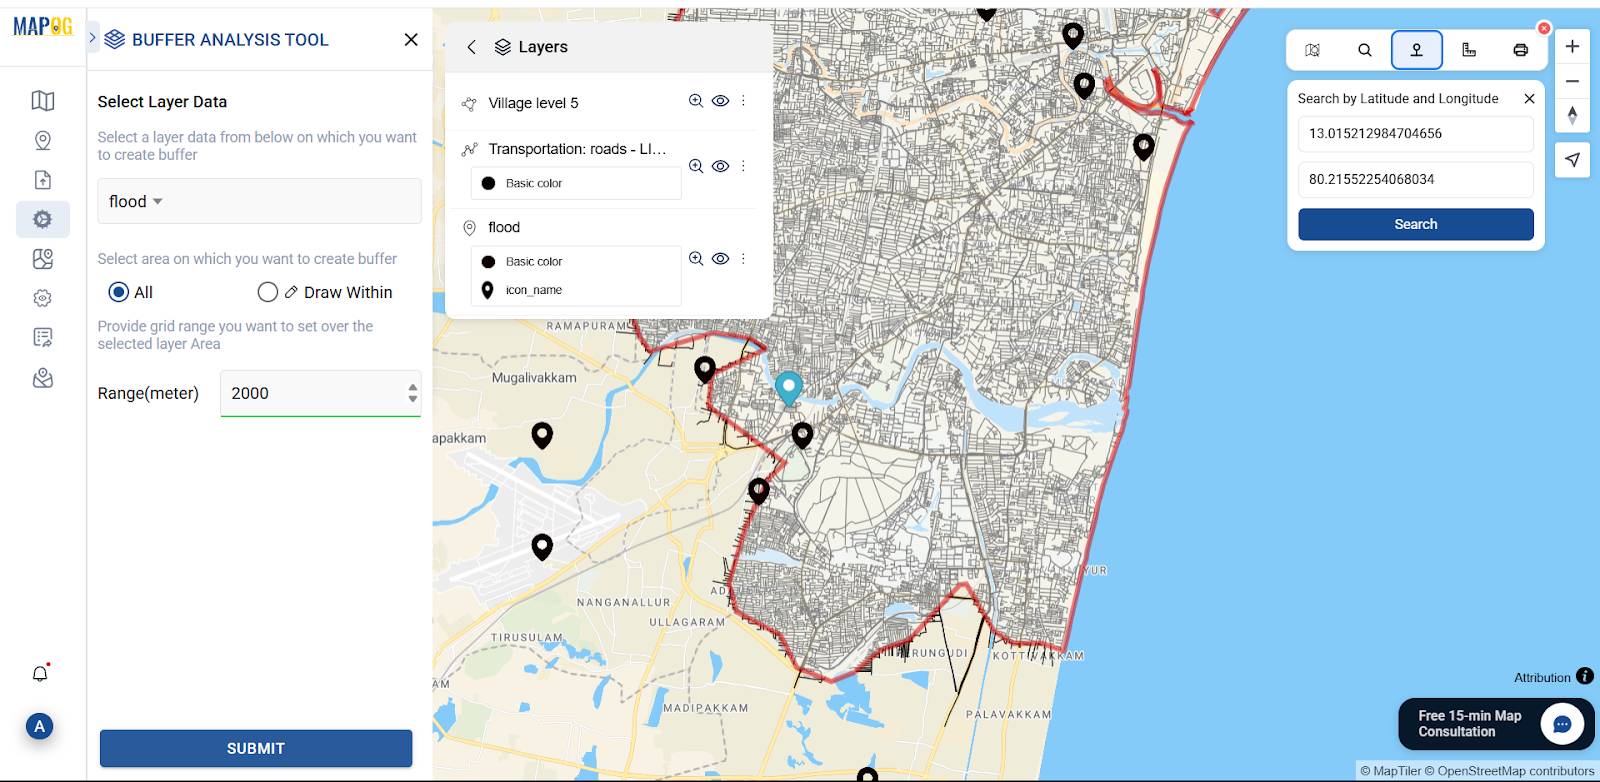
Step 5: Performing Buffer Analysis
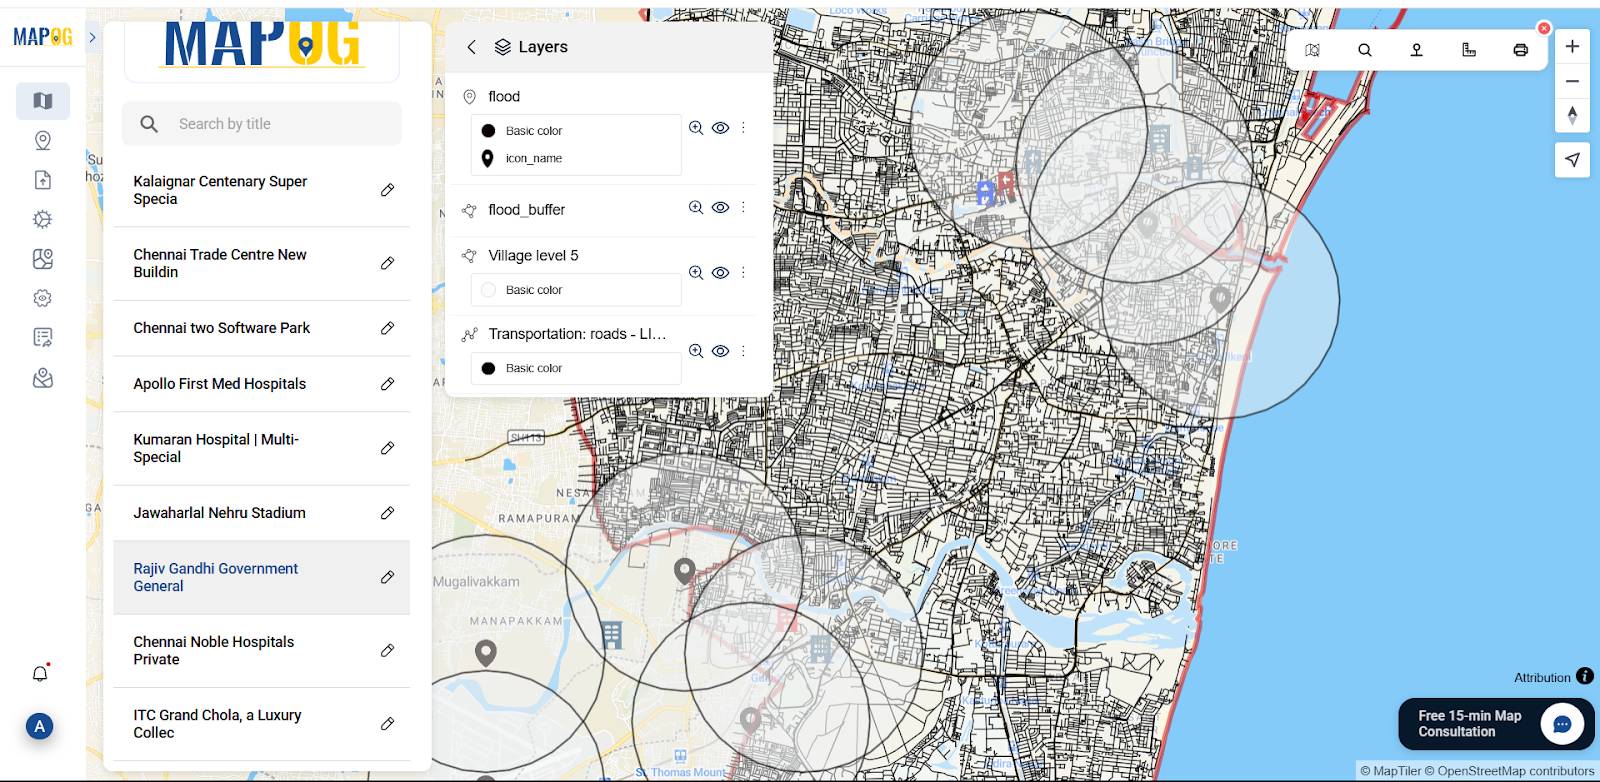
Go to the “Process Data” option and select “buffer tool.” In the Select Layer Data dropdown, choose your flood risk location file. Then, set the desired buffer range (e.g., 1000 meters) and click “Submit.” The system will generate the buffer zones around each flood location, and you’ll see the result displayed on the map.
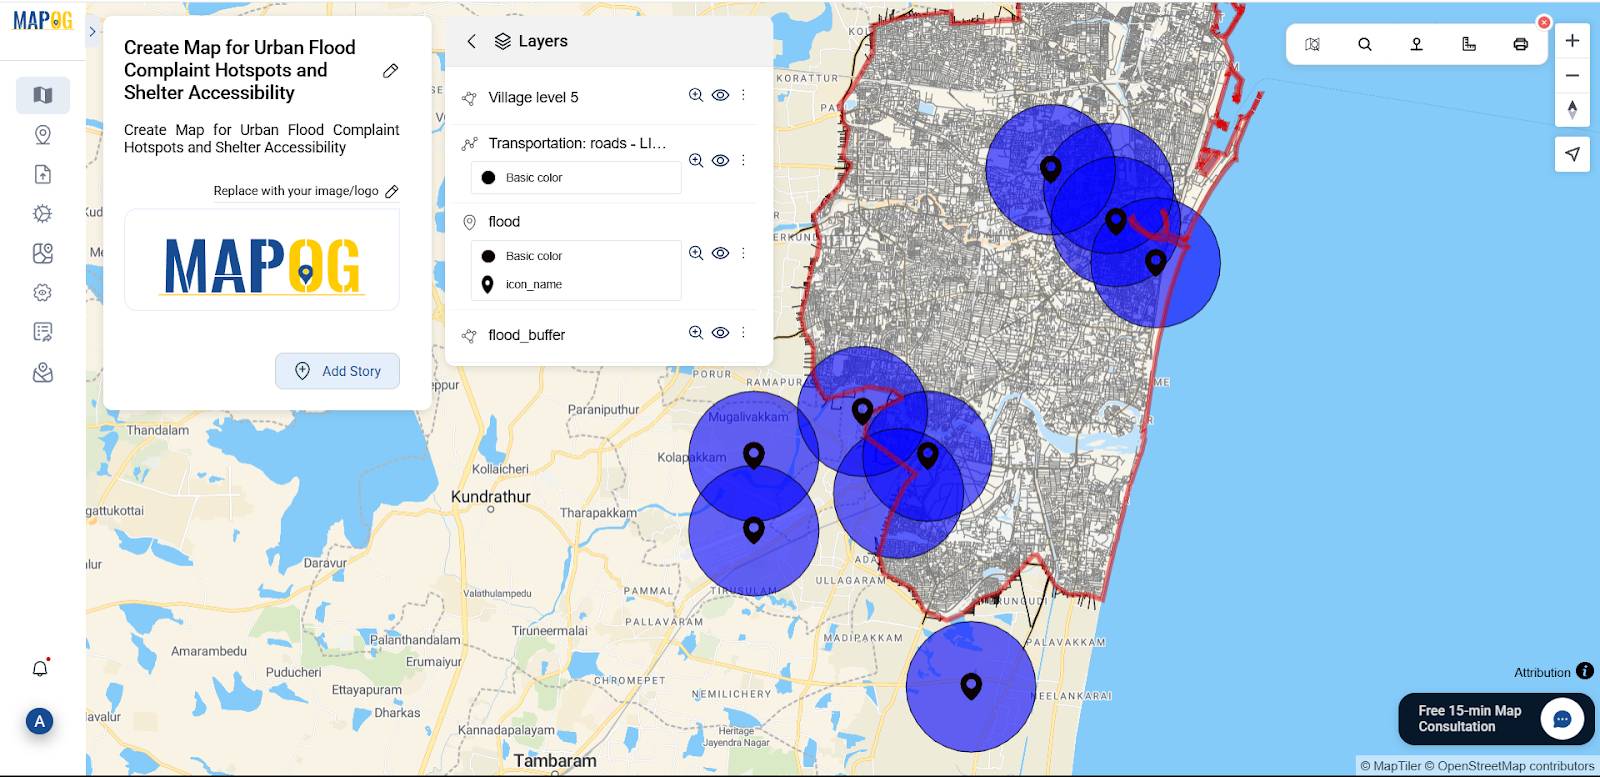
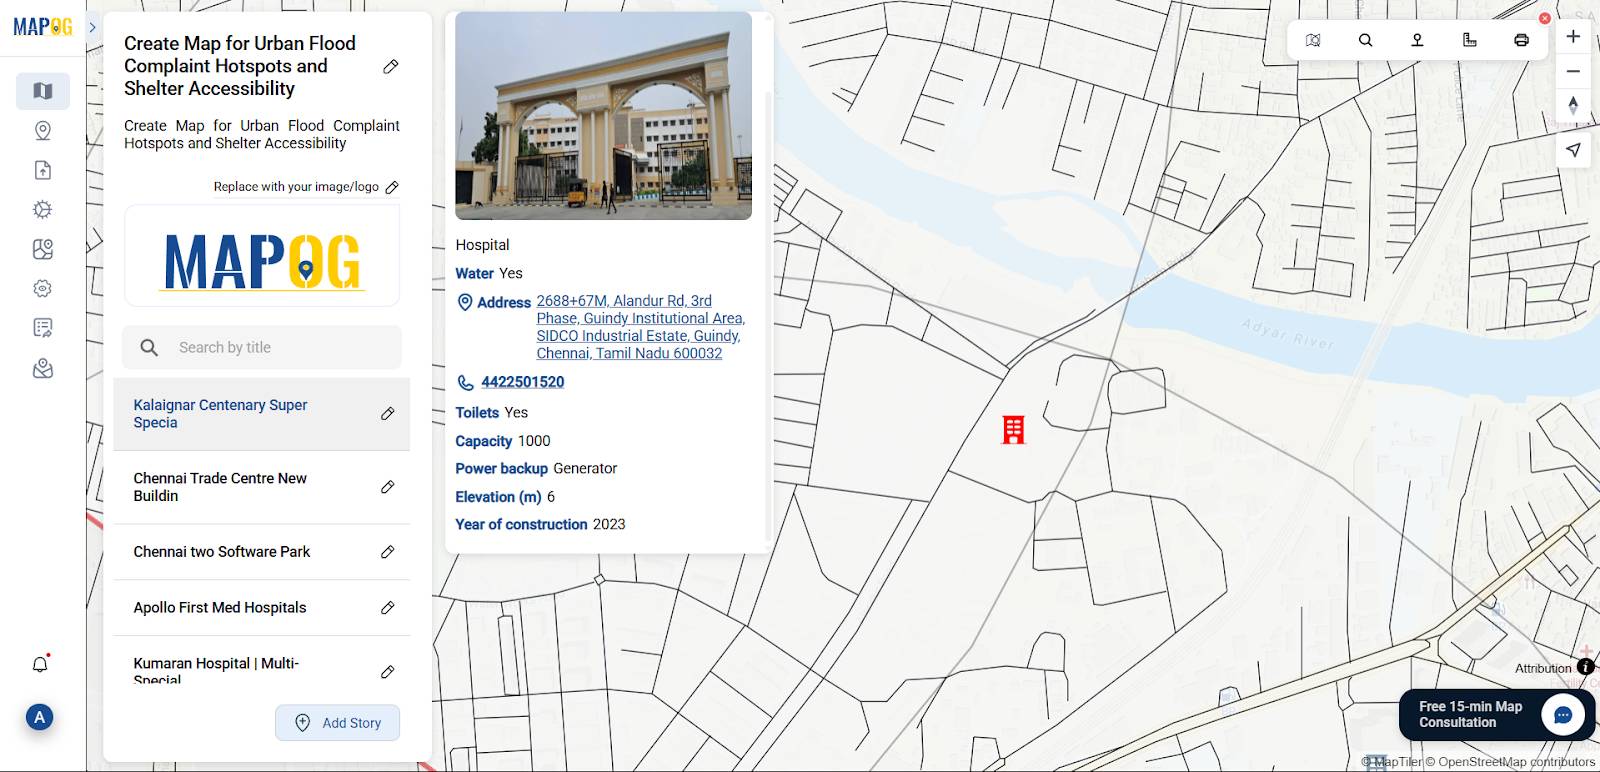
6. Add flood Shelter Points Manually
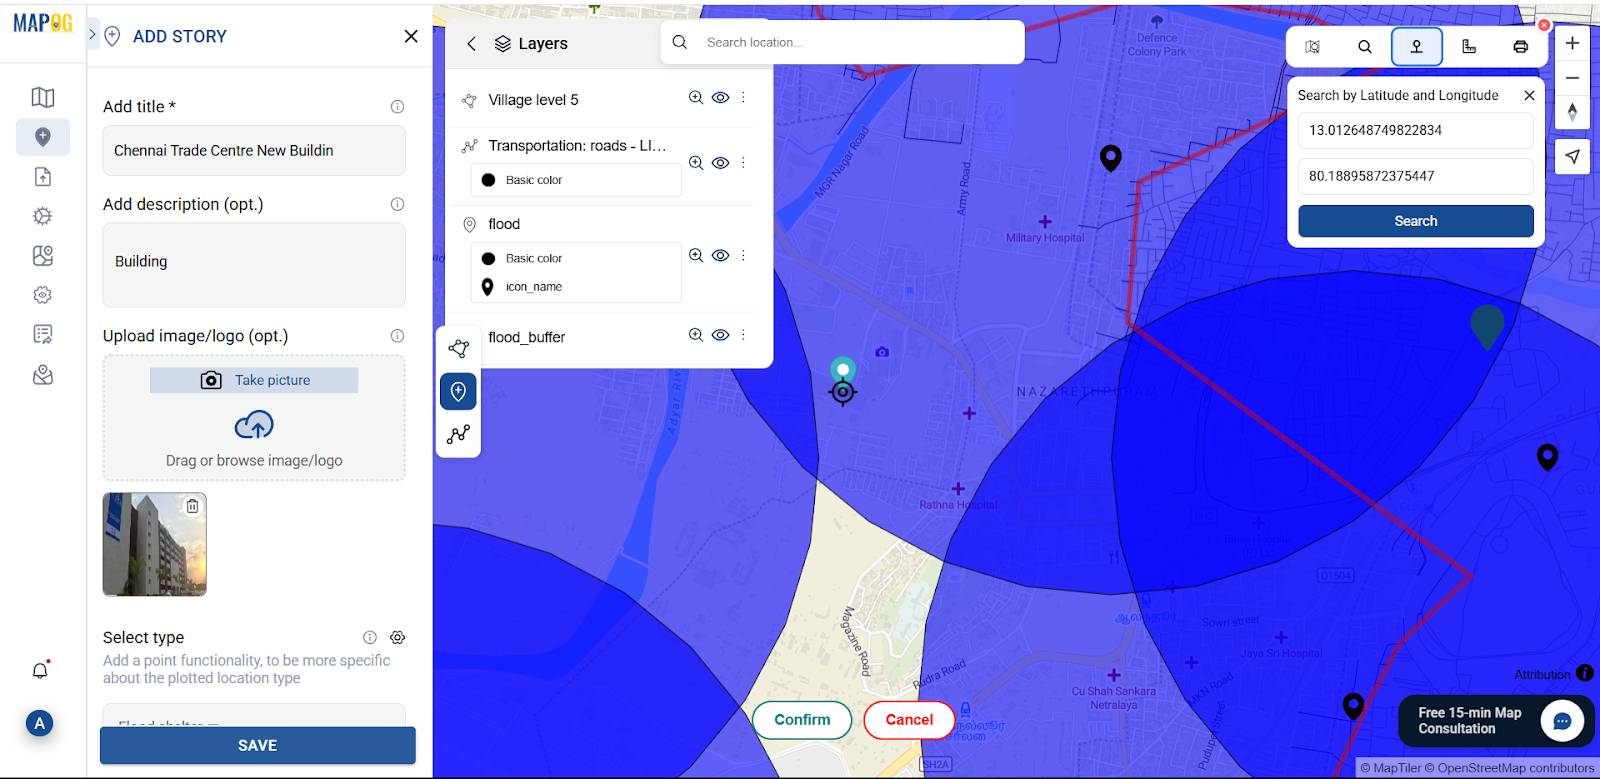
Now, use the “Add story” then select “add manually” then create flood shelter points inside the buffer zone based on distance from flood areas, near to road, medical facility and building capacity. Select flood shelter point by using Search by Latitude and Longitude and give conform to confirm your selection. Then give the title for your point, write a short description about it, and upload a suitable image.
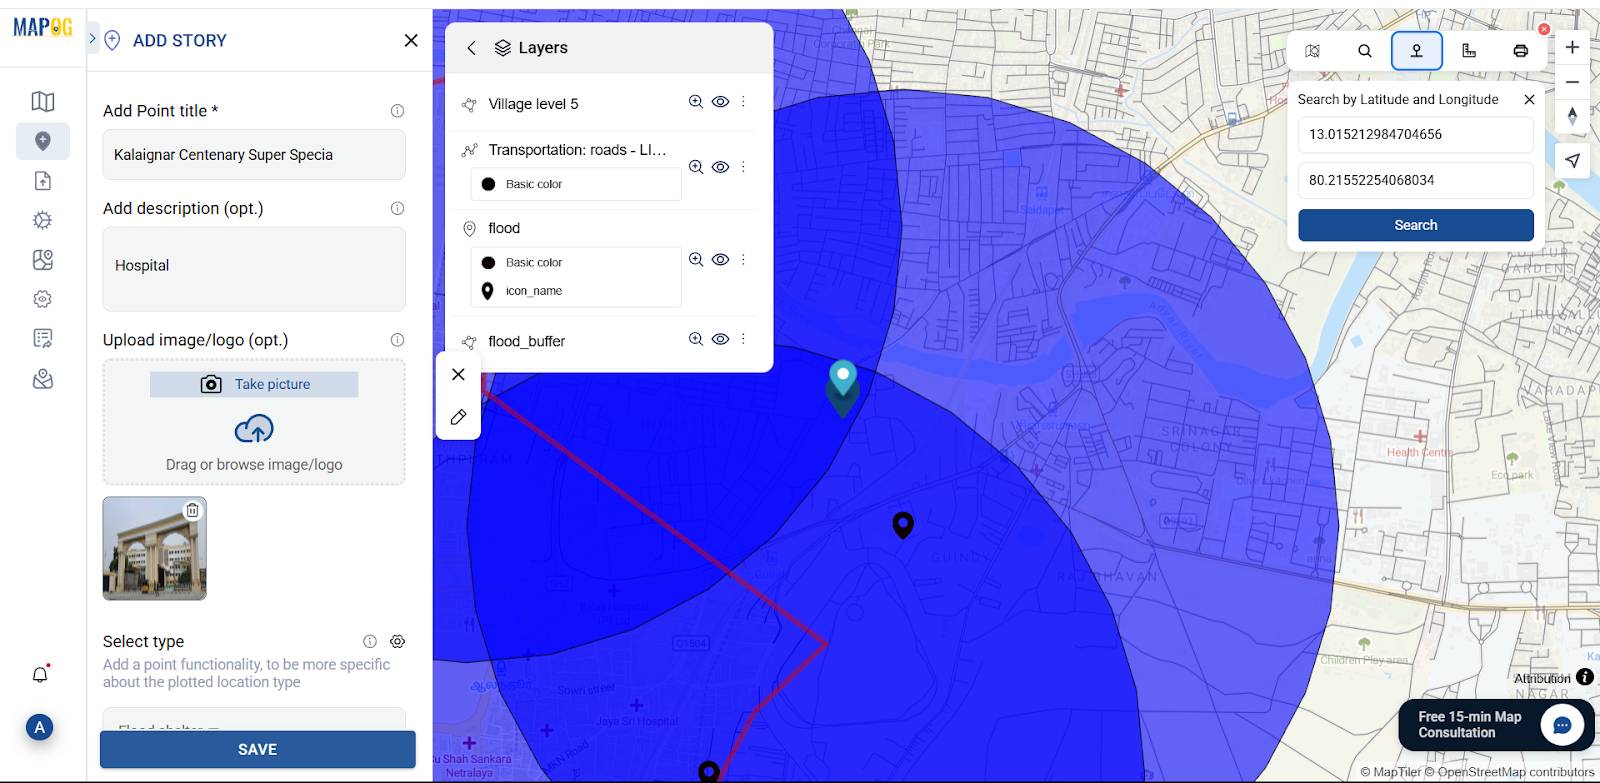
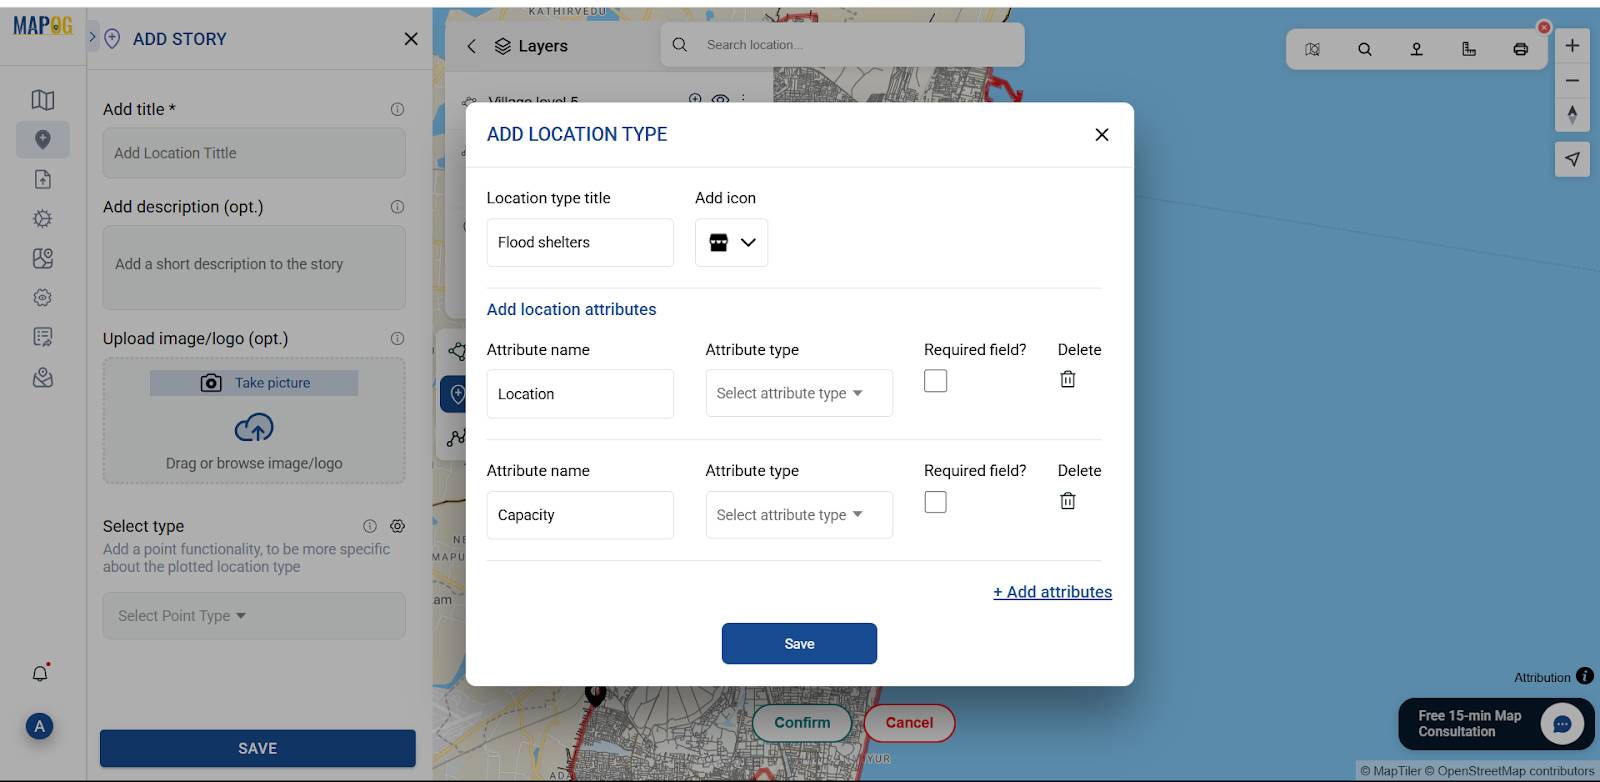
Using the select point type settings option, add location type such as “Flood Shelter” & add different relatable attributes to it, and later fill all the information there.
Similarly, add all locations to create detailed spatial shelter points.
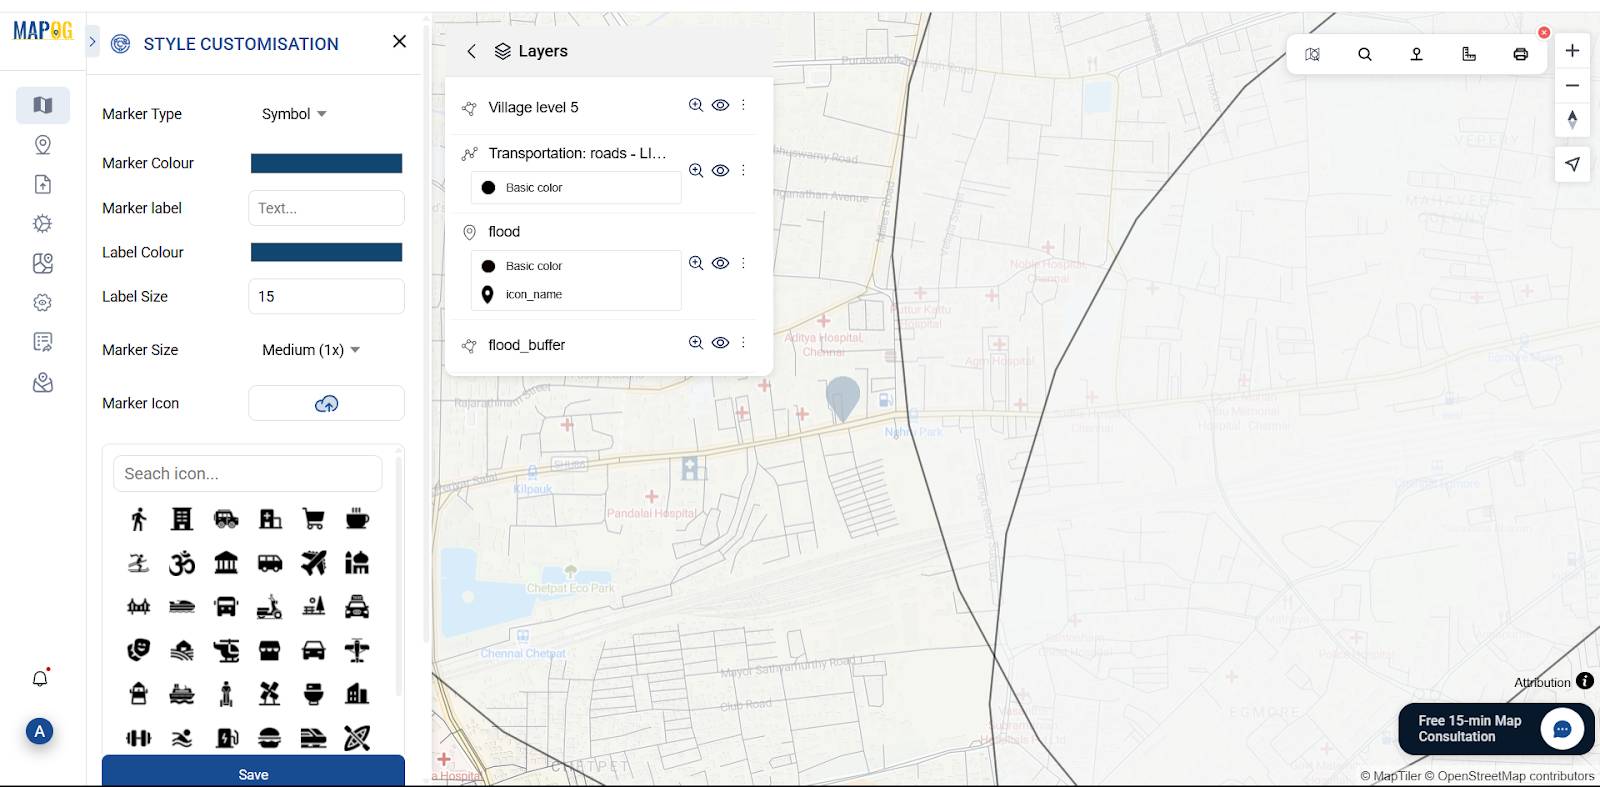
7. Customize Points for Visual Appeal
Label cyclone shelters and customize icons with emergency or shelter symbols using Point customization.
6. Share or Embed the Map Anywhere
Go to the ‘Preview and Share‘ option, you can keep it private or change the map type to ‘Public’. This will enable the share link.
Who Can Take Advantage of Urban Flood Hotspots Mapping
City Planners and Urban Authorities:
To identify vulnerable areas, plan flood mitigation strategies, and allocate resources effectively.
Disaster Management Agencies:
To develop preparedness plans, respond faster during emergencies, and guide people toward nearby shelters.
Municipal Corporations:
To prioritize maintenance of drains, culverts, and flood-prone infrastructure in high-risk neighborhoods.
Data Used
Conclusion:
Mapping Urban Flood Complaint Hotspots and Shelter Accessibility becomes both insightful and efficient with the help of MAPOG. You can visualize flood-risk areas, identify nearby shelters, and uncover gaps in coverage empowering city planners, emergency responders, and communities to make smarter, data-informed decisions.