Interactive Map Experience is redefining real estate marketing by transforming static brochures into dynamic, engaging tools. Instead of only relying on PDFs or plain text, buyers and tenants can instantly see how a property connects to its surroundings—schools, healthcare, transit, and green spaces. These interactive maps don’t just show the building; they showcase the lifestyle and convenience that come with it.
Similar to How to Map Rental Properties with Nearby Amenities Using Interactive GIS Maps, MAPOG allows you to go beyond static marketing material. This shift makes property marketing more immersive and engaging, helping clients make informed decisions while giving developers and realtors a powerful tool to stand out in a competitive market.
Key Concept: Why Turn Your Property Brochure into a Map?
An Interactive Map Experience helps real estate stand out in competitive markets. Every amenity, landmark, or transit connection becomes part of a bigger lifestyle story, helping buyers and tenants visualize not just the property, but also how it fits into their daily lives.
- Organize property details and nearby amenities visually
- Highlight schools, healthcare, shopping, and transit distinctly
- Then, add key details like travel times, capacity, or ratings
- Finally, filter by amenity type, lifestyle category, or distance from the property
Similar to How Real Estate Agents Use Maps to Sell Properties Smarter, MAPOG lets professionals embed live, location-based data—turning static brochures into decision-making tools.
Step-by-Step: How to Turn a Property Brochure into an Interactive Map on MAPOG
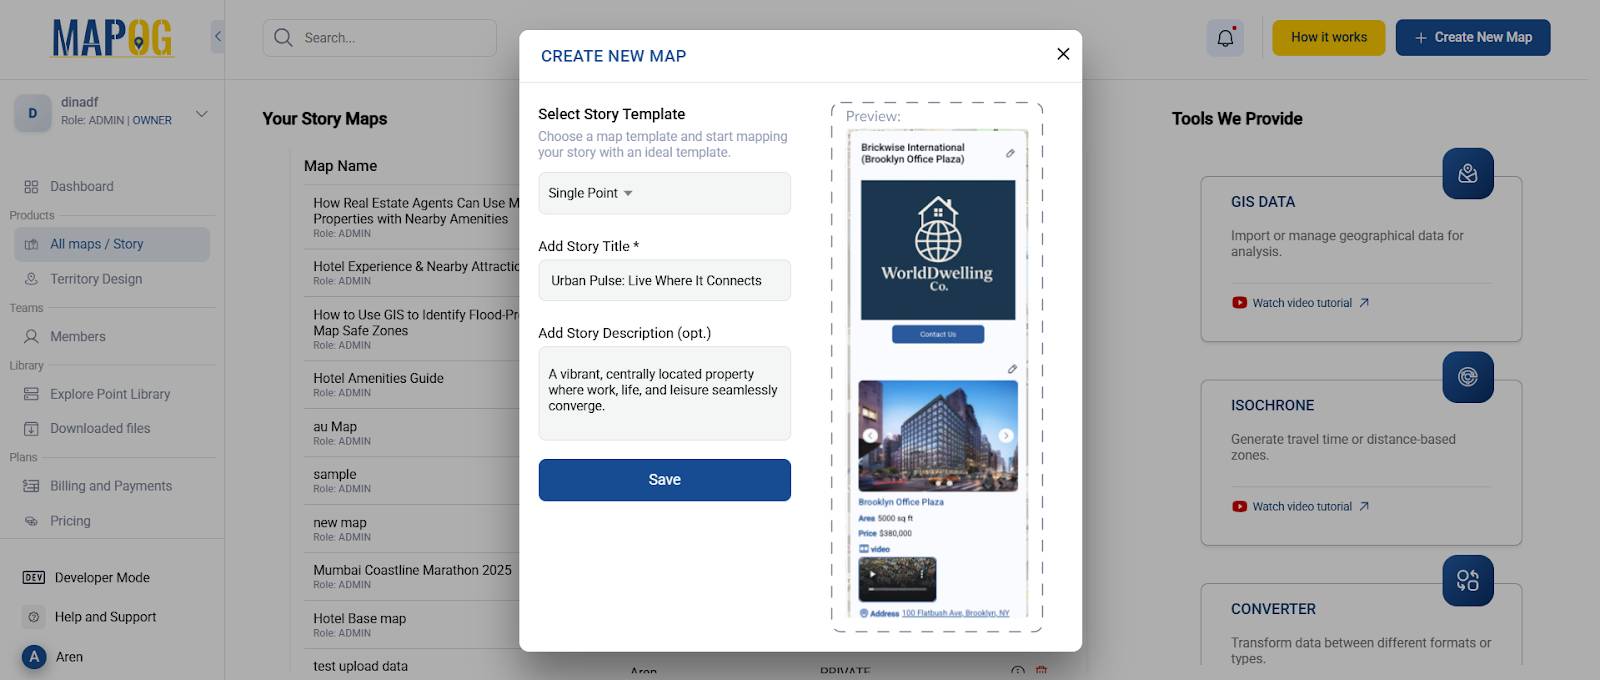
Step 1: Start a New Project
- Go to MAPOG → “Create New Map.”
- Select “Single Point Map” as your template.
- Give your project a title (e.g., Urban Pulse: Live Where It Connects ) and add a short description.
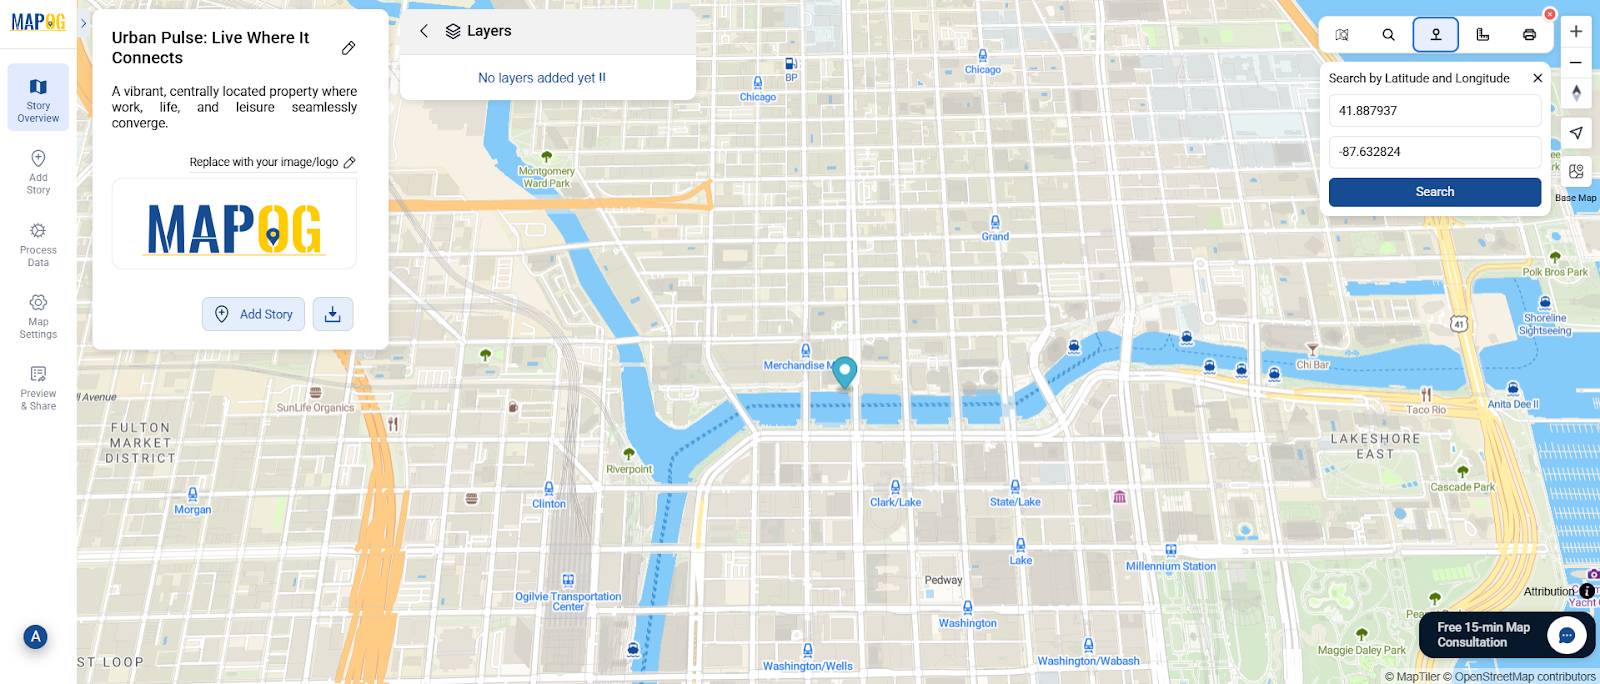
Step2: Add Story and Map the Property
- Locate property via search or latitude/longitude.
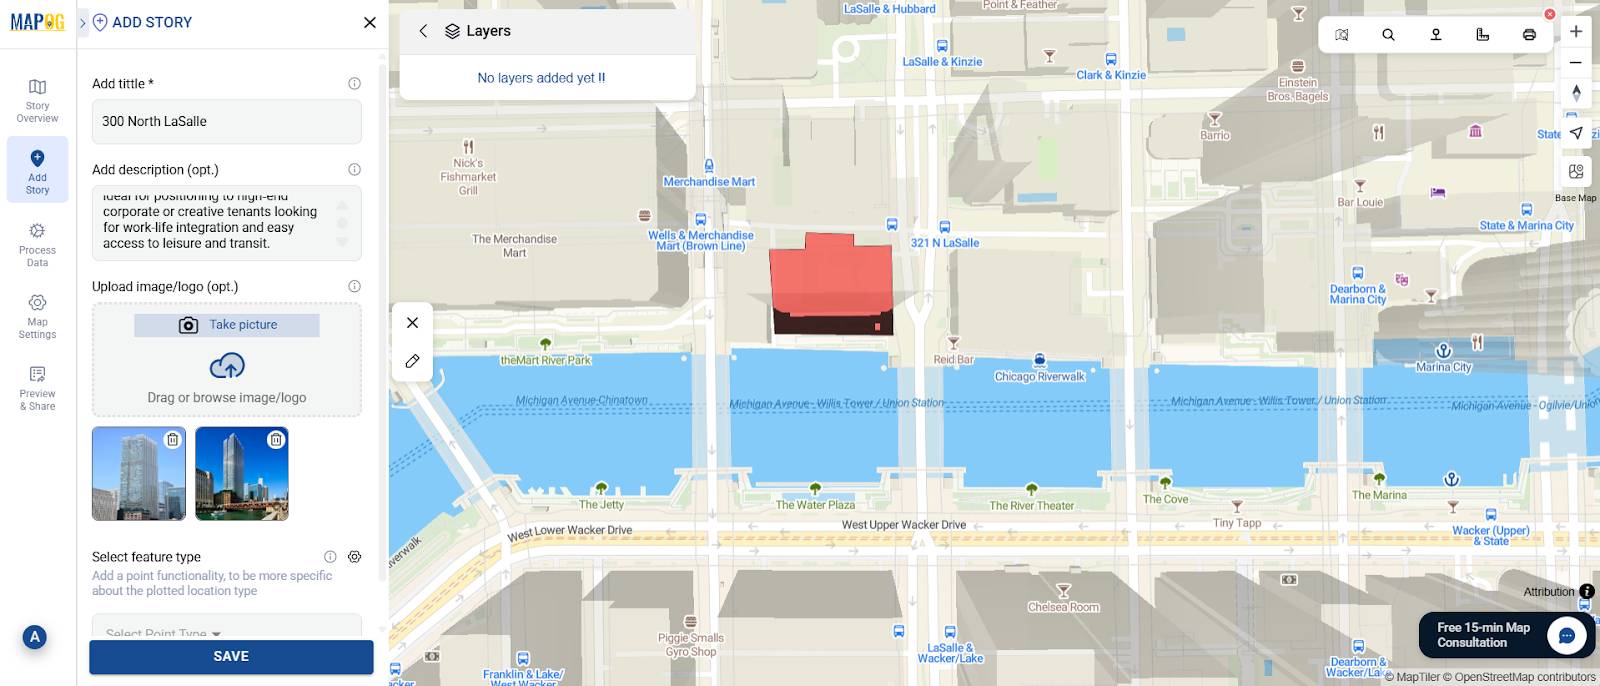
- Click “Add Story” → “Add Manually.”
- Then, use the polygon tool to outline the property boundary.
- Add the property title, description and upload brochure images.
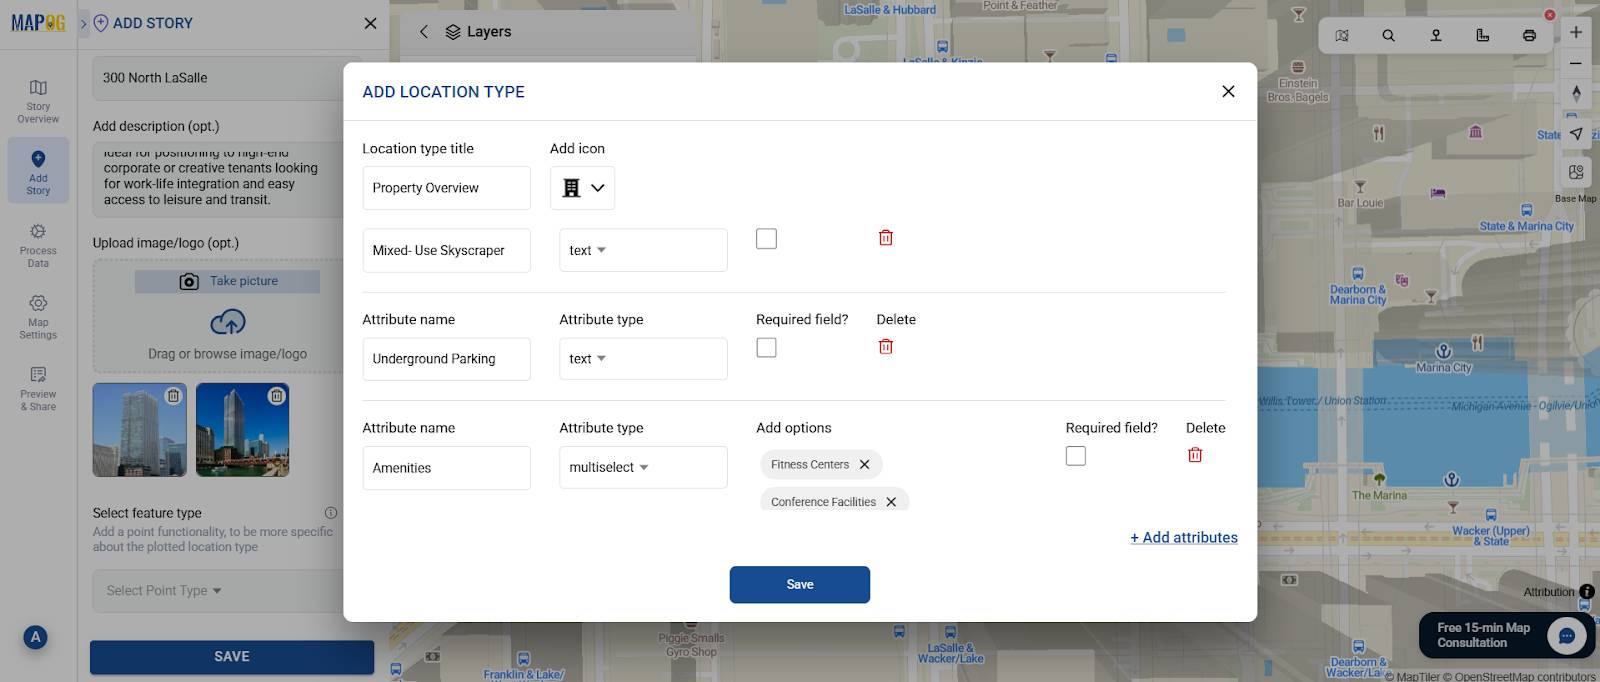
Step 3: Organize Property Details with Location Point Manager
Use Location Point Manager from Select Feature Type Settings to replace static text.
For example:
- Property Overview (Location Type Title)
- Building Function → Mixed-Use Skyscraper
- Prime Features → Underground Parking, Rooftop Garden, Co-working Spaces, Smart Energy System
- Amenities (multi-select: Fitness Center, Conference Facilities, etc.)
You can expand attributes further with details like price, status availability, furnishing status, or address. This transforms brochure content into rich, interactive data points.
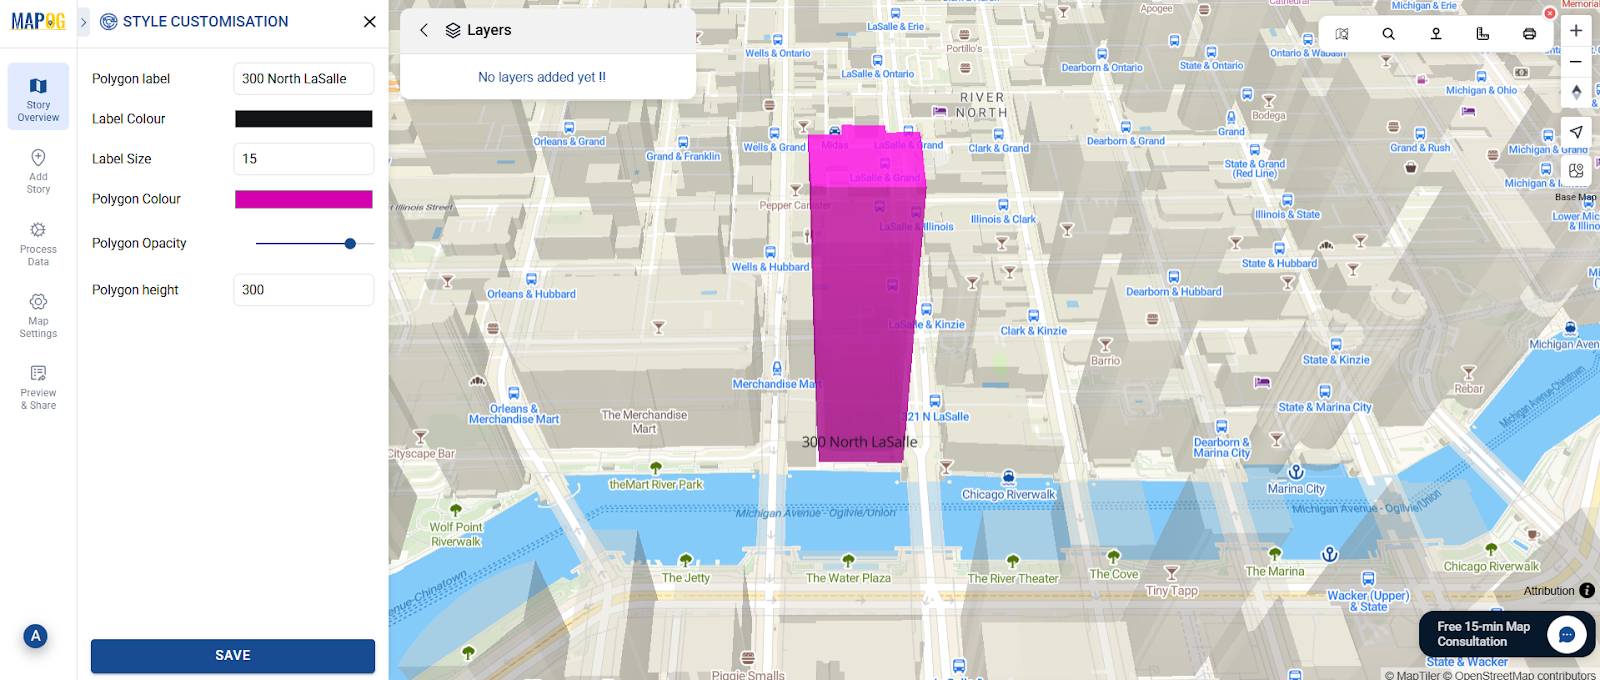
Step 4: Customize Visualization
- Open Polygon Customization (for mapped areas).
- Then, add a clear property label.
- Adjust opacity and height to make the property visually clear.
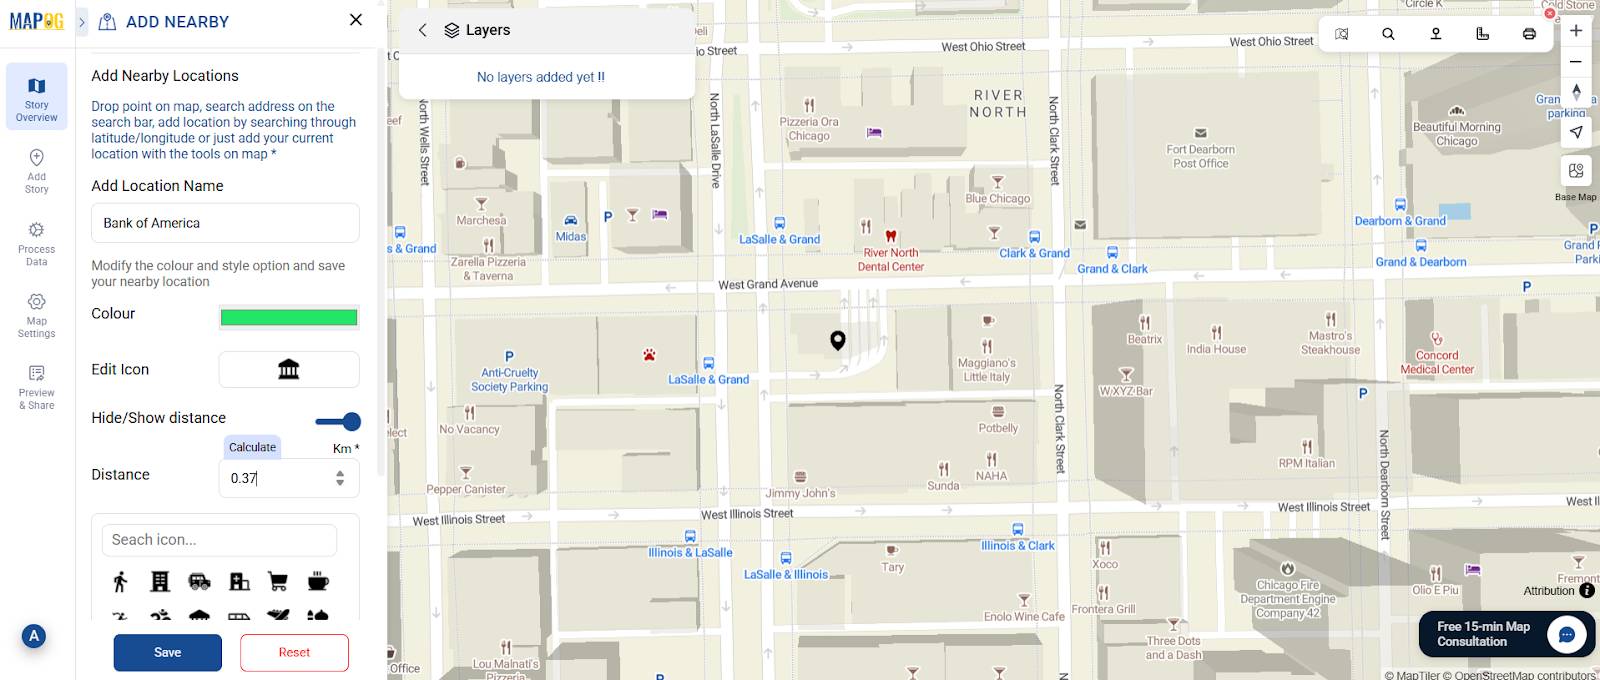
Step 5: Add Nearby Amenities
Bring the brochure’s “location advantage” to life:
- Use the Distance Measure tool to calculate how far schools, hospitals, malls, or transit stations are.
- Click “Add Nearby” → search or drop pins for each amenity.
- Add custom icons, names, and distances (e.g., Pharmacy – 500m, Metro – 1.2 km).
- Then, repeat for each property to provide context beyond the brochure.
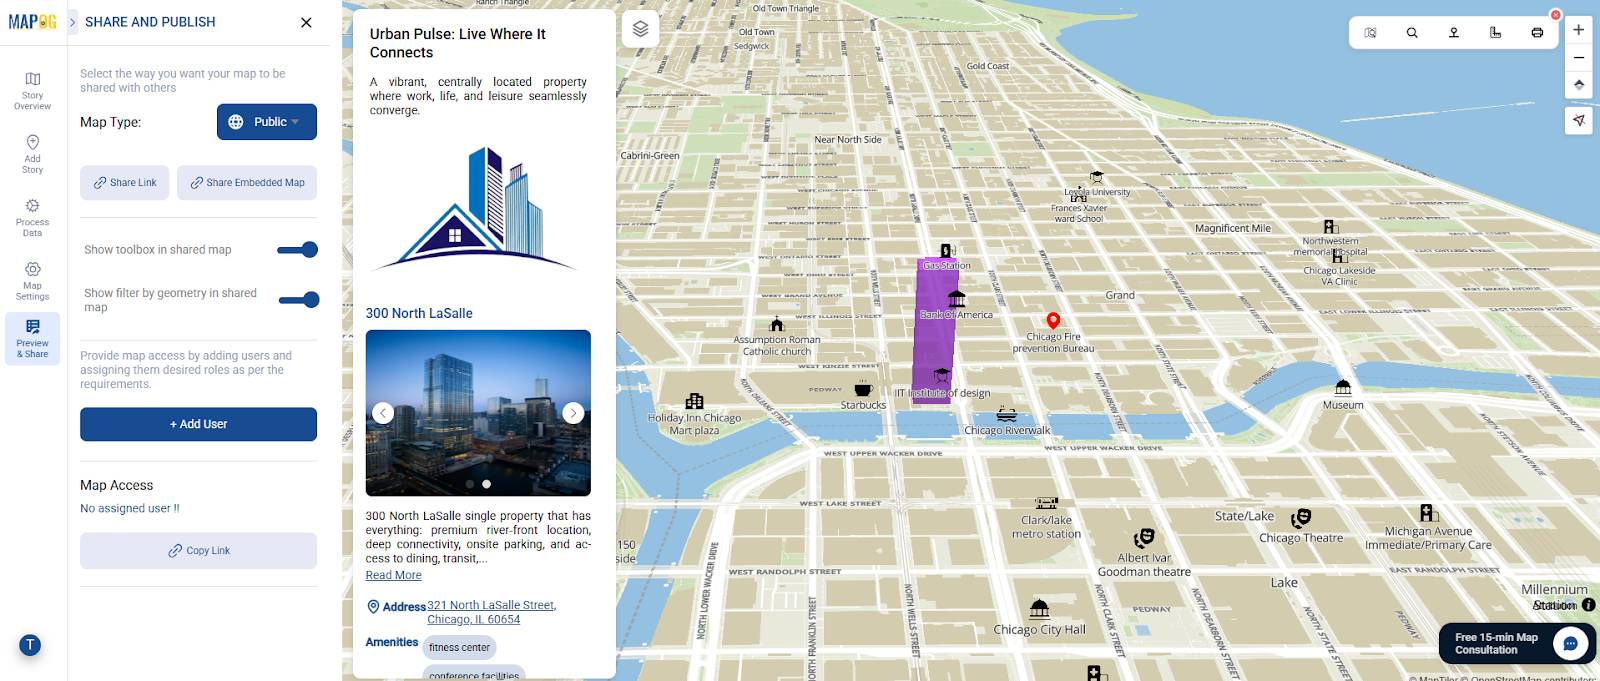
Step 6: Share & Publish Your Interactive Brochure
- Go to “Share & Publish.”
- Choose your audience: Public or Private.
- Share via a link, embed it on your WordPress property page, or publish to social media.
Industry Use & Benefits of Turning Brochures into Interactive Maps
Interactive maps are reshaping property marketing:
- Agents & Brokers present listings with higher visual impact.
- Developers showcase lifestyle connectivity to attract buyers.
- Planners & Investors evaluate urban context by layering infrastructure, land use, and accessibility.
For example, in Real Estate Map with Filters for Price, Location, and Property Type, static brochure details are transformed into dynamic, searchable insights. Users instantly compare options, visualize trade-offs, and make better decisions—all in one interface.
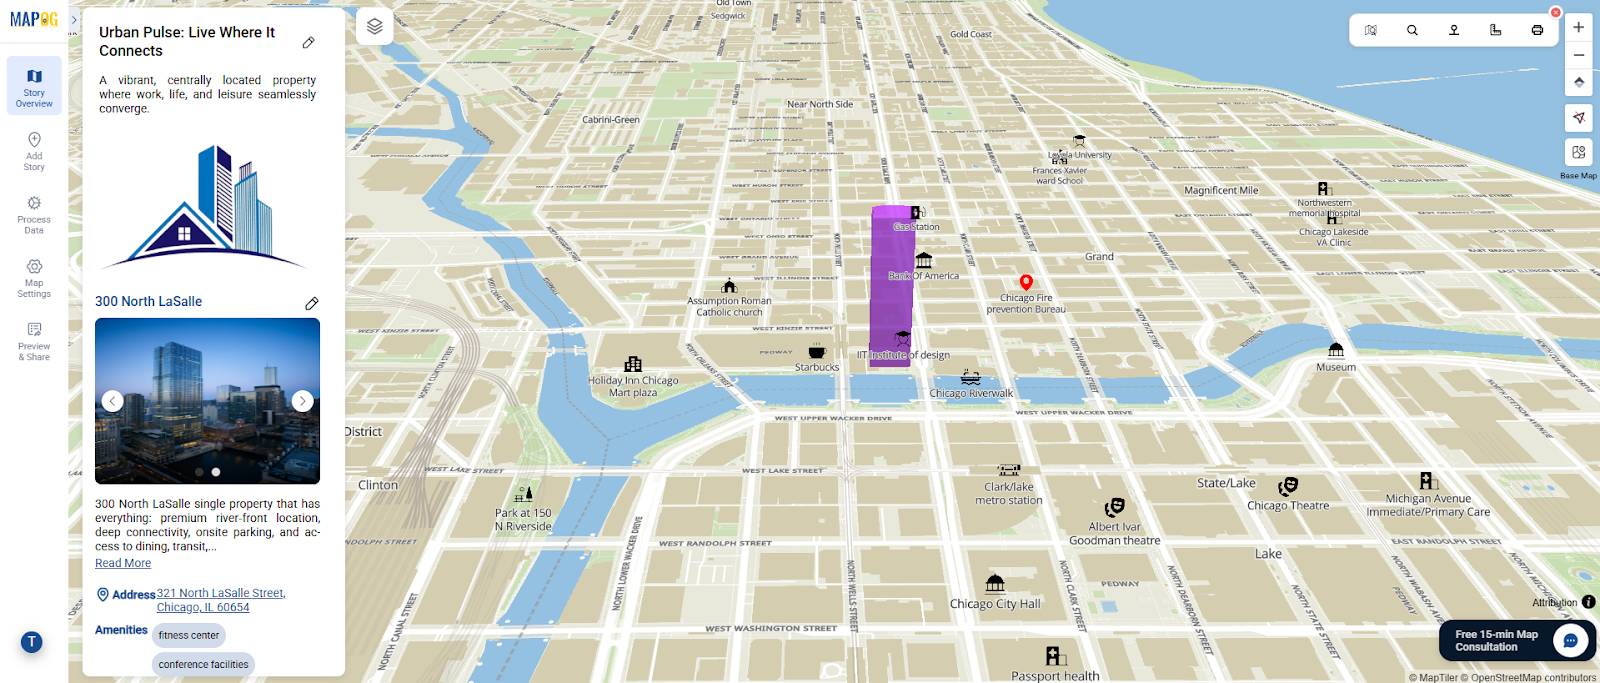
Conclusion
With MAPOG, turning a static brochure into an Interactive Map Experience is seamless. Features like Add Story, custom icons, polygon visualization, and proximity mapping ensure every property is more than a static listing—it becomes an experience. Hence, nearby amenities—schools, transit hubs, hospitals, and shopping centers—are instantly mapped, proving why the location holds a prime advantage. This transforms a simple brochure into a compelling narrative that highlights both the property and its urban context.