Grid-Based Analysis

Mapping Crime Hotspots

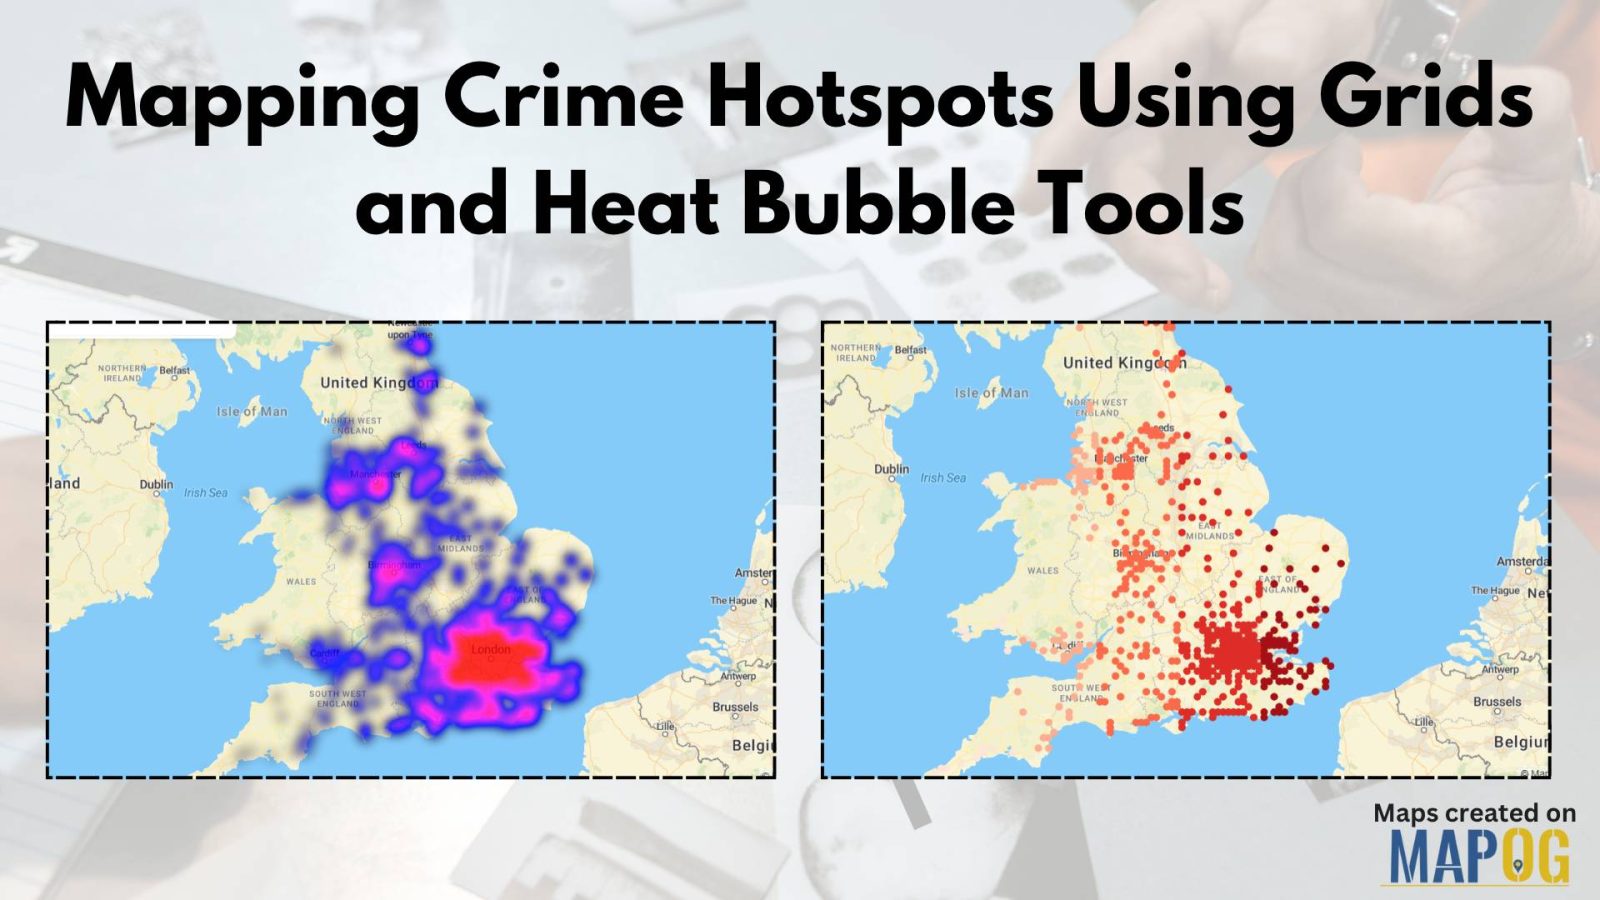
Mapping Crime Hotspots Using Grids and Heat Bubble Tools

Mapping crime hotspots is a critical approach in understanding and preventing urban crime. By visualizing clusters of criminal activity, law enforcement and urban planners can make informed, data-driven decisions. One modern way to do this effectively is through interactive mapping platforms that offer grid-based analysis and visual heat bubble styles—such as MAPOG’s intuitive tools. This … Read more

How to Create Grid Maps for Analysis?

Grid maps are essential for analysing spatial data, helping to break down complex information into smaller, manageable sections. Whether you’re working in urban planning, environmental studies, or business analytics, a well-structured grid map enhances data visualisation and decision-making. In this guide, we’ll explore how to create grid maps effectively and introduce MAPOG’s Create Grid Tool, … Read more