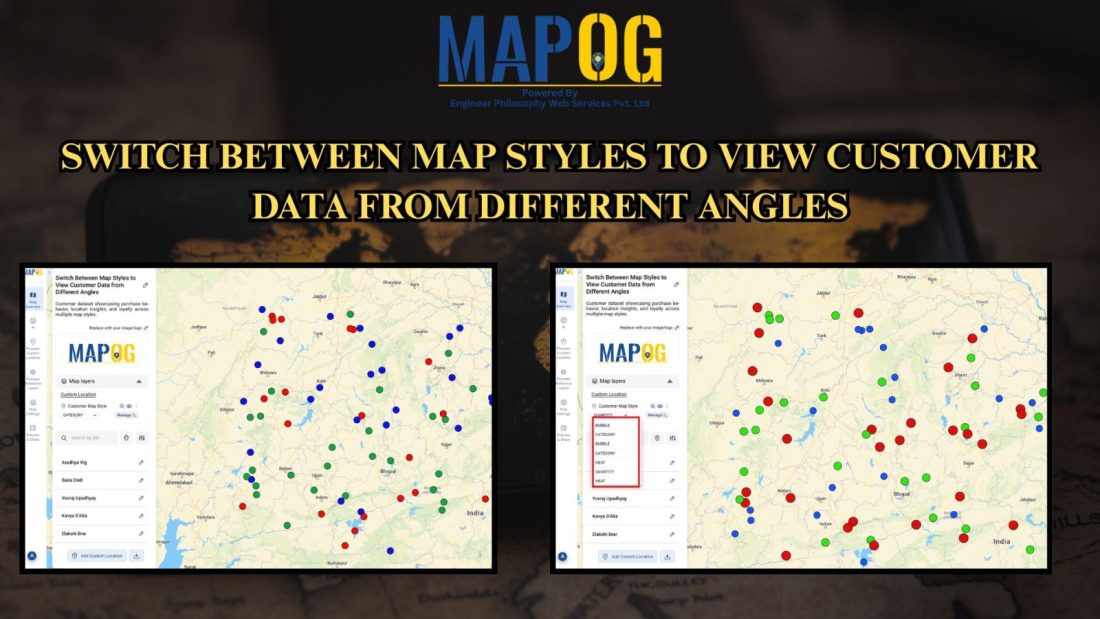
Switch Between Map Styles to View Customer Trends, Hotspots & Spending Patterns
Transform raw data into interactive visuals showing customer locations, spending, and trends. Furthermore, Switch Between Map Styles reveals interactive map insights like top buyers, regional demand, and performance gaps, enabling faster, data-driven decisions without coding. Key Concept: Switch Between Map Styles However, by smoothly Switch map styles, you can easily explore one dataset from multiple … Read more