In real estate, using real estate map tools helps agents present not just the property, but its location benefits too. More agents now use interactive maps to help buyers understand not just the home, but its surroundings—like nearby parks, schools, transit, and conveniences.
Embedding maps into property listings makes websites more engaging. When buyers can explore a location visually, they spend more time on the page, feel more confident, and act faster. This guide shows how real estate professionals can use MAPOG to turn listings into smarter, location-based stories.
Key Concept: Why Turn a Property Listing into a Map-Based Story?
A mapped listing is more than just location—it’s context. With real estate map tools, agents can go beyond static photos or plain descriptions, helping buyers understand how a home fits into its surroundings. Each pin represents lifestyle, connectivity, and long-term value.
With real estate map tools like MAPOG, agents can create location-rich narratives. Much like how GIS is used to identify high-growth investment zones, map-based listings help buyers assess value by visualizing proximity to amenities, infrastructure, and development corridors.
Step-by-Step: How to Build a Real Estate Story Map on MAPOG
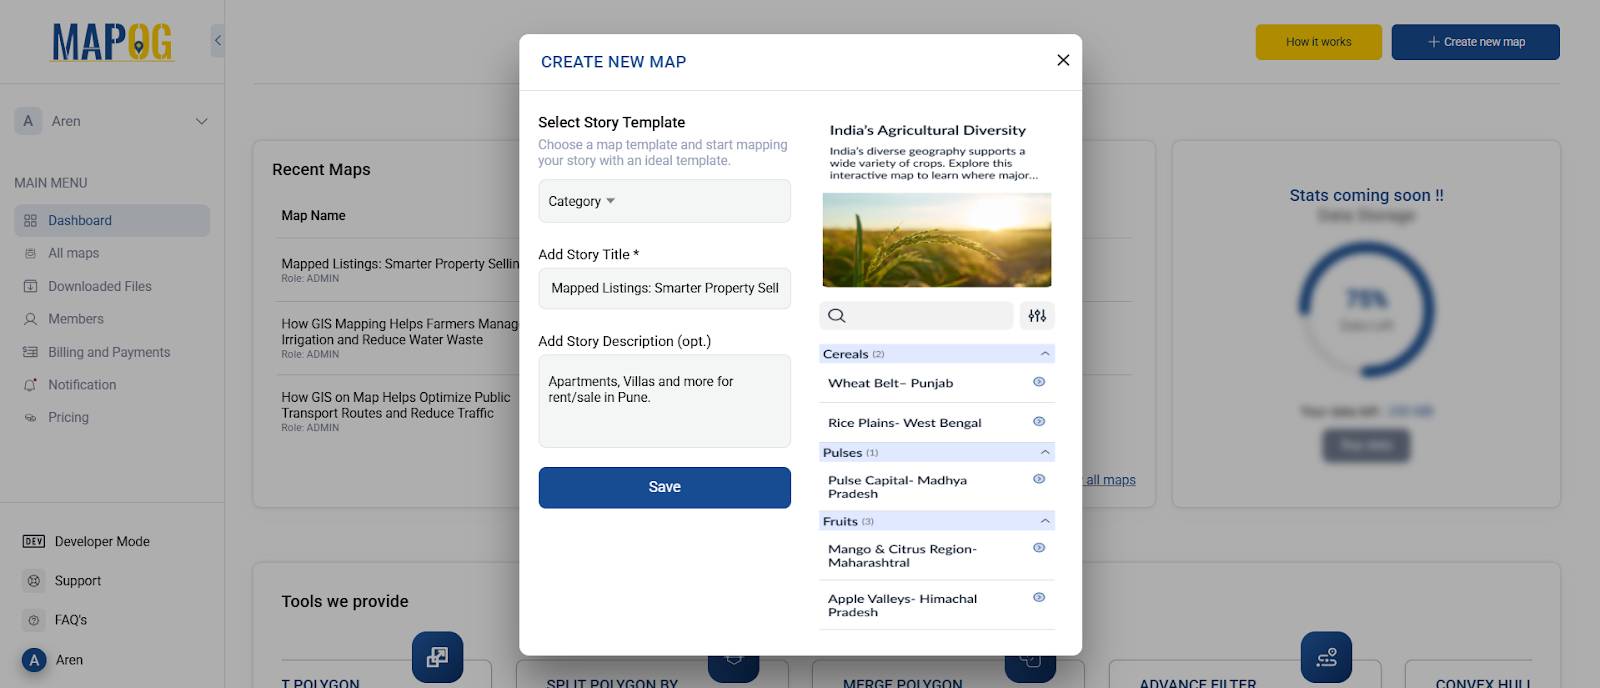
Step 1: Start a New Project
- Go to MAPOG and Click “Create New Map”.
- Select “Category Map” as template.
- Give your project a title & add a brief description explaining what the map will showcase.
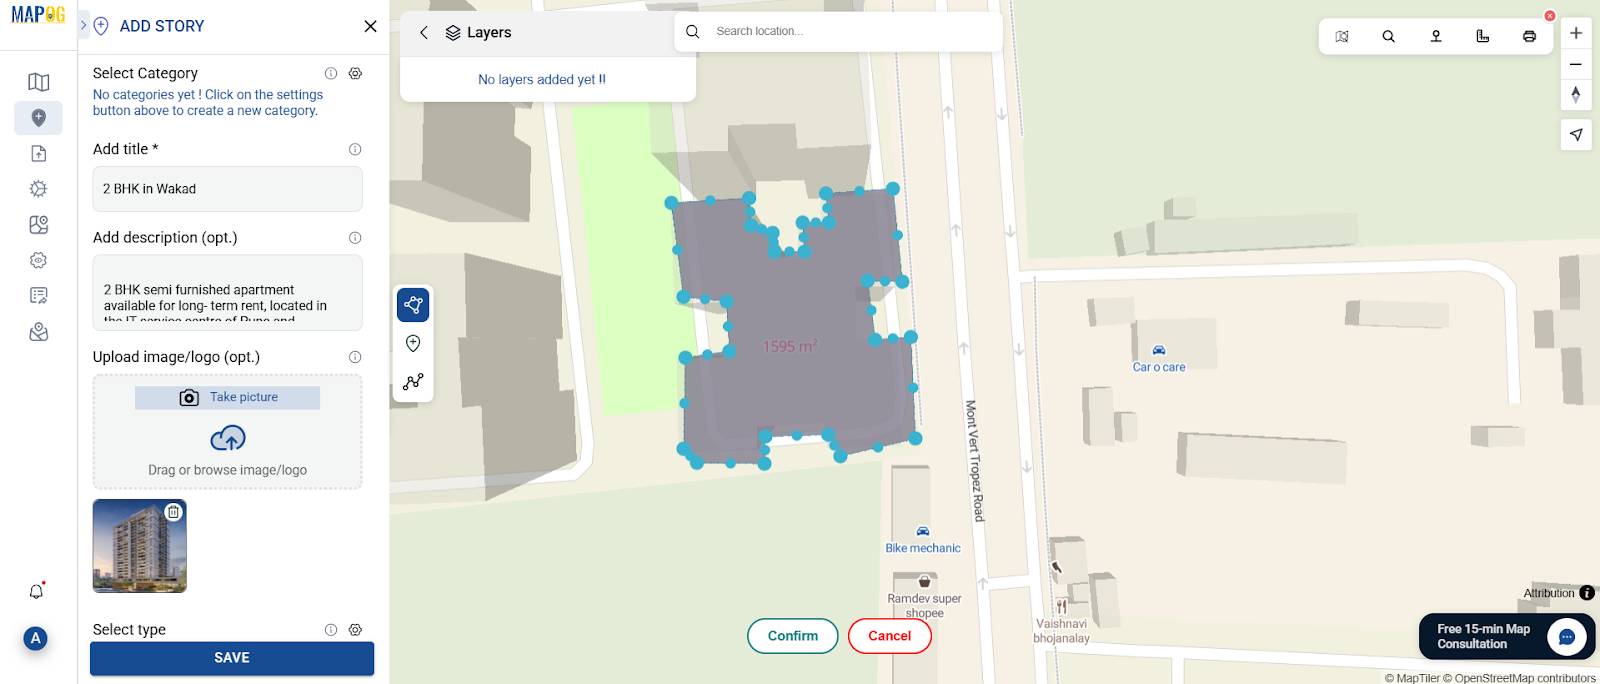
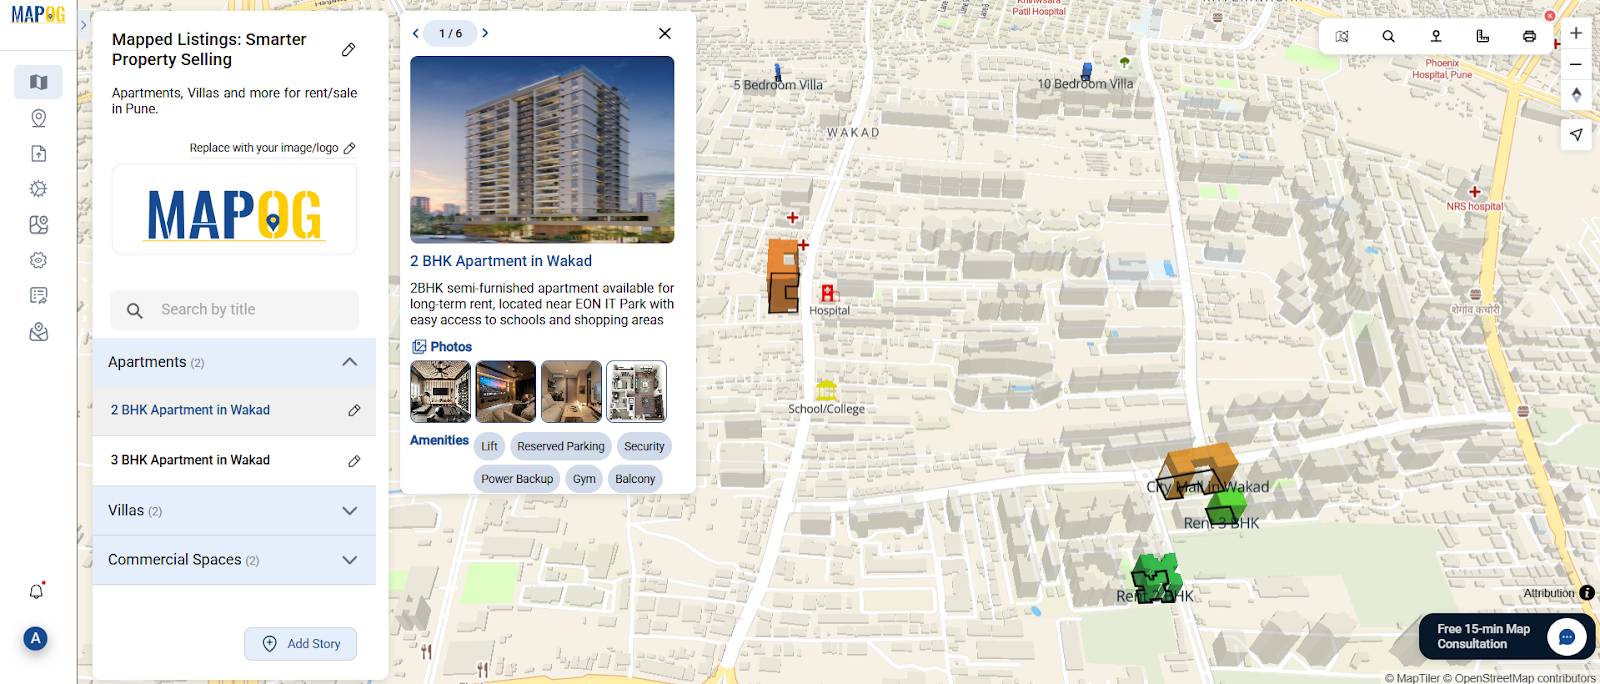
Step 2: Add Story and Map the Property
- Use the search bar or manually locate the property using coordinates options.
- Click “Add Story” then “Add Manually”, then toggle to the polygon tool to draw the property boundary.
- Then, enter the title, a short description, and upload an image.
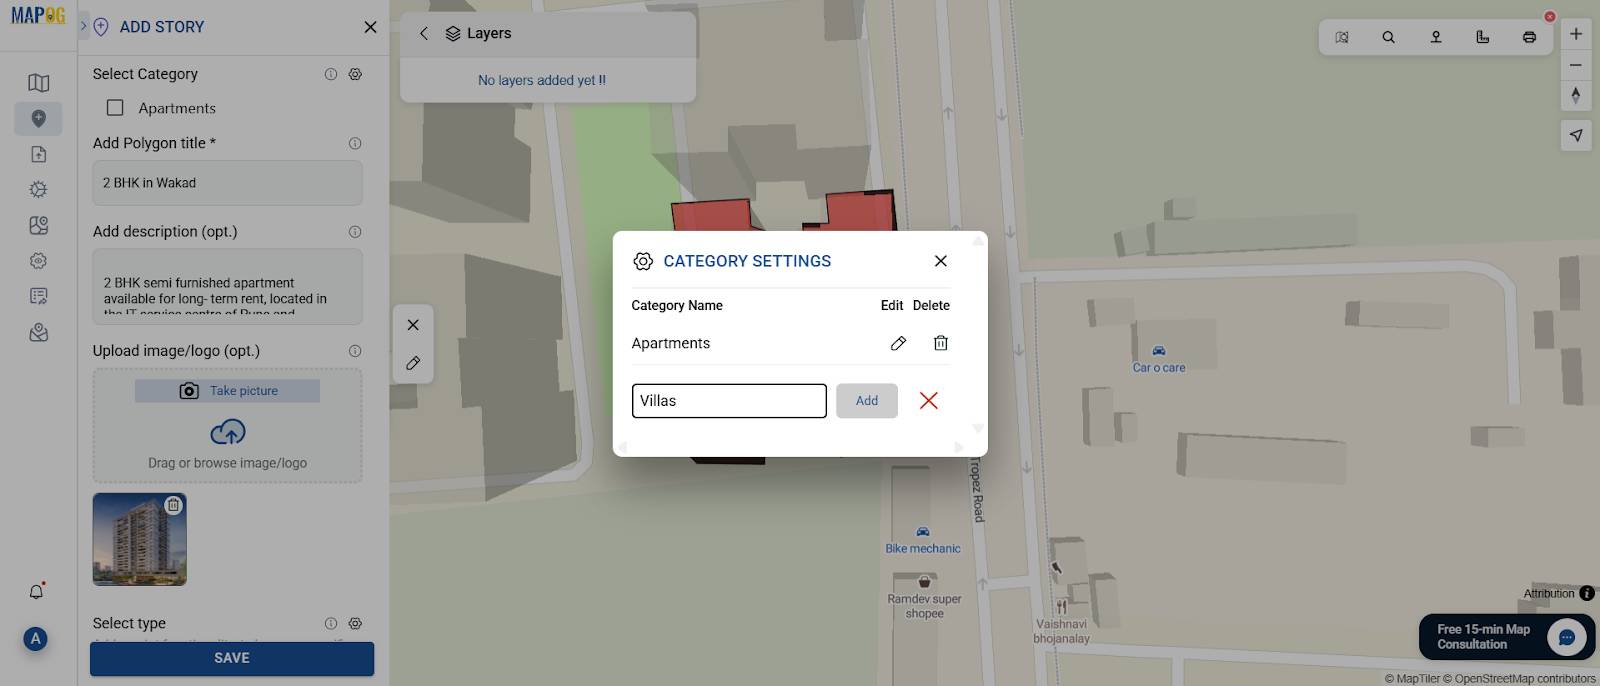
Point 3: Create Property Categories
Click on the “Select Category” ⚙️ icon in the side panel.
Add property categories, such as:
- Apartments
- Villas
- Commercial Spaces
- Plots/Land
Then assign the suitable category to each property based on location.
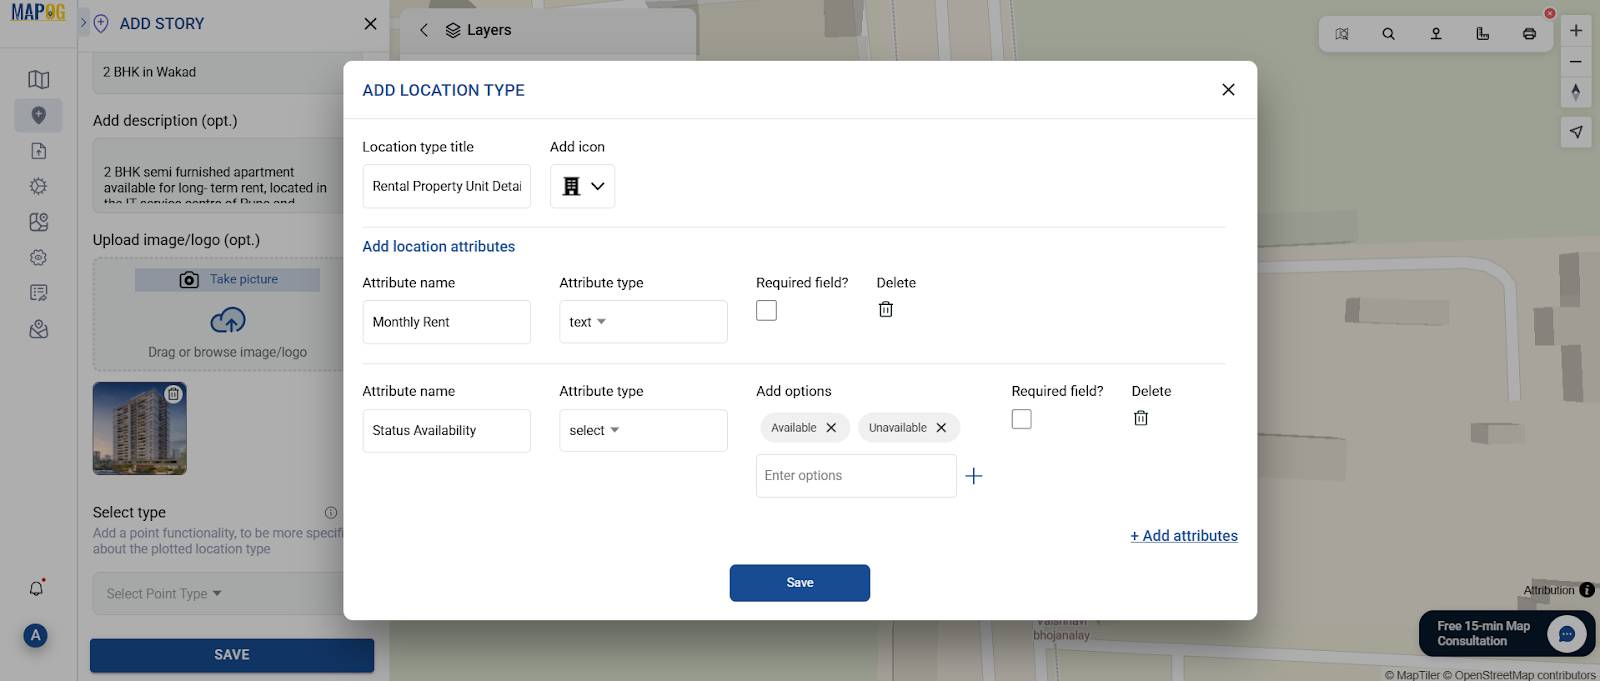
Step 4: Create Custom Location Types for Properties
To better organize your property listings, define your own Location Type using the “Select Point Type Setting” tool in MAPOG.
- Go to the Location Type Management tab.
- Then click “Create New Location Type.” & name it something like Rental Property Unit.
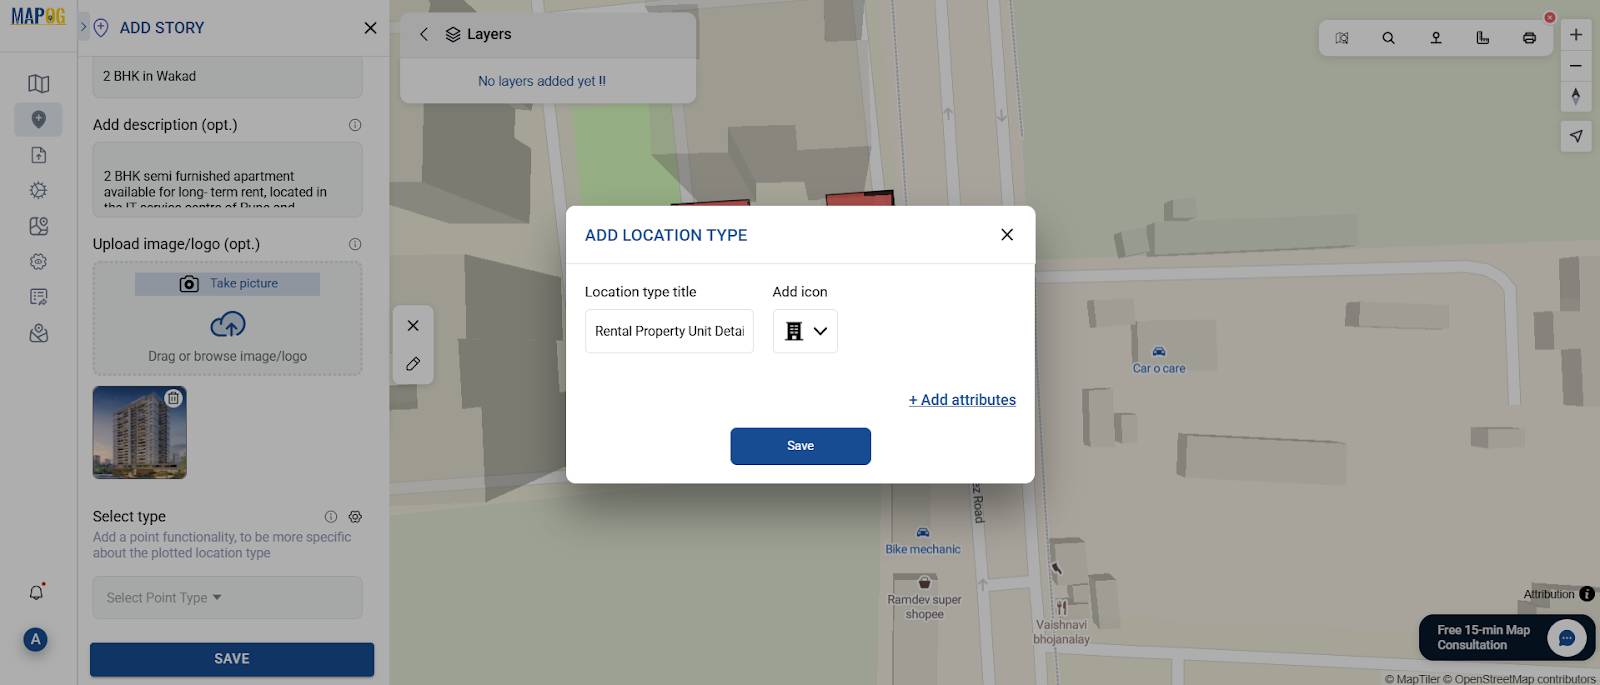
Add custom attributes to all property details, such as:
- Monthly Rent
- Status Availability
- Furnishing Status
- Photos
- Rating
- Amenities
- Full Address
Then fill out the fields after saving.
Step 5: Customize Property Polygon for Visual Clarity
Open “Polygon Customization” to enhance clarity:
- Add the property label
- Assign a category-based color
- Then set height to visually reflect building scale
- Adjust opacity if needed
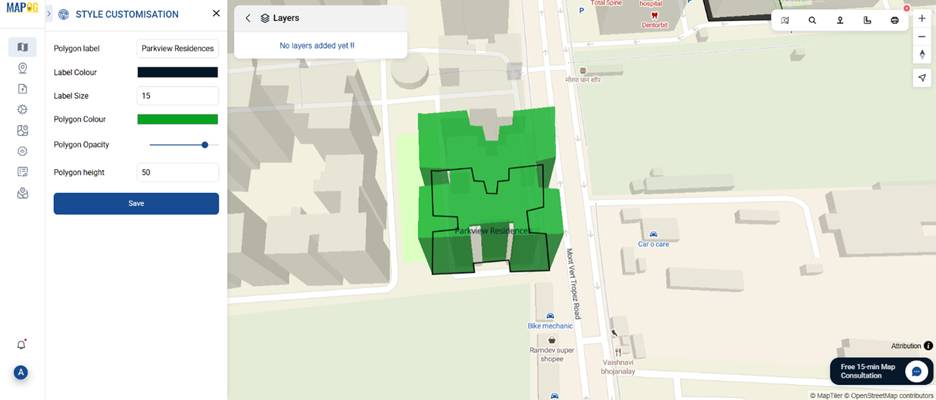
Thus these quick customizations make your map clearer, more interactive, and visually appealing.
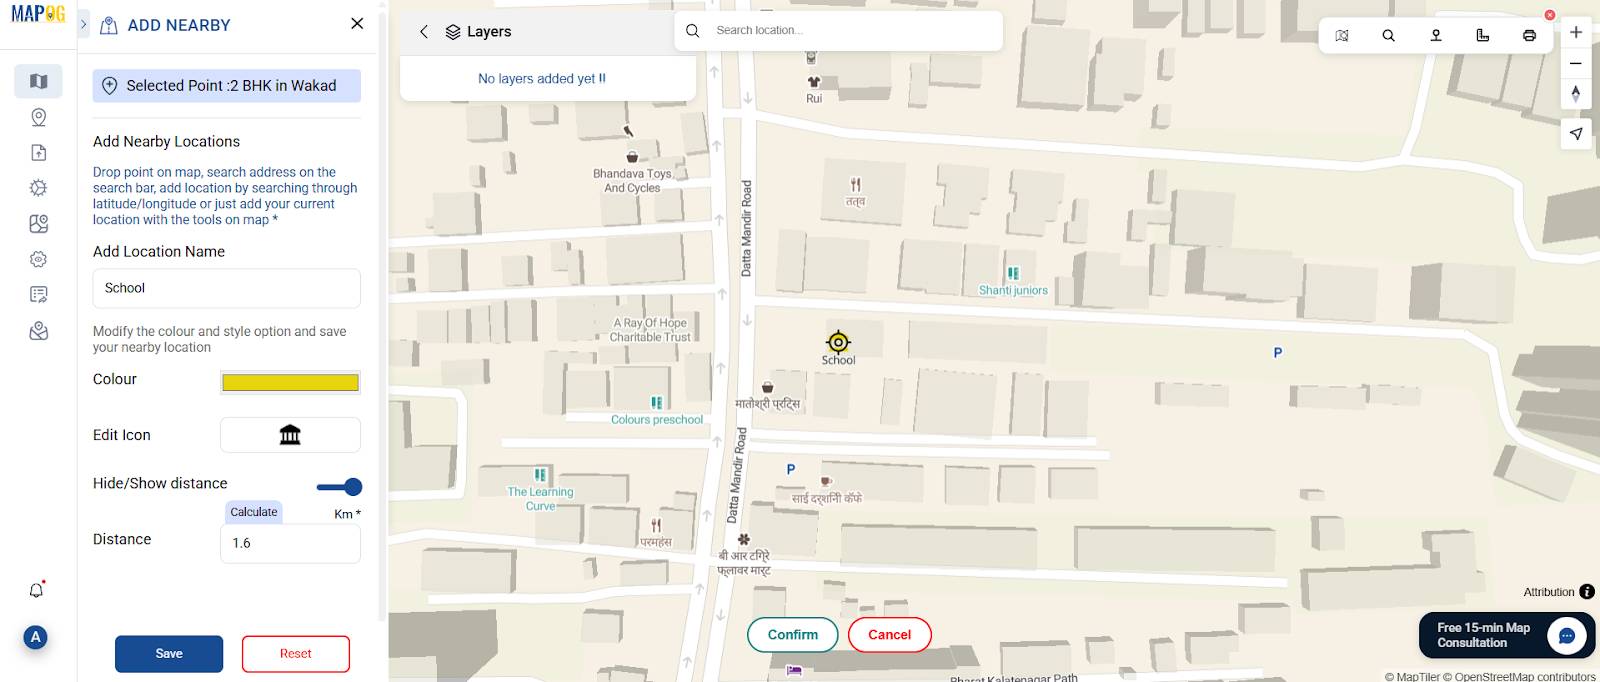
Step 6: Add Nearby Facilities
First, use the Distance Measure tool from the toolbox to check how far key amenities are from your property (e.g., schools, hospitals, parks).
Then, use the “Add Nearby” feature to mark these facilities on the map:
- Select your property and click Add Nearby
- Drop a pin or search for the nearby location
- Set the name, icon, color, and measured distance (e.g., School – 1.6 km)
- Then, click Save and Confirm
Then, repeat the same for other property polygons to give each listing clear proximity context.
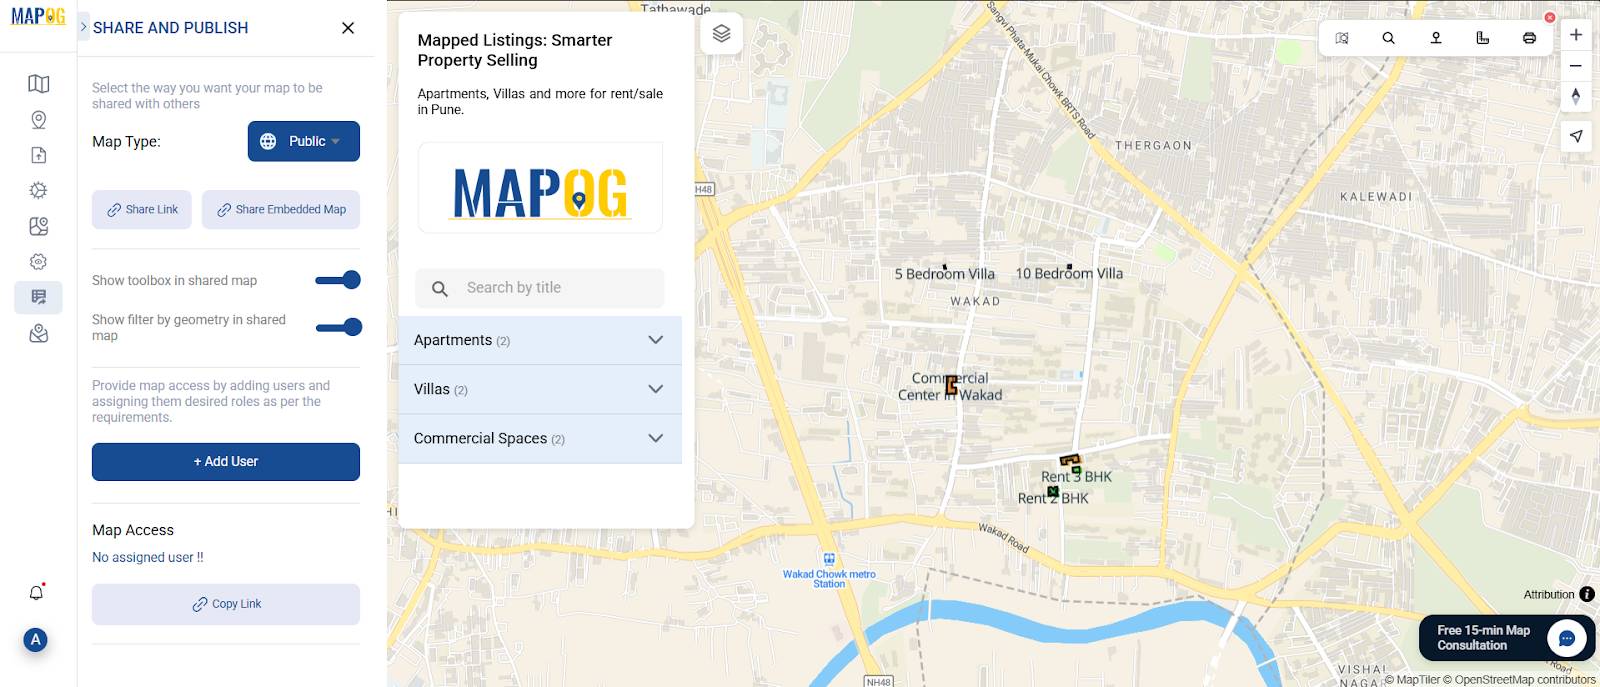
Step 7: Share & Publish Your Map
- Go to ”Share & Publish”
- Set visibility to Public, Private, or Restricted
- Finally share it with others via web or social media
Industry Use & Benefits of Mapped Real Estate Listings
Interactive real estate maps are transforming the way professionals work:
- Agents & Brokers use them to market properties with visual appeal
- Developers use them to analyze location potential
- Planners & Investors assess infrastructure and land use context
For example, when helping a developer select the best site for a new project, nearby land use, and infrastructure turns raw data into actionable insights. Hence MAPOG makes this process visual, organized, and easy to share.
Conclusion
With MAPOG, real estate professionals can turn standard listings into interactive, location-rich stories. Using features like Add Story, custom pins, and proximity mapping, each property becomes more than a listing—it becomes a visual narrative that’s easier to explore, understand, and share.