In sustainable land management, it’s critical to monitor deforestation-free farming using spatial GIS tools that help understand how agriculture interacts with ecosystems. As deforestation becomes a pressing concern, agri-businesses and regulators require spatial evidence to ensure farming doesn’t encroach on forested areas. With MAPOG, spatial data becomes a powerful tool for environmental accountability and transparent reporting.
Similar to how precision agriculture uses GIS-based Buffer Zones to manage eco-friendly fertilizer application near water bodies and sensitive zones, deforestation monitoring uses polygon mapping and forest layers to verify that farmland remains within safe boundaries. This promotes sustainability, compliance, and stakeholder trust.
Key Concept: Why Use Polygon and Overlay Analysis in Agriculture?
Monitoring farmland against environmental datasets isn’t just for regulations—it’s responsible stewardship. With MAPOG’s spatial analysis tools, polygon-based mapping allows users to validate that agricultural activity is not contributing to deforestation.
Just like in “Creating GIS Solutions for Urban Agriculture Maps”, where planners use GIS to map and manage food production zones in cities, this approach leverages spatial overlays to identify whether farming areas intersect with forest boundaries or historical loss zones.
By combining accurate boundary mapping with deforestation datasets, farmers and organizations can:
- Ensure sustainable farming
- Provide visual documentation for compliance
- Support data-driven planning for long-term ecological safety
This analysis helps bridge the gap between agricultural productivity and forest conservation through clear, verifiable mapping.
Step-by-Step Workflow: Mapping Deforestation-Free Agriculture with MAPOG
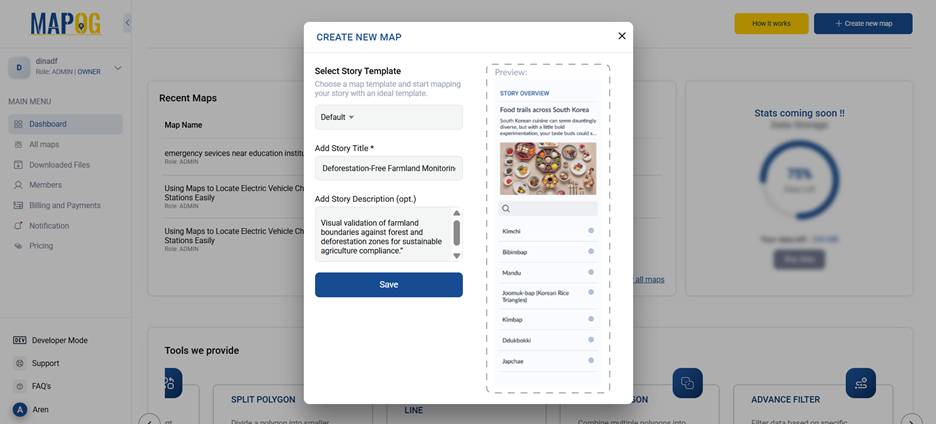
Step 1. Create a New Map
- Log in to MAPOG.
- Click on “Create New Map”.
- Title your project:
“Deforestation-Free Farmland Monitoring” - Add a short description.
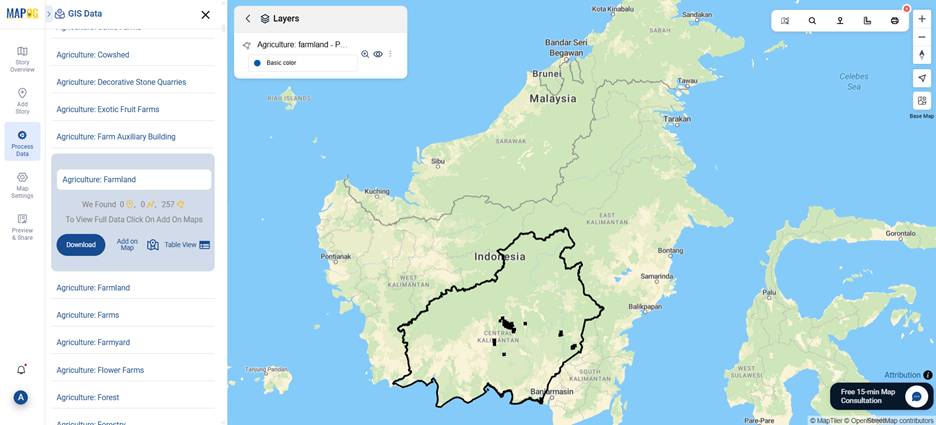
Step 2. Add GIS Data Layers
Go to “Process Data” then select “GIS Data”. Add the following:
- Agricultural Land Boundaries (Polygon Layer)
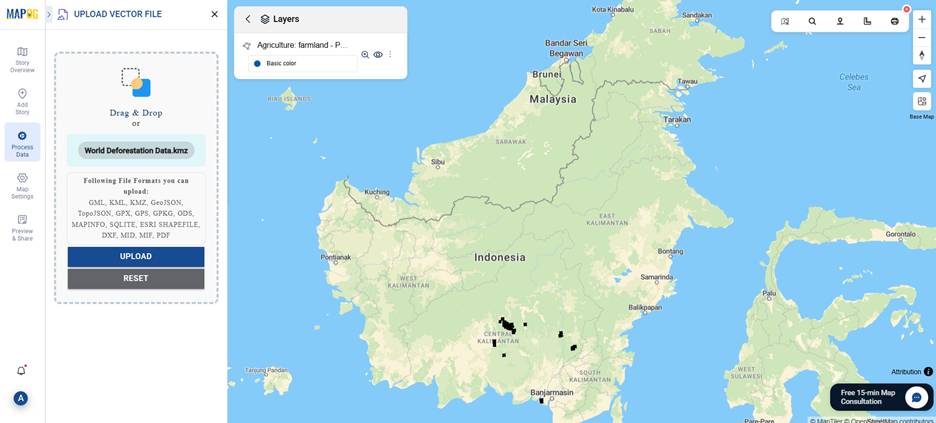
Step 3: Upload Deforestation Data (KML)
- Go to the “Process Data” tab.
- Select “Upload Vector File”.
- Upload the KML file containing your deforestation zones.
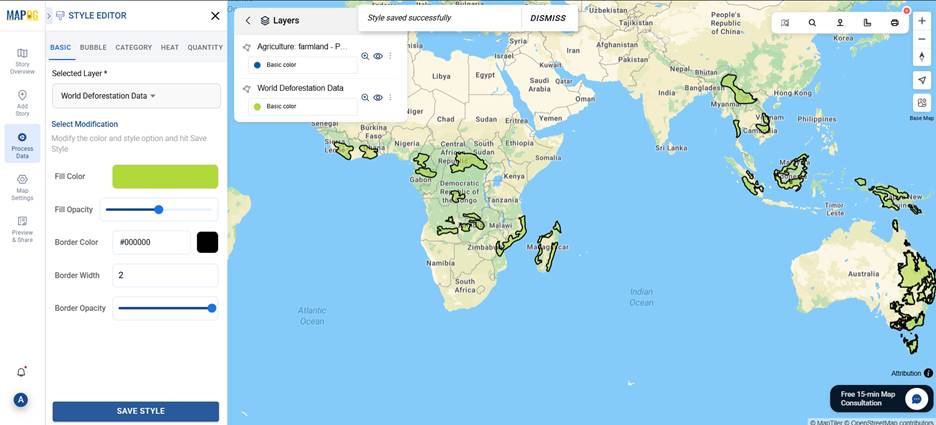
Step 4: Style the Layers
Use the ”Style Editor” for clarity:
- Farmlands → Color: Light Green (solid fill)
- Deforestation Zones → Green with 40–50% transparency
- Optional: Add an outline to enhance visual borders.
Step 5: Create Buffer Around Farmlands
- Go to “Process Data” → “Buffer Tool”.
- Input Layer: Farmland
- Buffer Distance: 500 meters
- Output Layer Name: Farmland Buffer Zone
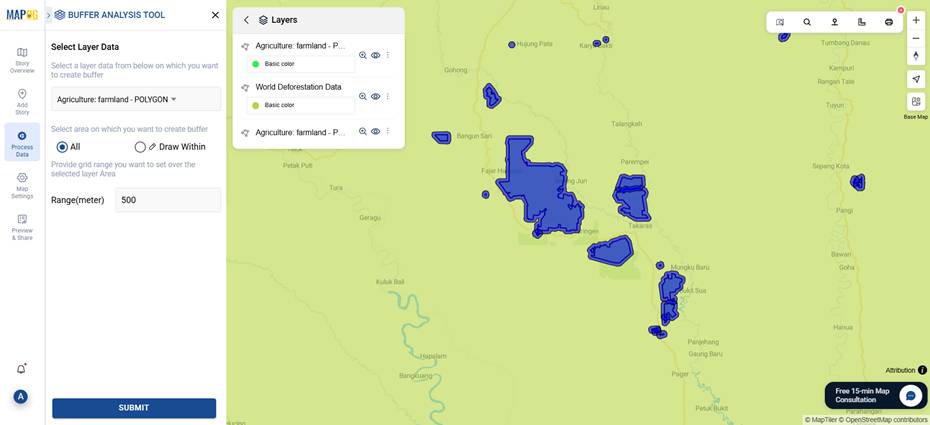
This creates a visible ring around each farm to assess risk from nearby deforestation.
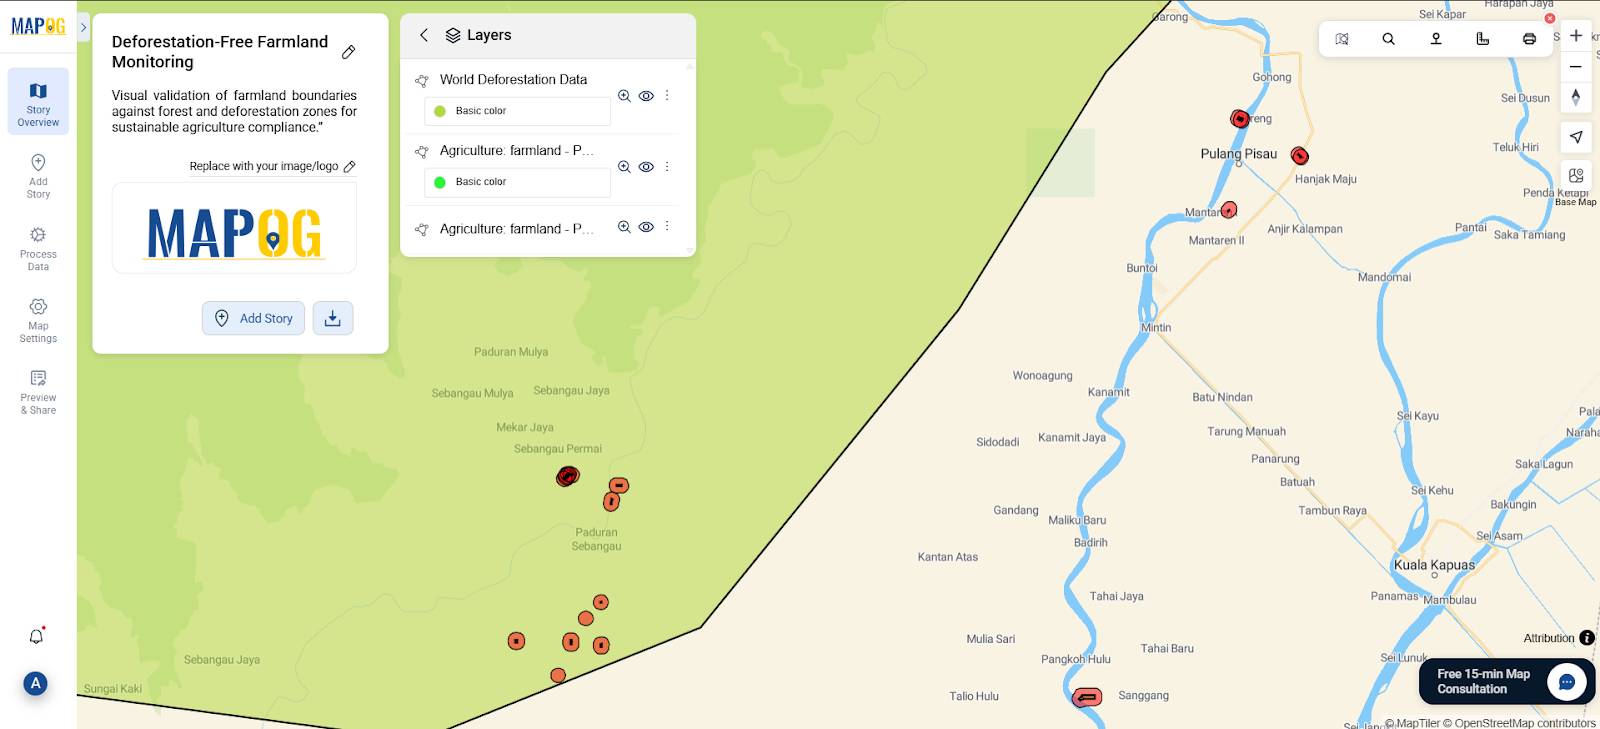
Step 6: Analyze the Results
Visually assess the map to determine farmland exposure and monitor deforestation risks:
- If the 500m buffer zones intersect with the deforestation layer → the farmland is at environmental risk.
- If completely outside → the farmland is considered deforestation-free.
- In some cases, partial overlap occurs where only a portion of the buffer touches the deforestation zone. These mixed zones may need further on-ground verification or partial mitigation strategies.
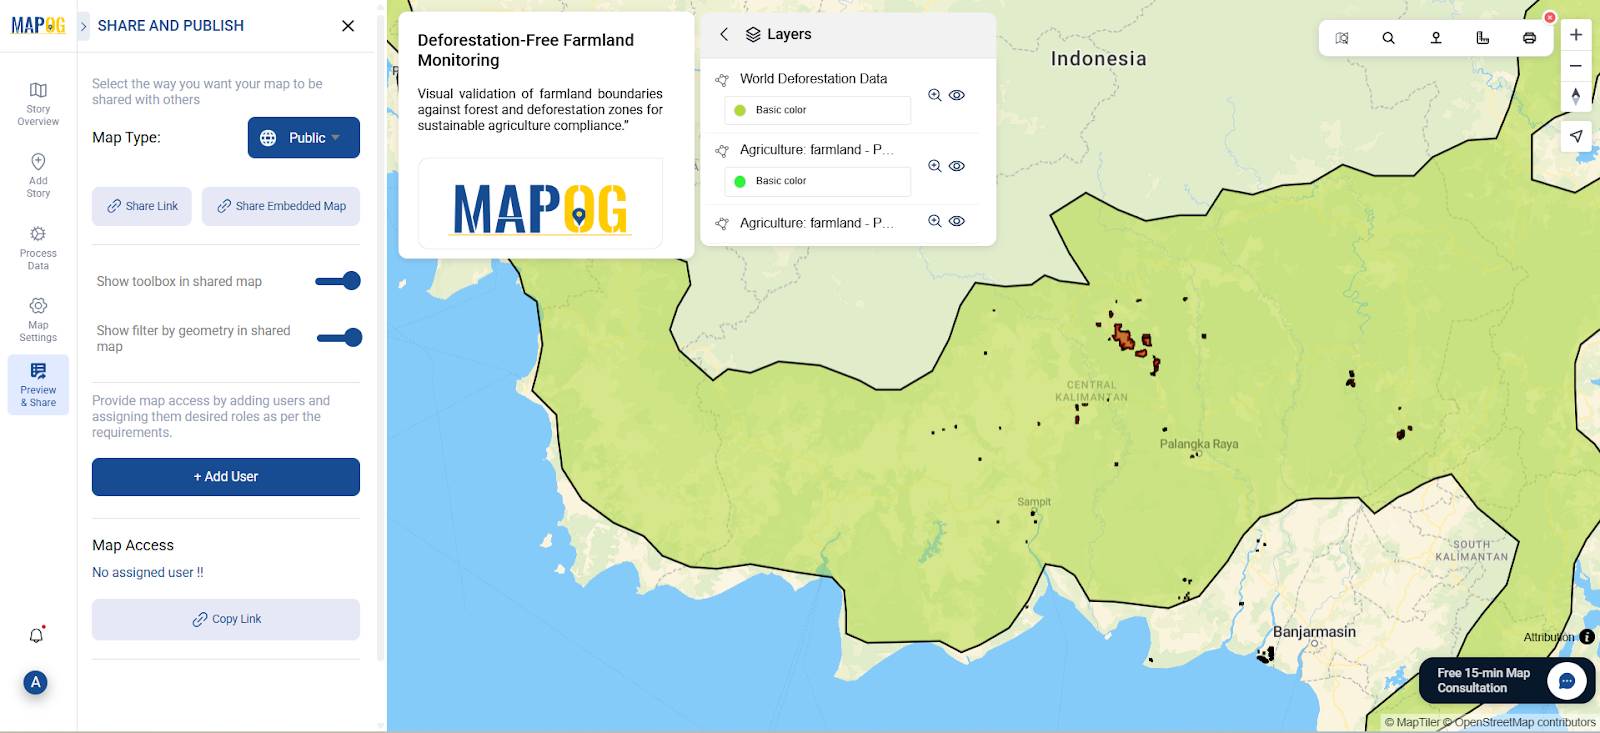
Step 7: Export or Share Your Map
- Go to “Preview & Share”.
- Choose export format:
- PDF or PNG for documentation
- Public link for stakeholders/certifiers
You now have a complete map to support sustainable farming documentation.
Industry Use & Benefits of Mapping Deforestation-Free Agriculture
Interactive GIS-based agricultural maps like these are essential tools for:
- Agro-Certification Bodies: Confirm farms are outside deforestation zones.
- Sustainable Farming Enterprises: Ensure compliance for eco-certifications and ESG goals.
- Environmental Agencies: Track encroachment and promote land conservation.
- Policy Makers & NGOs: Use GIS to enforce preservation and guide incentives.
This functions similarly to the “Sustainable Site Selection for Organic Farming with Buffer Analysis” tool, where spatial buffers help identify zones suitable for eco-friendly cultivation. In this case, it’s about using overlays and proximity buffers to distinguish forest-safe farming areas from those at environmental risk.
By making such insights visual and interactive, stakeholders can align agriculture with conservation—turning spatial data into sustainable action.
GIS Data Used
Conclusion
MAPOG makes it easier to monitor deforestation while supporting sustainable farming practices. With tools like Buffer and Overlay Analysis, users can identify sensitive zones, promote sustainable site selection, and visually prove eco-friendly practices. In summery, organizations can monitor deforestation-free farming with GIS tools to improve compliance, promote sustainability, and protect ecosystems.