In today’s expanding urban landscapes, Mapping Waste Disposal Sites and the safe management of waste is a growing concern for both communities and city planners. Improperly placed waste disposal sites can pose serious health and environmental risks, especially when located too close to residential areas. Issues such as air and water pollution, unpleasant odors, and increased disease vectors threaten the quality of life for nearby residents. With MAPOG, city authorities can use buffer analysis to map the proximity of waste disposal sites to residential zones, visualize potential risk areas, and support smarter, more sustainable city planning.
Key Concepts
Mapping waste disposal sites near residential areas using GIS and buffer analysis is more than plotting facilities on a map; it’s about creating a spatially informed framework for environmental safety and urban sustainability. With MAPOG, users can define buffer zones around waste disposal sites to highlight impacted areas, assess environmental vulnerability, and support data-driven decision-making for smarter, healthier urban development.
Steps to Mapping Waste Disposal Sites:
1. Access MAPOG’s Mapping Platform
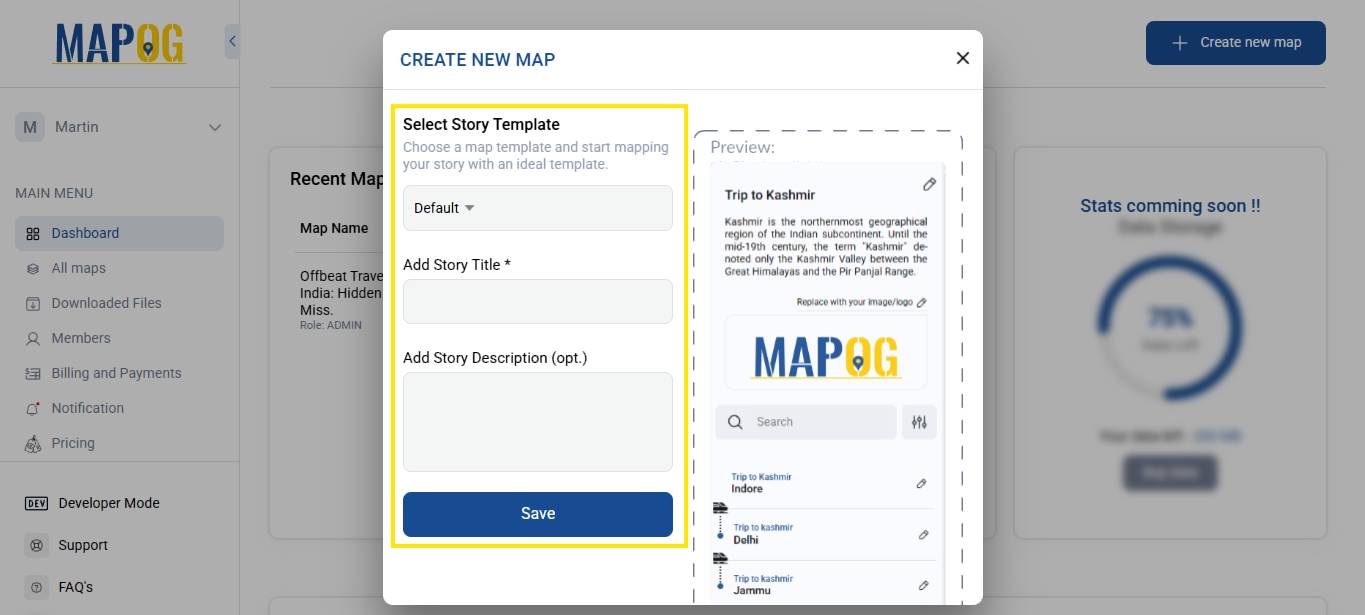
Visit MAPOG platform in your browser. Click on “Create New Map” in the top- right corner of the homepage to start creating your own map. Add the title of your map and give short Description about it, then save.
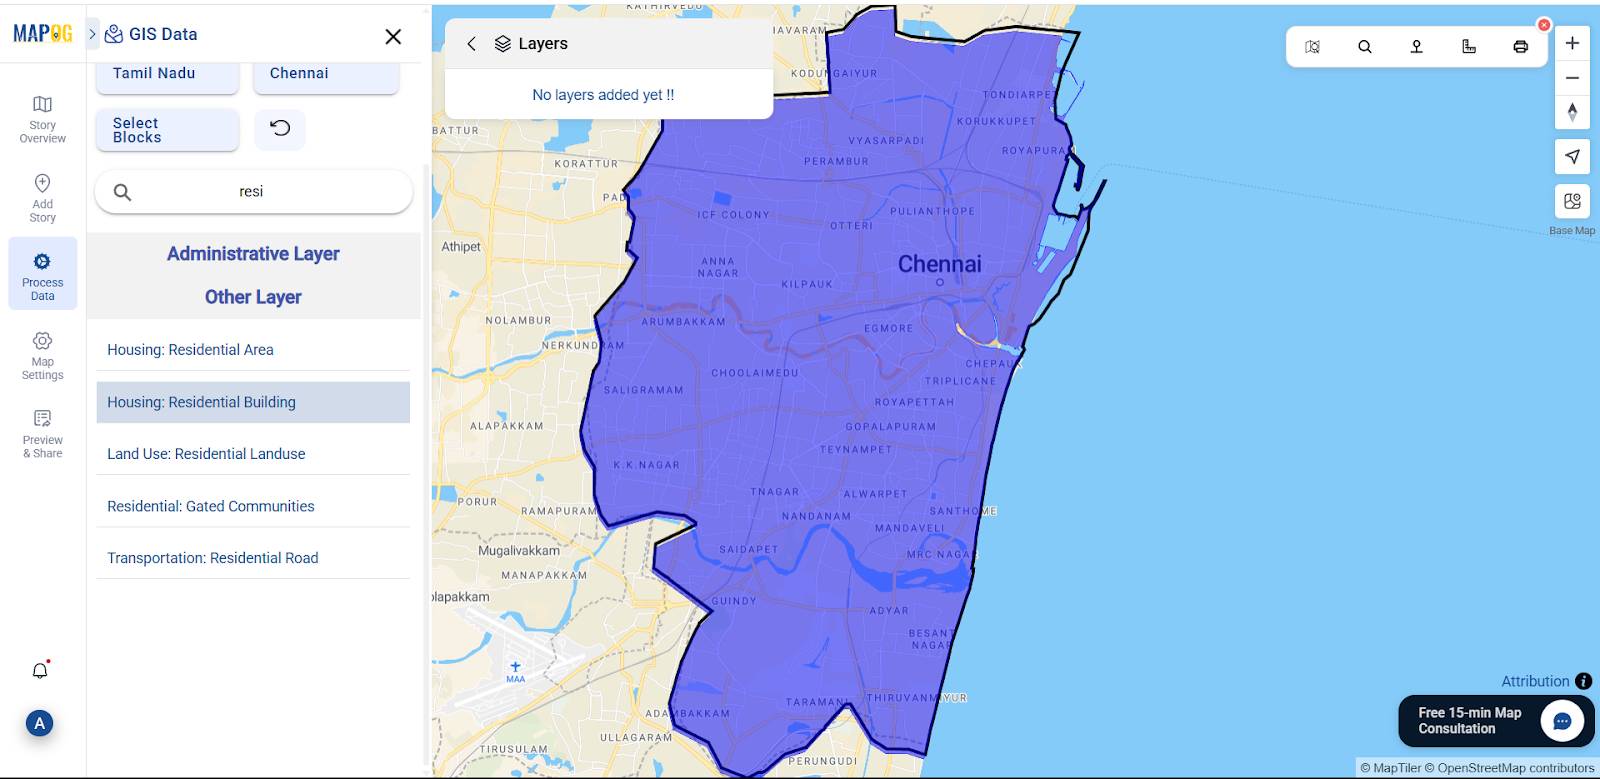
2. Load the Residential data
Go to the “Process Data” and select “GIS data”, choose your country → state → district→ blocks→ Housing: Residential building.
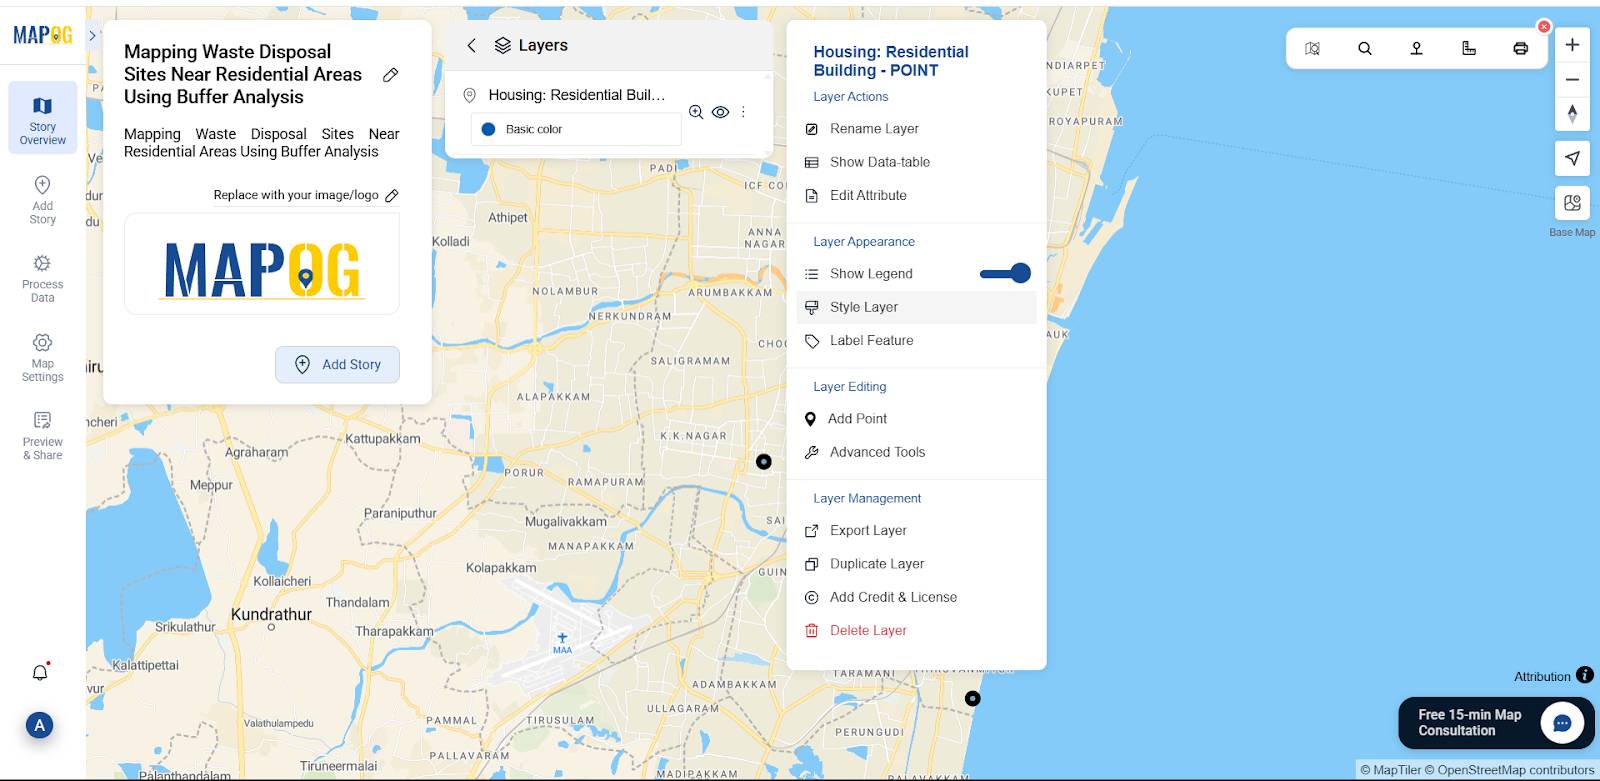
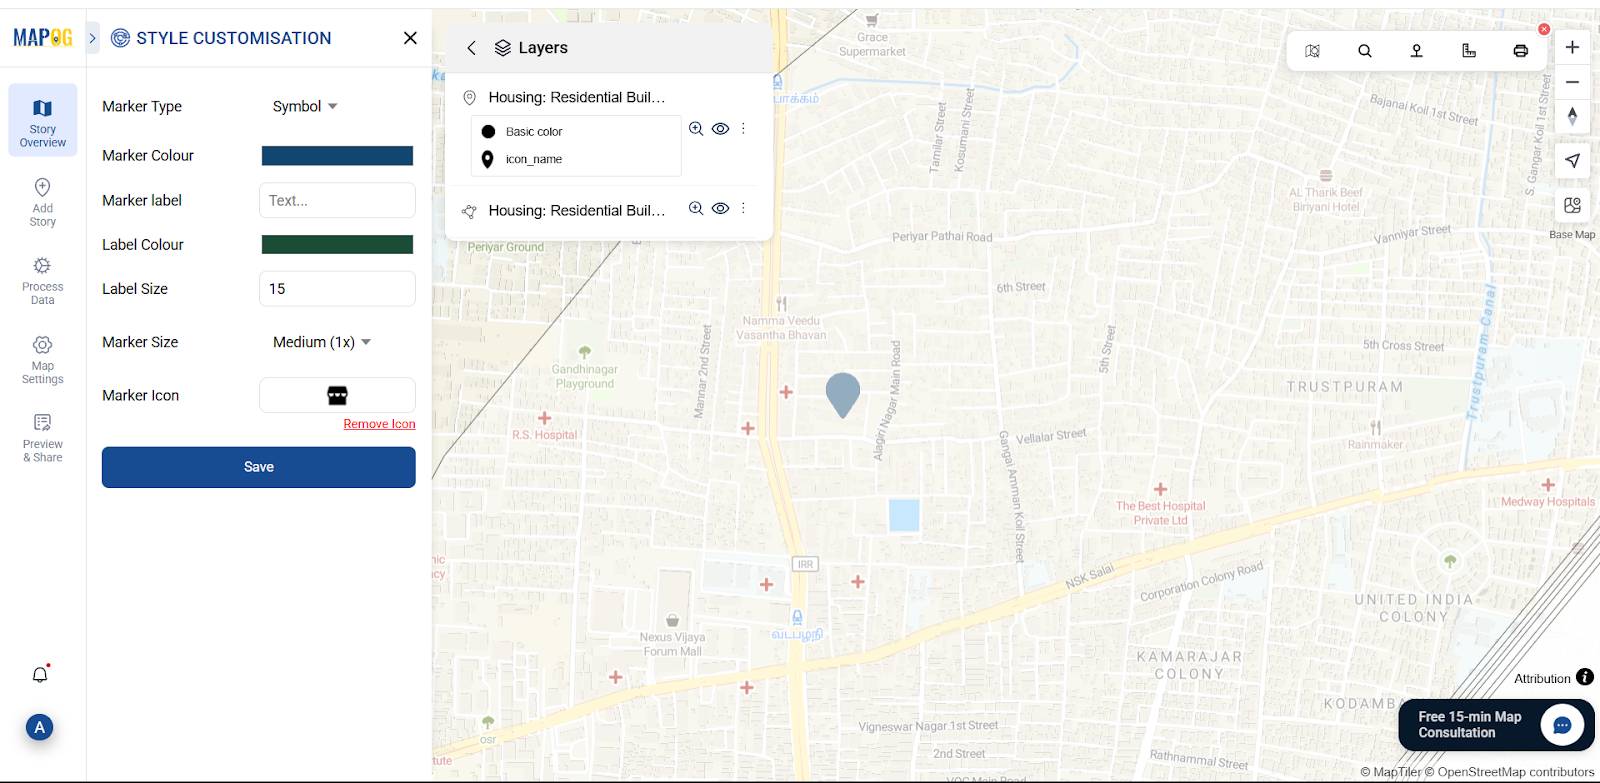
Step 3: Customizing Location Icons
You can customize your location logo by going to the ‘Style Layer’ option; furthermore, select and change the icon to better represent your data points on the map.
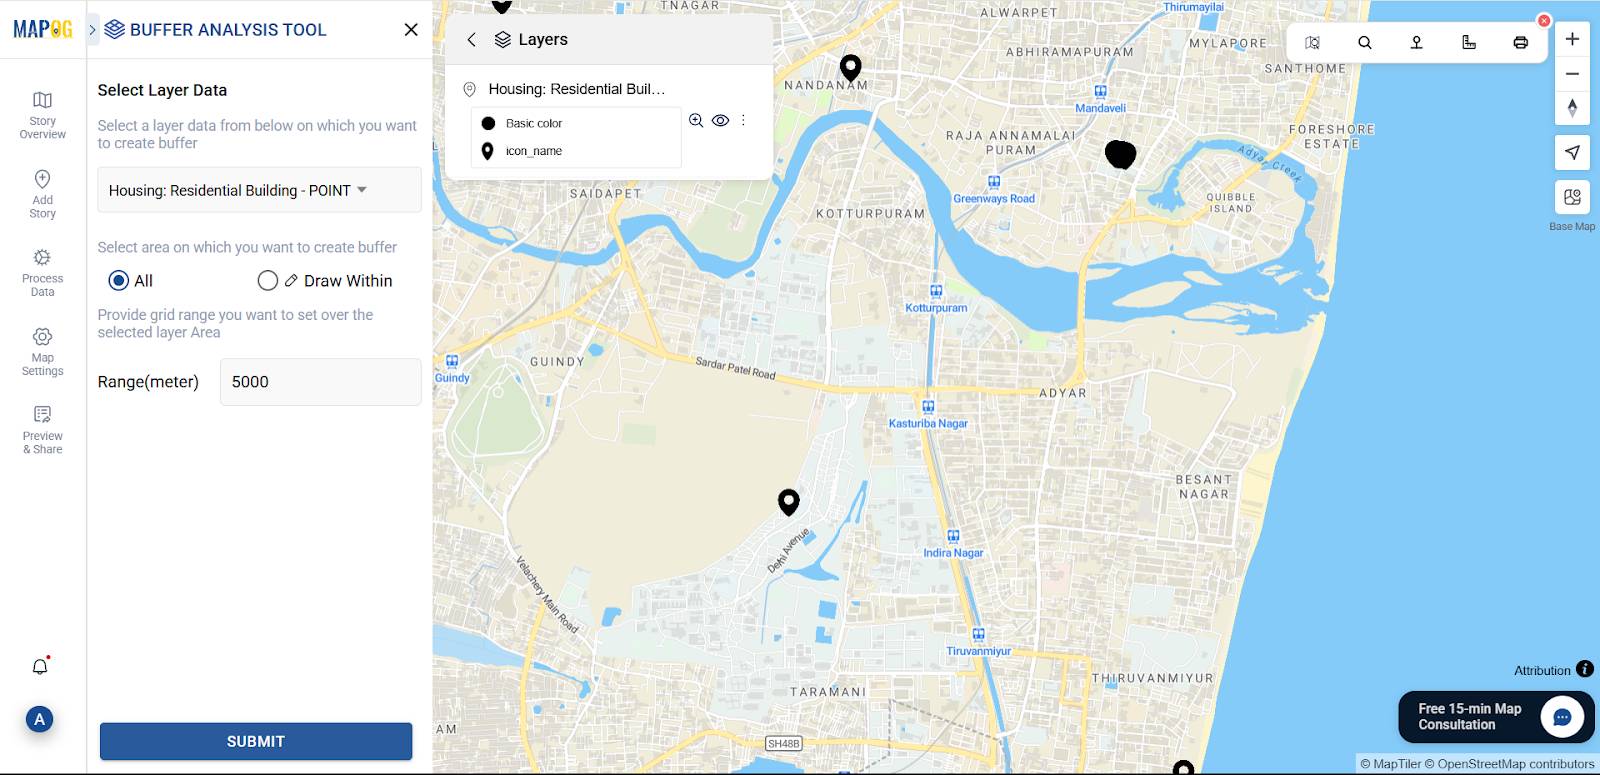
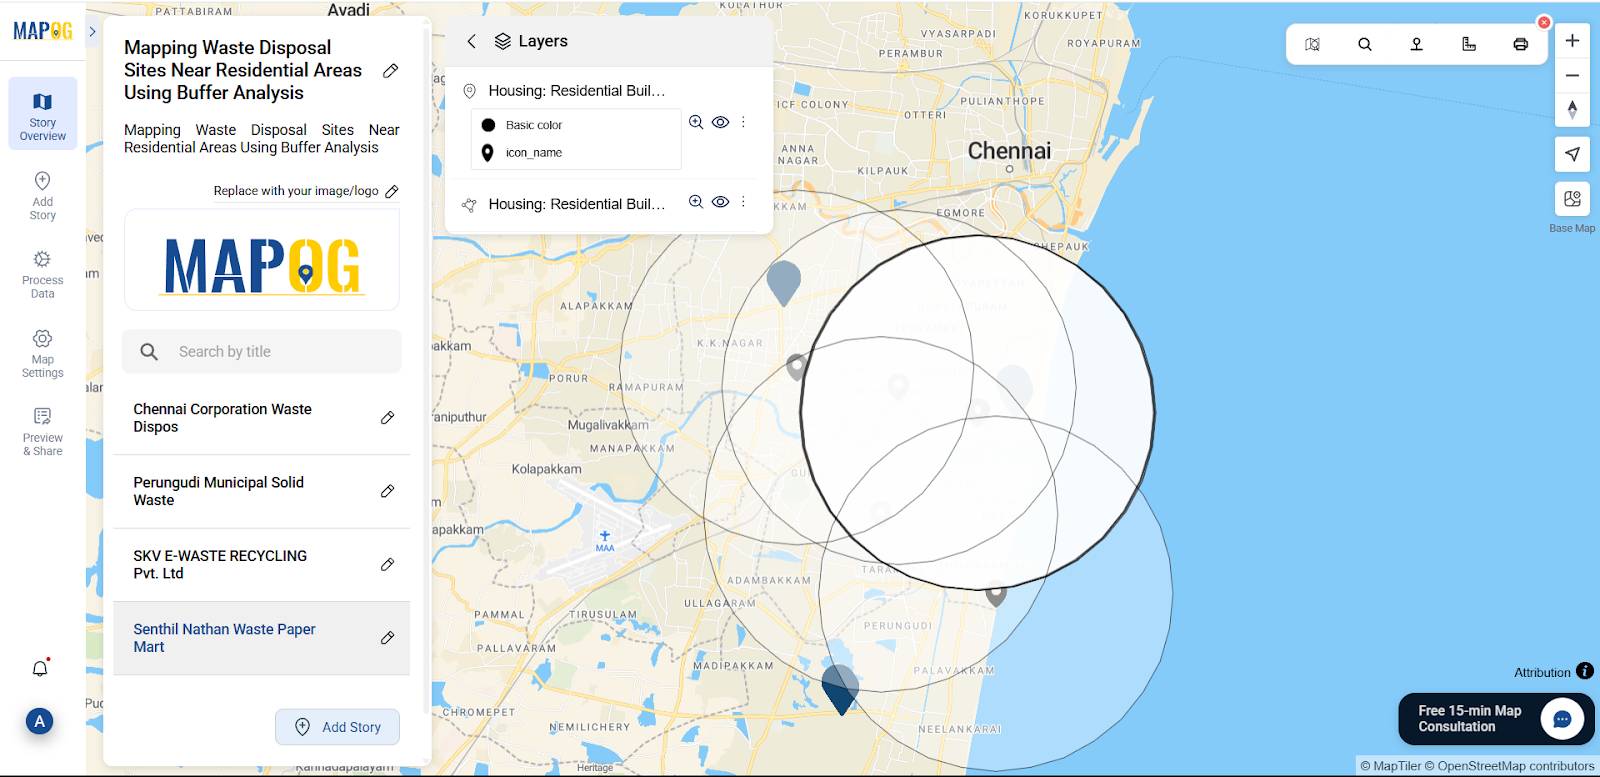
Step 4: Performing Buffer Analysis
Go to the “Process Data” option and select “buffer tool.” Then, in the Select Layer Data dropdown, choose your Residential location file; afterward, set the desired buffer range (e.g., 5000 meters) and click ‘Submit.'”
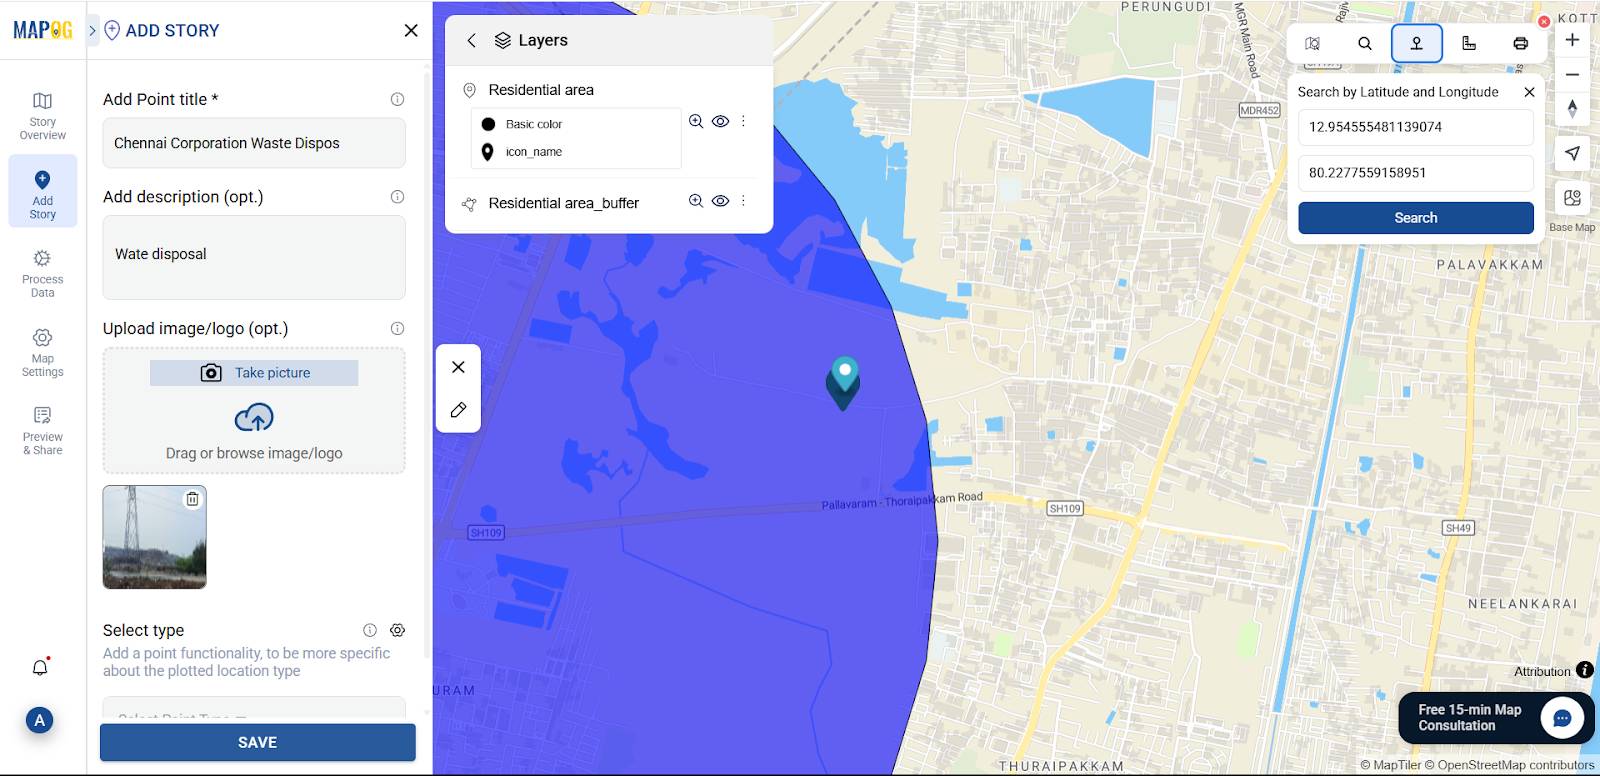
5. Add waste disposal Points Manually
Now, use the “Add story” then select “add manually” then create Waste disposal sites inside the buffer zone. Select waste disposal points by using Search by Latitude and Longitude and give confirmation. Then give the title for your point, write a short description about it, and upload a suitable image.
Using the select point type settings option, add location type such as “Waste disposal site” & add different relatable attributes to it, and later fill all the information there.
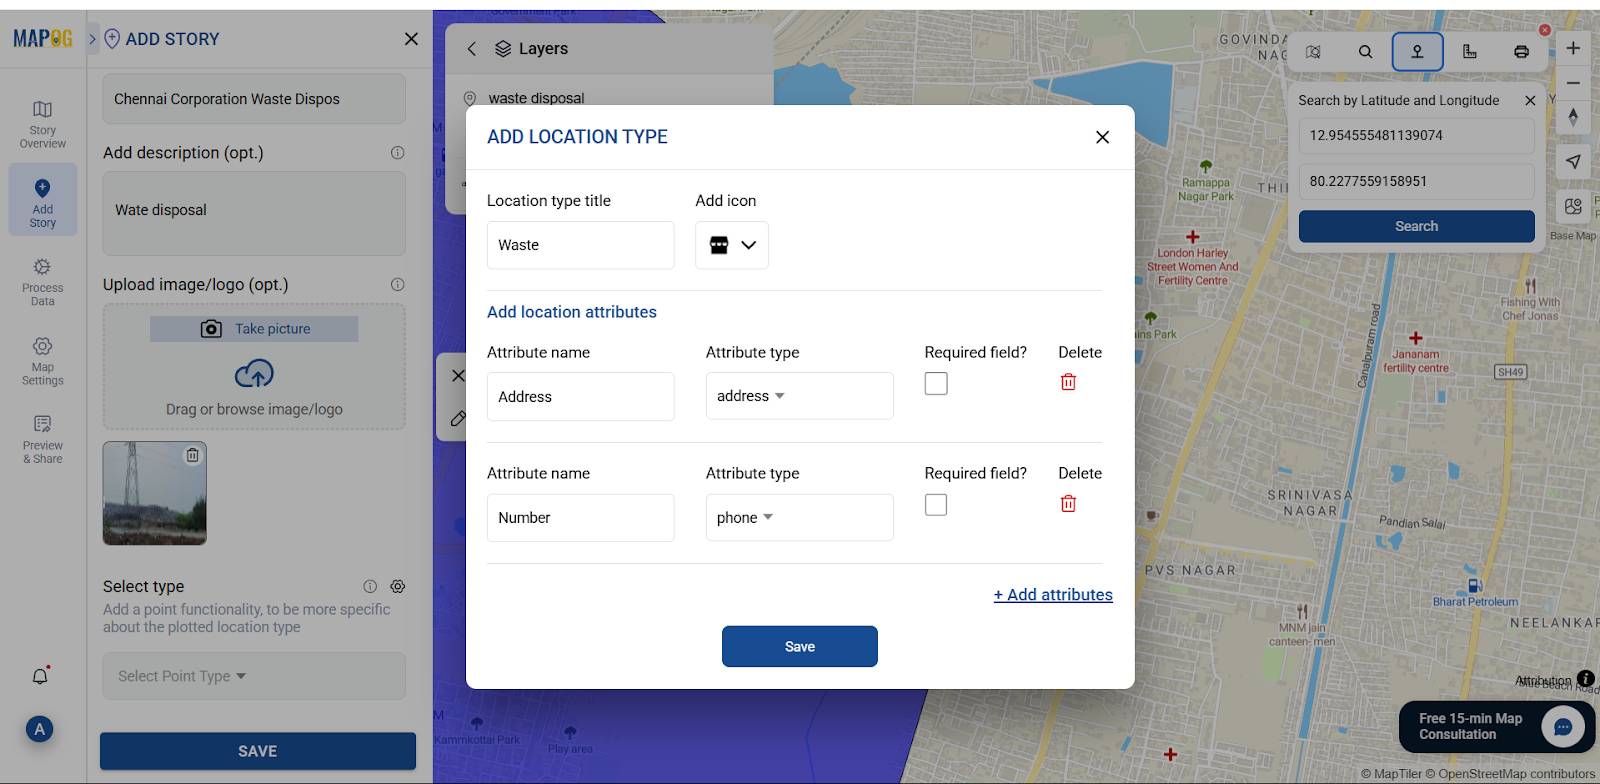
Follow the same procedure to add more waste disposal sites.
6. Customize Points for Visual Appeal
Label cyclone shelters and customize icons with emergency or shelter symbols using Point customization .
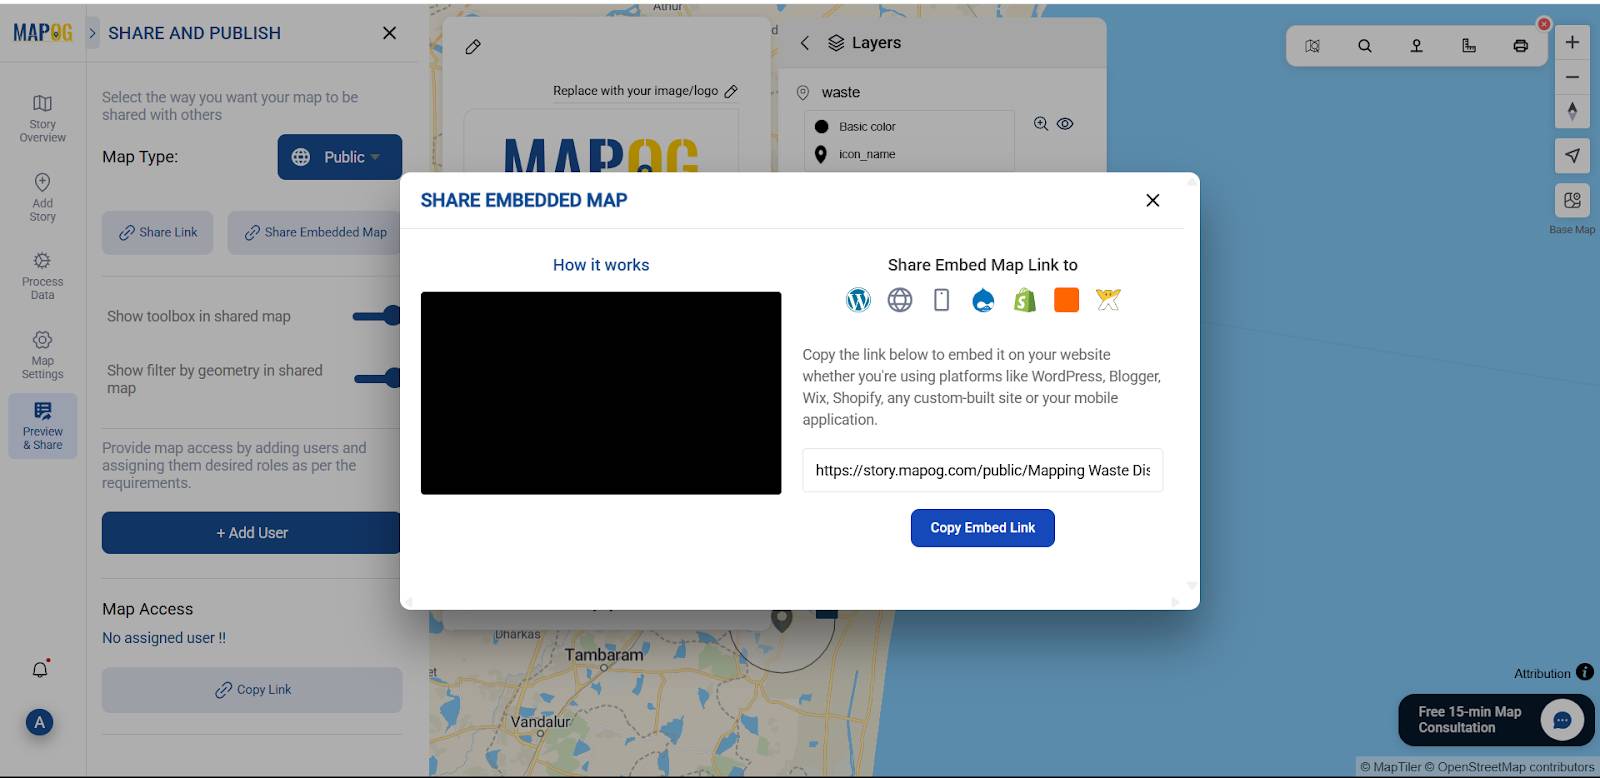
7. Share or Embed the Map Anywhere
Go to the ‘Preview and Share‘ option, you can keep it private or change the map type to ‘Public’. This will enable the share link.
Who Can Take Advantage of Mapping Waste Disposal Sites Near Residential Areas Using Buffer Analysis
Buffer analysis helps city planners identify safe distances between waste disposal sites and residential zones, ensuring compliance with zoning laws and minimizing public health risks.
Authorities can use buffer zones to evaluate the environmental effects of existing or proposed waste disposal facilities on nearby communities, water bodies, and ecosystems.
By identifying households and sensitive sites (e.g., schools, hospitals) within risk zones, health agencies can implement targeted interventions.
Data Used
Conclusion:
Mapping Waste Disposal Sites Near Residential Areas Using Buffer Analysis becomes both insightful and impactful with the help of MAPOG. You can visualize potential risk zones, assess proximity to residential areas, and uncover regulatory or safety gaps empowering urban planners, environmental authorities, and local communities to make smarter, data-informed decisions for a healthier, more sustainable city.
Here are articles related to this topic: