In urban planning, mapping sewage lines and water isn’t just about locating pipelines—it’s about understanding how systems connect and where they fall short Therefore, as cities expand, planners need clear ways to visualize the relationship between sewage networks and treatment facilities. As a result, with MAPOG, spatial data becomes actionable insight.
Mapping sewage and drainage systems using the Cross Intersection tool helps identify where drain lines fall within or outside the service range of sewage treatment plants (STPs). These intersections reveal not just connectivity—but also potential risks, such as untreated discharge near sensitive areas.
Key Concept: Why Use Cross Intersection Analysis in Urban Infrastructure?
Just as Power Line Vulnerability Analysis uses spatial intersections to identify vegetation risks near electric lines, in fact, planners can use MAPOG to analyze where sewage lines overlap—or don’t—with treatment zones.
In this case, crossing STP buffer zones with drain lines highlights:
- Areas covered by treatment infrastructure
- Gaps needing new STPs or network upgrades
- Zones of potential environmental concern
Step-by-Step Workflow: Mapping Sewage Infrastructure with MAPOG
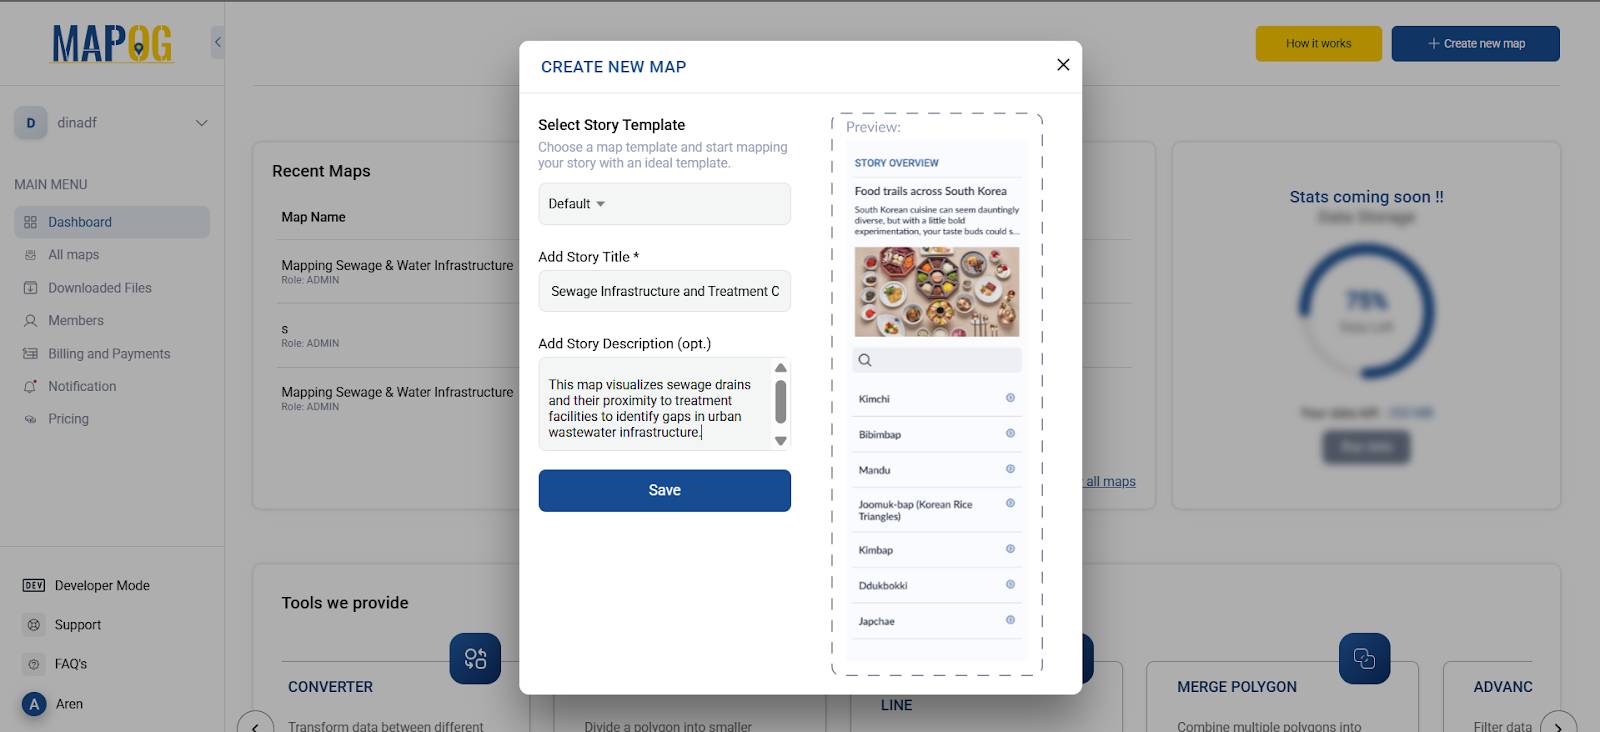
Step 1. Create a New Map
- Go to MAPOG and log in.
- Click “Create New Map.”
- Then Give your project a title,
“Sewage Infrastructure and Treatment Coverage” - After that, add a short description
Step 2. Add GIS Data Layers
- Use the “Add GIS Data” option in the left panel.
- Search for and add:
- Drain Lines (used as sewage paths)
- Then Sewage Treatment Plants
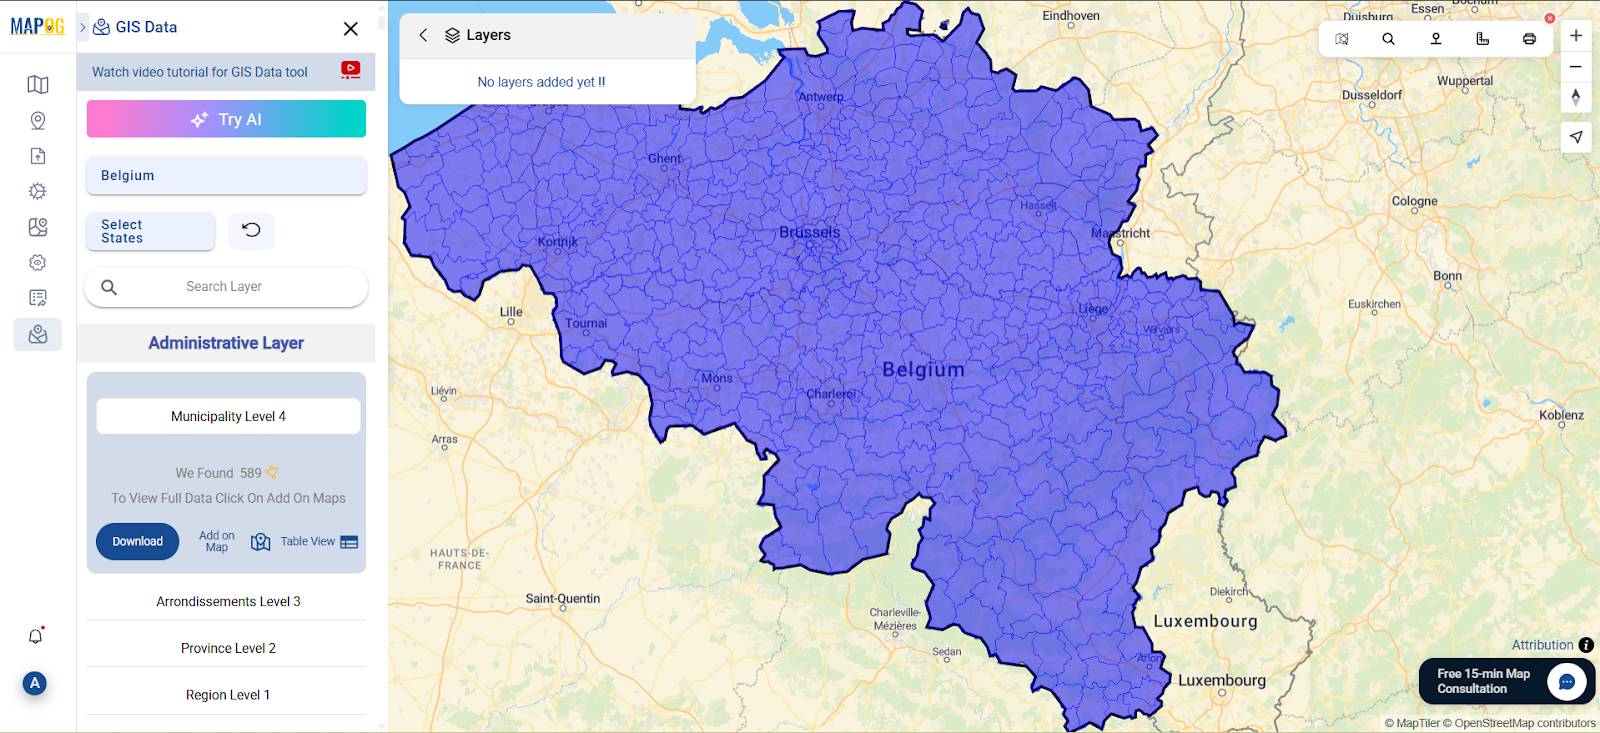
Therefore, once its added, you can rename layers for clarity.
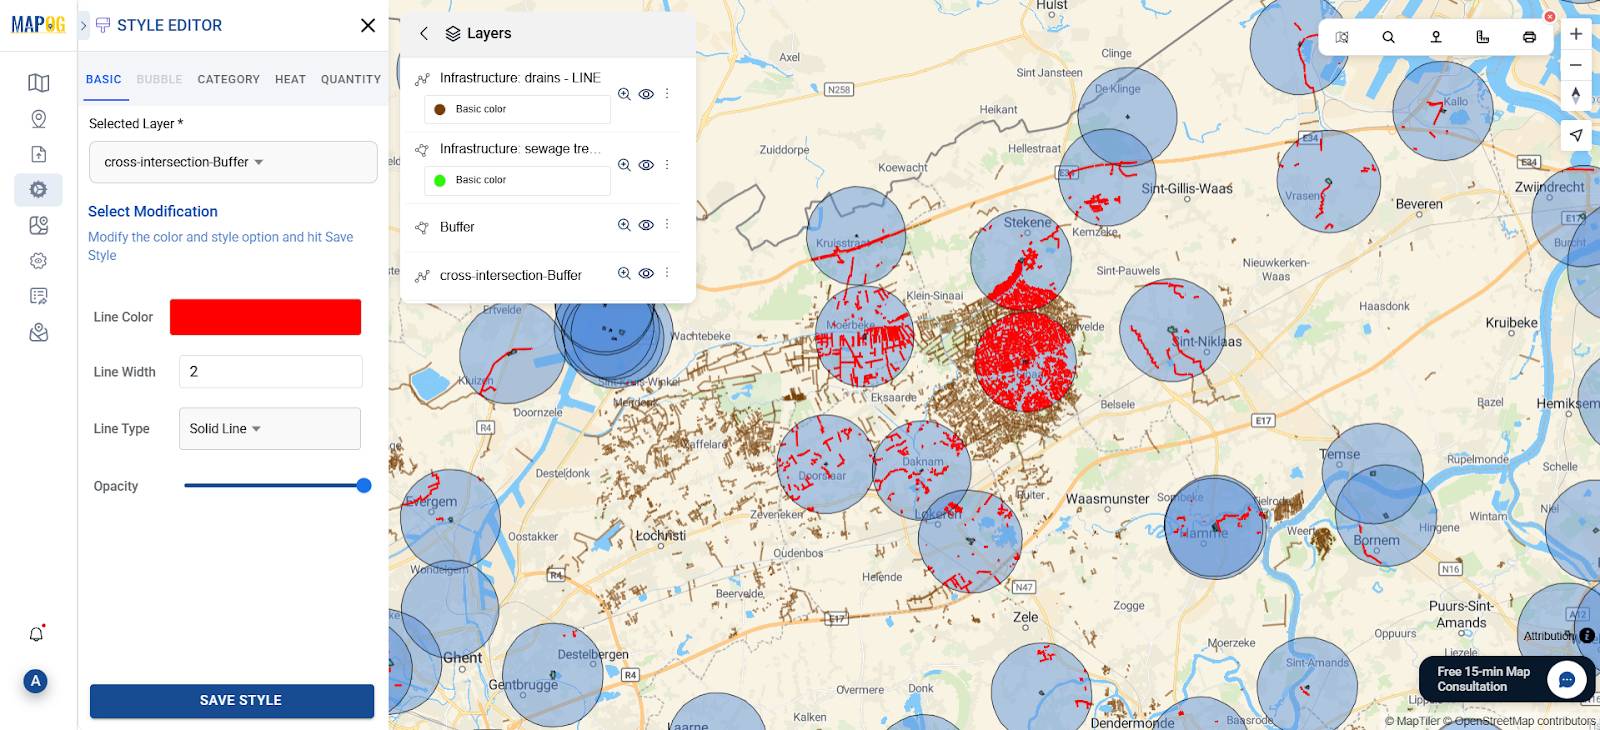
Step 3. Style the Layers
Use MAPOG’s Style Editor:
- Then, color drain lines brown and adjust its opacity
- After that, color STPs green
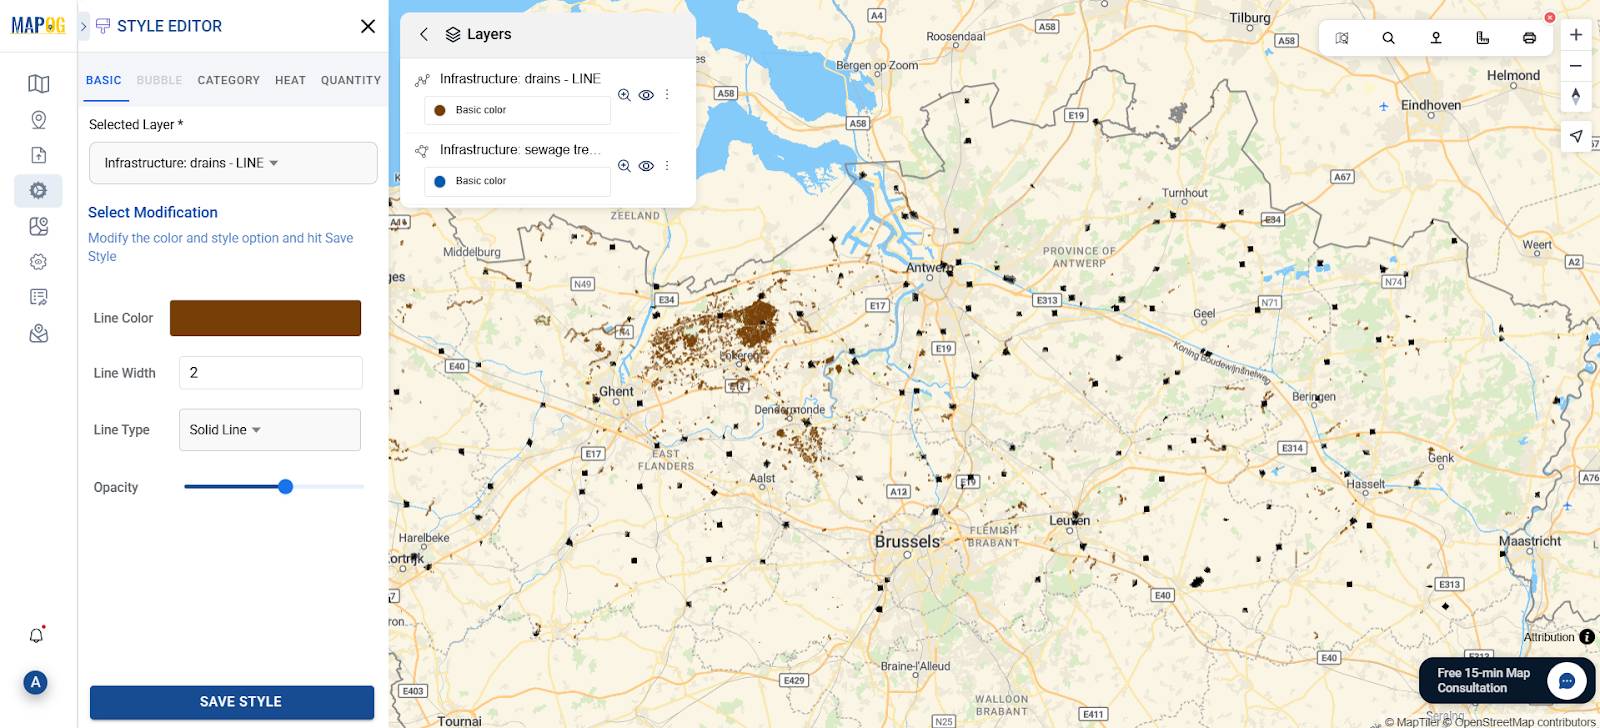
Therefore, this distinction helps in analysis and communication.
Step 4. Create Buffer Zones Around STPs
Go to “Process Data” → “Buffer Tool”
- Input layer: STP polygons
- Then, give Buffer radius: 2–3 km (ideal for urban coverage)
Then give Output layer name: “STP Buffer Zone”
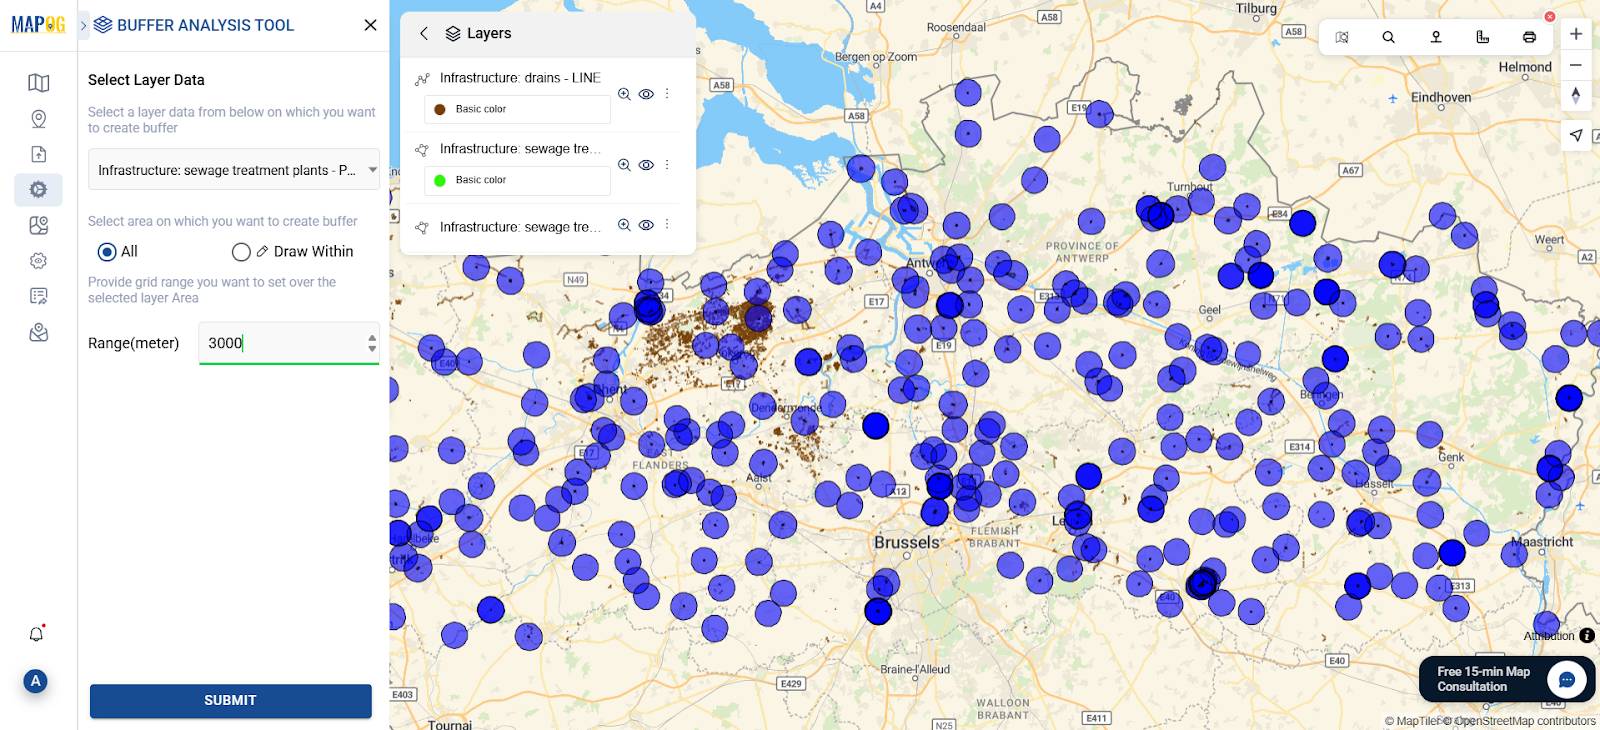
As a result, this shows each plant’s estimated service range.
Step 5. Run Cross Intersection Analysis
Firstly, Go to “Process Data” > “Cross Intersection Tool”
- Set STP Buffer Zone as polygon data & select suitable attributes
- Set Sewage Drain as Lines data & do select line attributes also
- Lastly click on submit.
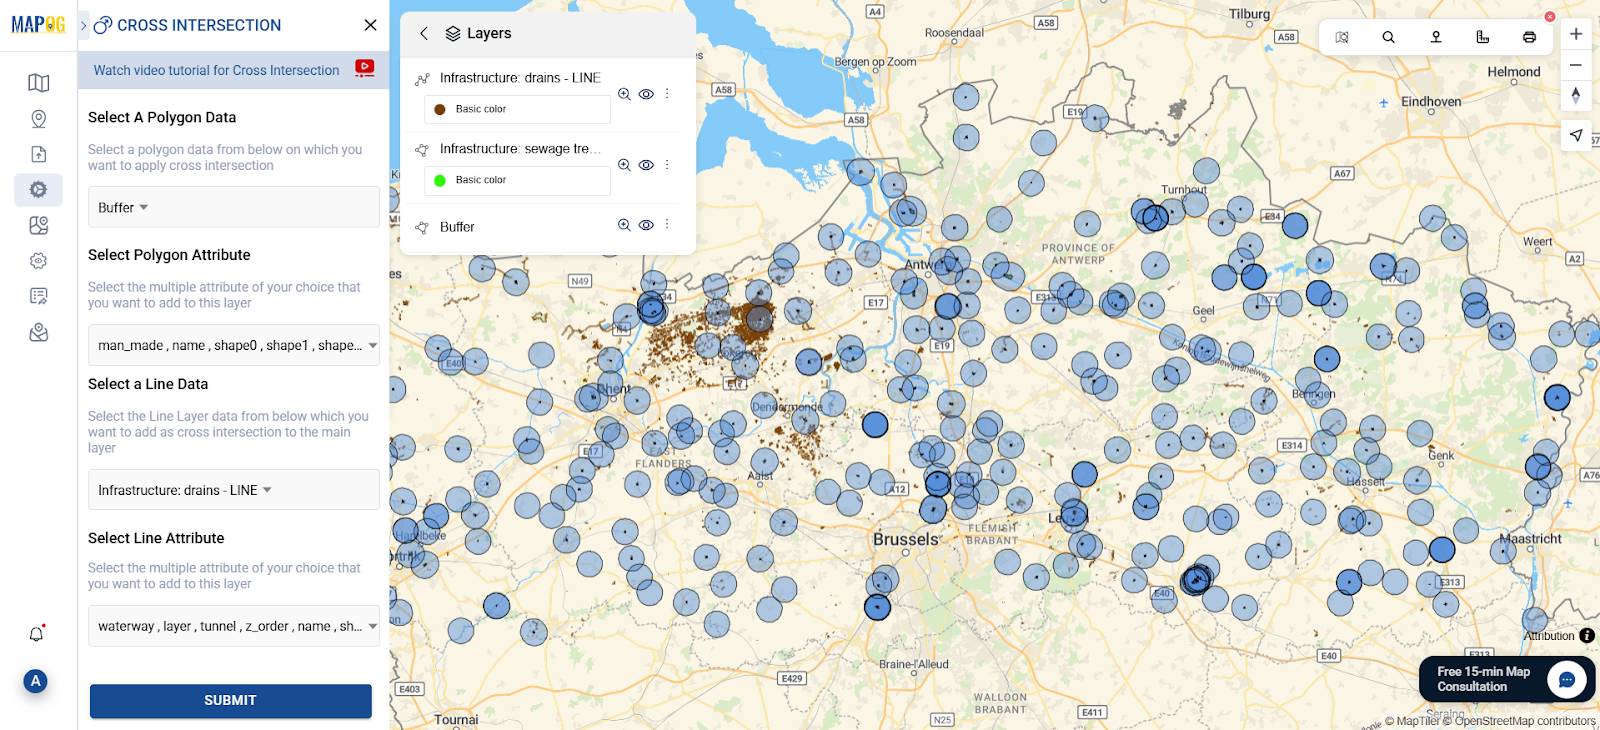
The output layer identifies which drain lines intersect buffer zones.
Step 6. Analyze the Results
The resulting layer shows:
- Covered Drains → Inside buffer → Within treatment reach
- Uncovered Drains → Outside buffer → Require intervention
- Edge Crosspoints → Near buffer edge → Need further assessment
- Color-code each category using the basic style in Style Editor for visual clarity.
As a result, this helps in identifying service gaps and planning infrastructure upgrades.
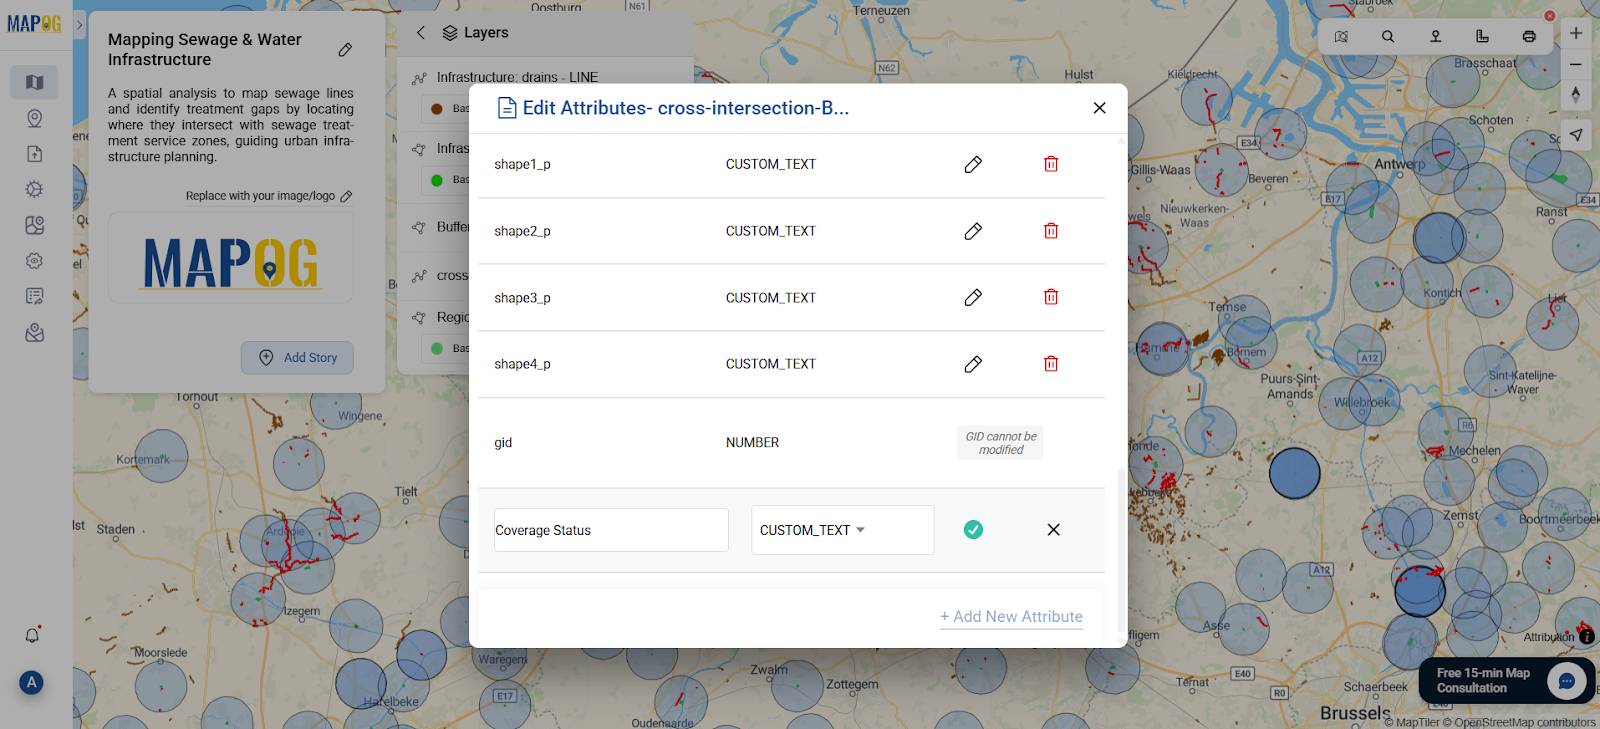
Step 7. Add Attributes for Planning
Firstly, use MAPOG’s layer editor to tag features with custom fields:
- Coverage Status: Covered / Uncovered
- Priority Level: High / Medium / Low
- Recommended Action: Extend / Monitor / New STP
Therefore, these attributes make your data ready for reports and decisions.
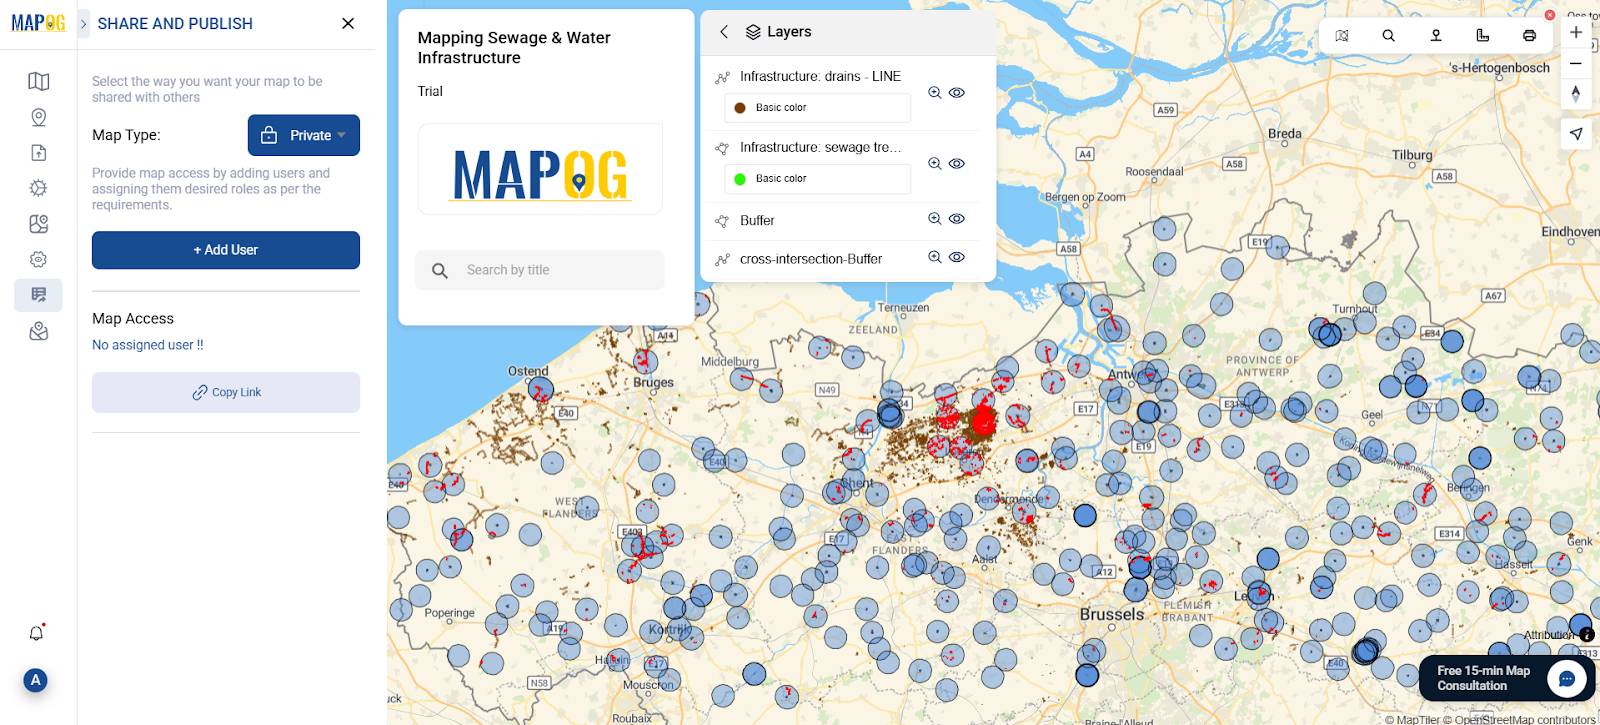
Step 8. Share or Export the Final Map
Once your map is complete:
- Use “Publish & Share” to make the map private or public to view.
- Then, Embed the map in planning reports or presentations
Industry Use & Benefits of Mapping Sewage Infrastructure Coverage
Mapping sewage lines and water through interactive infrastructure maps is a powerful tool for:
- Urban Planners: Identify sewage coverage gaps
- Municipal Engineers: Evaluate and improve network design
- Environmental Agencies: Flag potential contamination zones
- Policy Makers: Use map data to support sanitation funding and policy
This works just like the Creating Border Intersections tool, where intersecting jurisdictional boundaries improve governance. In fact, it’s about service overlaps and voids that impact public health.
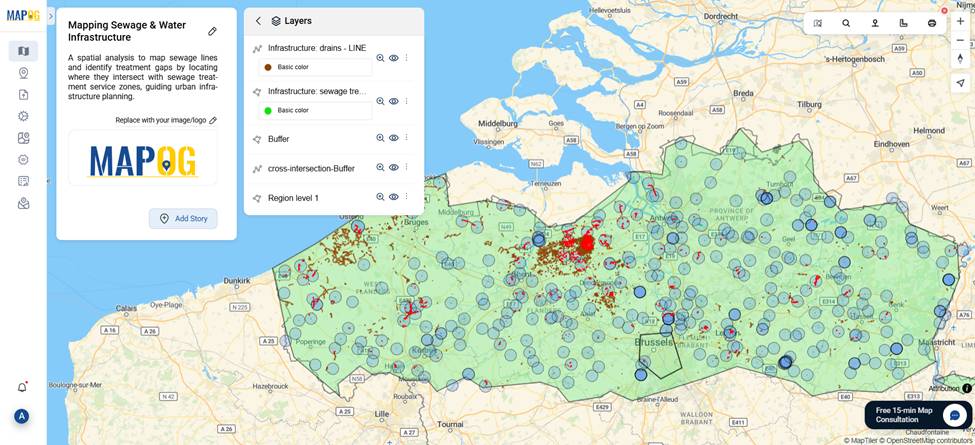
GIS Data Used
To map Belgium’s sewage infrastructure effectively, the following GIS layers were used from the MAPOG GIS Data Library:
- Drain Lines (representing flow paths)
- Sewage Treatment Plant Polygons
- Administrative Boundaries
Conclusion
Therefore, with MAPOG, planners can go beyond static layouts and build interactive, GIS-powered maps. Tools like Buffer, Cross Intersection, and the Style Editor turn complex underground networks into stories that support infrastructure decisions.
Each mapped cross-point is a planning opportunity. Whether you’re identifying underserved areas, proposing new STPs, or conducting environmental assessments, MAPOG helps turn data into action.