Nowadays, mapping sewage and drainage systems has become a smarter and more data-driven approach to urban planning and environmental safety. In particular, mapping such infrastructures helps identify pollution risks, optimise maintenance, and prevent disasters. One powerful way to achieve this is through the use of spatial tools like buffer zones and cross-intersection methods. By doing so, planners can better visualize how sewage discharge points impact surrounding areas—especially drainage channels—thus enhancing decision-making and promoting long-term sustainability.In this blog, we’ll break down how this kind of mapping works, step by step, using tools available on MAPOG.
Key Concept: Why Use Cross Intersection for Drainage Mapping?
The term “mapping sewage and drainage systems” refers to the spatial process of plotting key wastewater infrastructure—like discharge points and drain channels—onto an interactive map. Cross intersection analysis helps determine overlaps or influences between multiple layers, such as how far sewage may impact natural or constructed drains. Combined with buffer zones, this approach creates clarity around environmental exposure and helps guide interventions.
Flood Risk Mapping with Interactive Web Maps: SaaS Approach explores how modern SaaS-based solutions are revolutionizing the way we visualize and respond to flood hazards. This quick read reveals how interactive web maps are not only making flood risk data accessible, but also actionable and real-time—ideal for urban planners, emergency teams, and curious minds. So, don’t miss how tech is reshaping disaster preparedness!
Step-by-Step: Mapping Sewage and Drainage Systems
1. Upload Sewage Points and Drain Channels
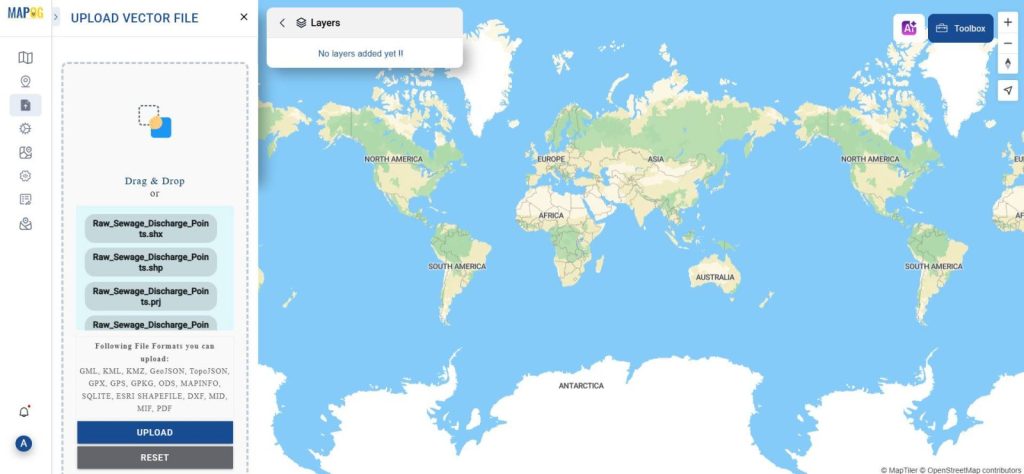
“After saving your project, proceed to the MAPOG map interface. First, upload your spatial data by selecting “Upload Vector file” from the Add Upload section in the left panel. This includes data such as sewage discharge points (in CSV, SHP, or GeoJSON format) and drainage lines.”
2. Style the Map for Clarity
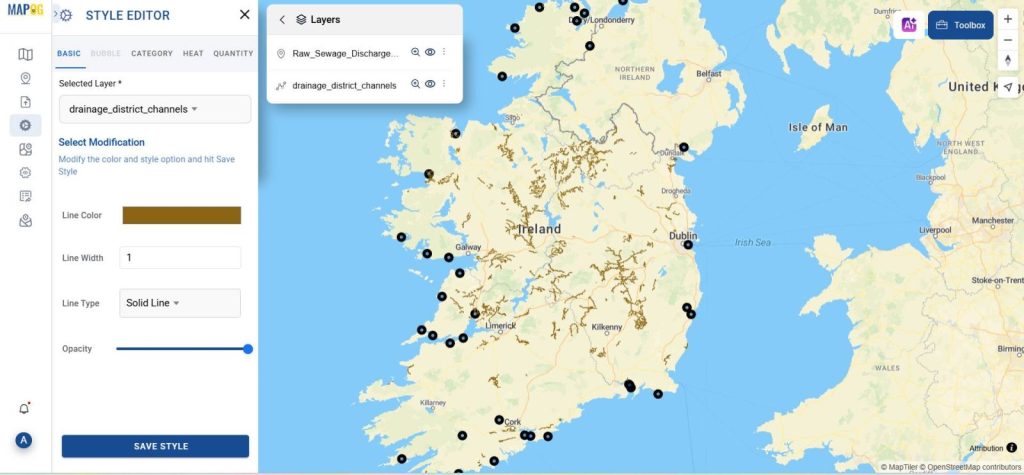
Using MAPOG’s style editor, assign distinguishable colors to sewage points and drains. This visual separation makes analysis easier, especially when dealing with dense urban layouts.
3. Create 10km Buffer Zones Around Discharge Points
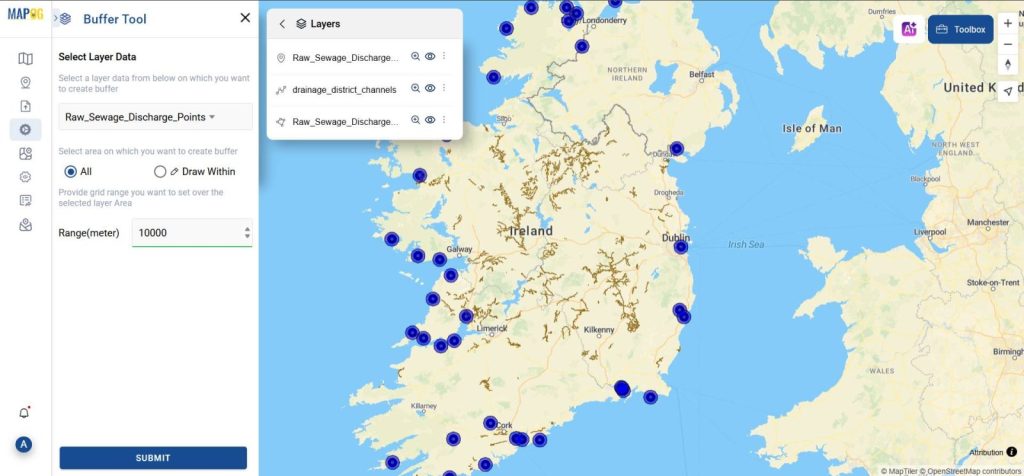
The buffer tool in process data in MAPOG, therefore, allows you to generate circular zones around each discharge point. In this project, for instance, 10km buffers were created to represent potential zones of impact.
4. Run Cross Intersection Analysis
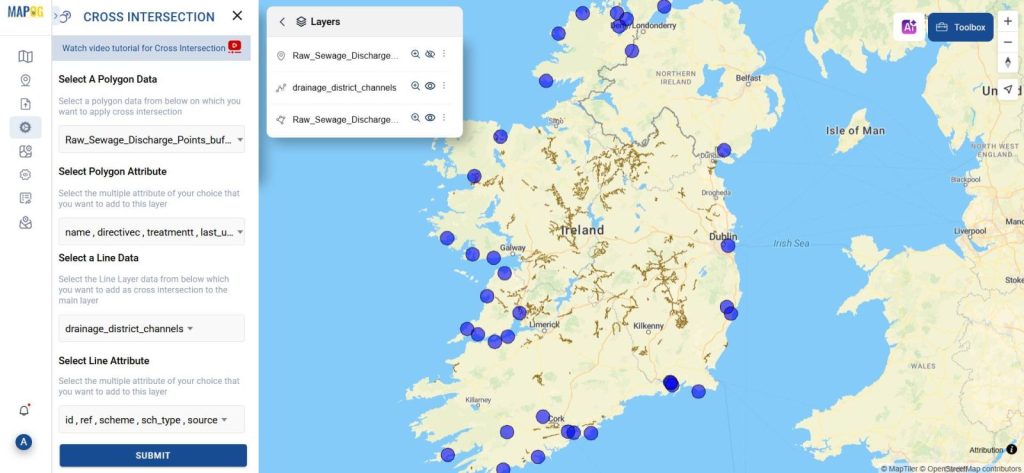
Next, use MAPOG’s cross intersection feature. Here, mapping sewage and drainage systems involves providing buffer points and drainage lines along with important attributes to detect which drain channels fall within the 10km buffers. These intersecting drainage pathways are automatically highlighted—enabling focused action or further analysis.
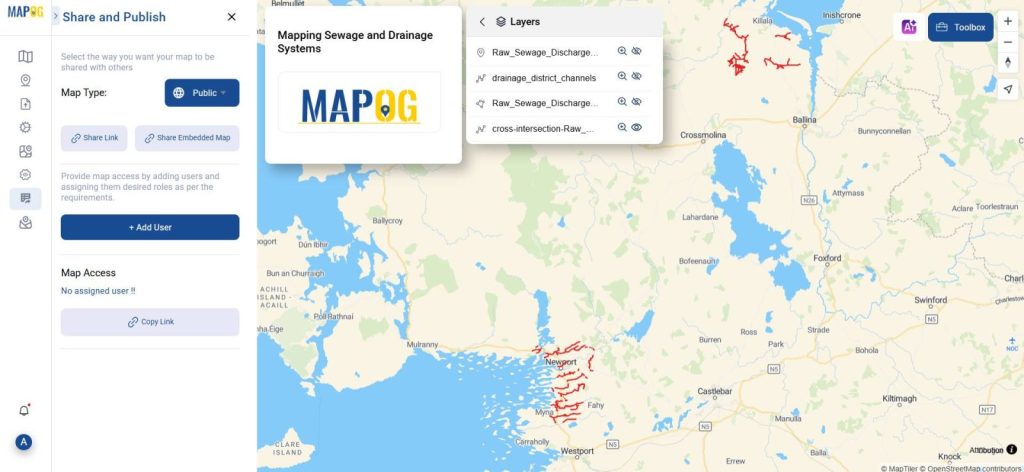
5. Export and Share Your Findings
Once mapping is complete, export your results or embed your interactive map into a presentation or website using publish and share option. This format helps teams visualize risk zones or communicate clearly with stakeholders.
Industry Use & Benefits of Drainage Mapping
Mapping sewage and drainage systems with cross intersection analysis is crucial for:
- Urban Planners to prevent flooding and contamination
- Environmental Scientists to track pollution spread
- Government Bodies to prioritize cleaning or repairs
Benefits include:
- Firstly, faster decision-making leads to more efficient processes.
- Additionally, it helps in reducing contamination risks, ensuring better safety measures.
- Finally, cost-effective infrastructure upgrades provide long-term sustainability and economic benefits.
Discover how to streamline your water flow analysis in “Extracting Drainage Networks for Hydrological Analysis: Step-by-Step Guide with GIS Tools.” This quick guide walks you through practical GIS techniques to accurately map drainage paths. Whether you’re a researcher, planner, or environmentalist, it’s ideal for smarter watershed management—because ultimately, terrain tells the story of water.
Conclusion: Make Smarter Drainage Decisions with Maps
By combining buffer zones and cross intersection analysis in MAPOG, professionals can build insightful, layered maps that show where sewage discharge points are impacting surrounding drain channels. This process not only enhances environmental planning but also adds a visual layer to technical data—making it easier for teams to act swiftly and responsibly.
Have you ever tried mapping sewage and drainage systems in your locality or city project? If so, feel free to share your experience, or alternatively, ask any questions you may have in the comments!
Here are some other blogs you might be interested in