In today’s fast-evolving urban landscape, public safety has become a top priority for city planners and law enforcement agencies. One of the most effective ways to enhance security is through the strategic placement of CCTV cameras — and this is where Geographic Information System (GIS) tools play a transformative role. By mapping surveillance infrastructure alongside real-time crime data, GIS enables a smarter, data-driven approach to crime prevention and urban planning. In the following pages, we will explore how modern GIS platforms like MAPOG can be used to visualize and analyze the process of Mapping CCTV Cameras and Crime Zones with GIS Tools, uncovering patterns, identifying security gaps, and ultimately building safer communities.
Key concepts:
Buffering in GIS:
- Buffering is a spatial analysis technique used to create zones around a geographic feature.
- In the context of CCTV mapping, buffers are created around each camera location to represent their effective surveillance radius
CCTV Camera Buffers:
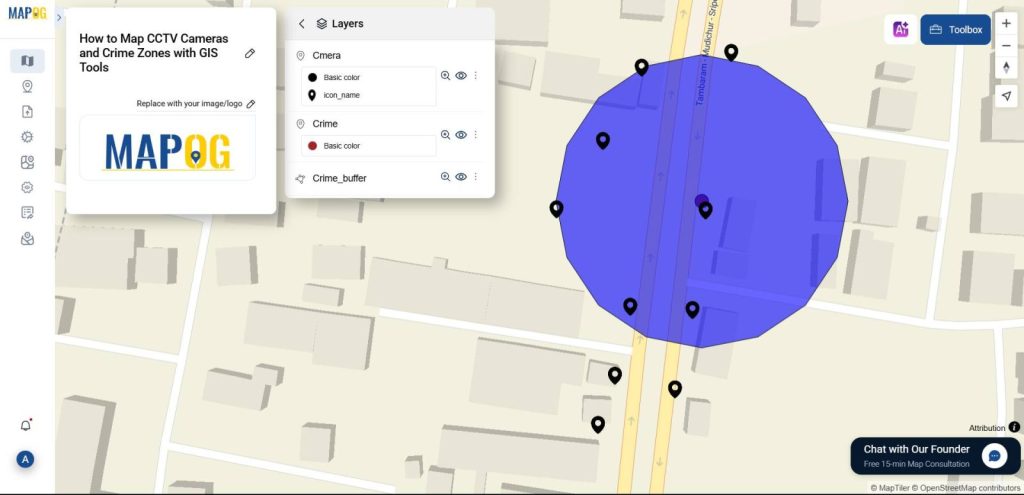
- These circular zones show which areas fall under visual surveillance.
- Helps determine coverage gaps or overlaps between cameras.
Overlay Analysis:
- Buffer zones of CCTV cameras are overlaid on crime maps.
- Helps assess: Which high-crime areas are within surveillance zones and Which zones remain uncovered or under-monitored.
Steps to Map the CCTV Cameras and Crime Zones:
1. Access MAPOG’s Mapping Platform
Visit MAPOG platform in your browser.
Click on “Create New Map” in the top- right corner of the homepage to start creating your own map.
Place the following details on your map:
- Add Title of your map. Description telling us what it’s about. And a nice Image to symbolize your theme.
- After that, click Save.

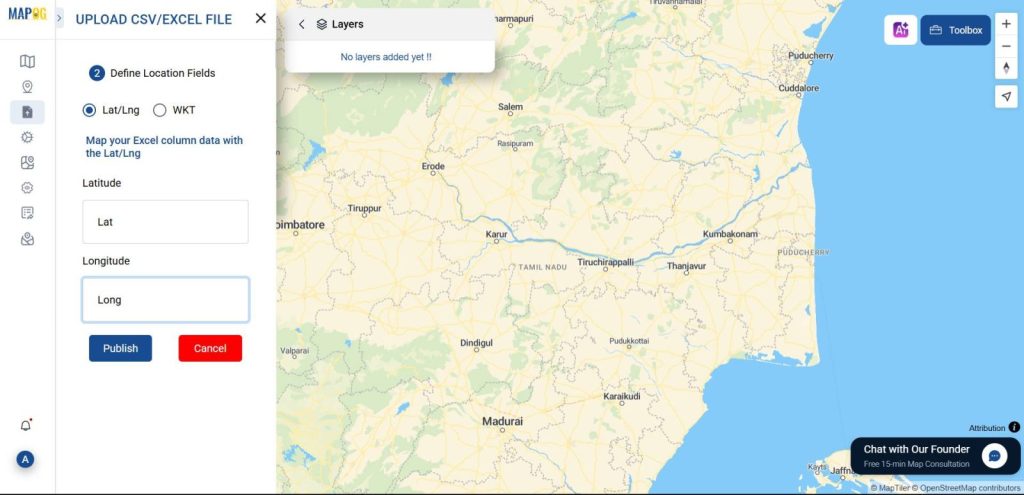
Step 2: Uploading and Publishing Location Data:
Next, navigate to the “Add/Upload File” section. Then, click on the “Upload CSV/Excel File” option. At this stage, upload your CCTV camera location file and click “Upload.” Once the upload is complete, two options will appear — Latitude and Longitude. Now, assign the first column to Latitude and the second column to Longitude. Finally, click “Publish” to complete the process.
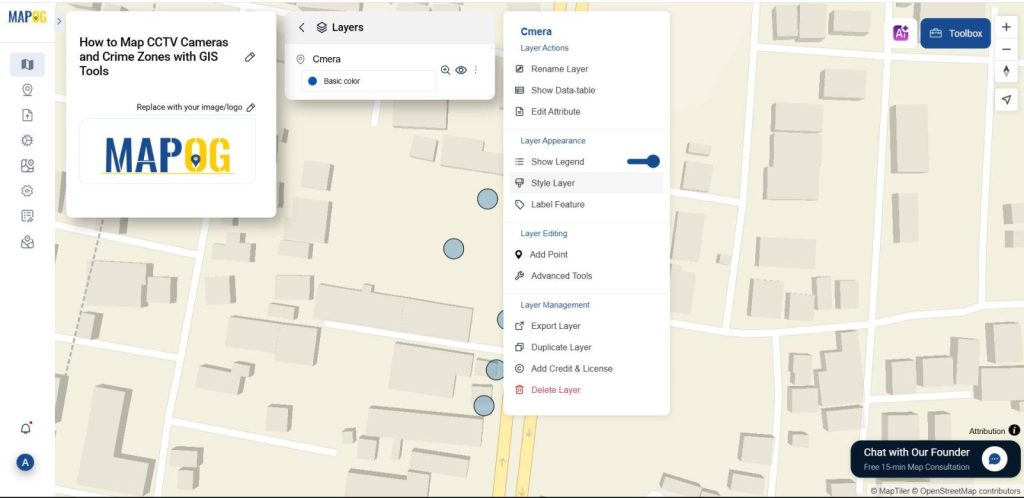
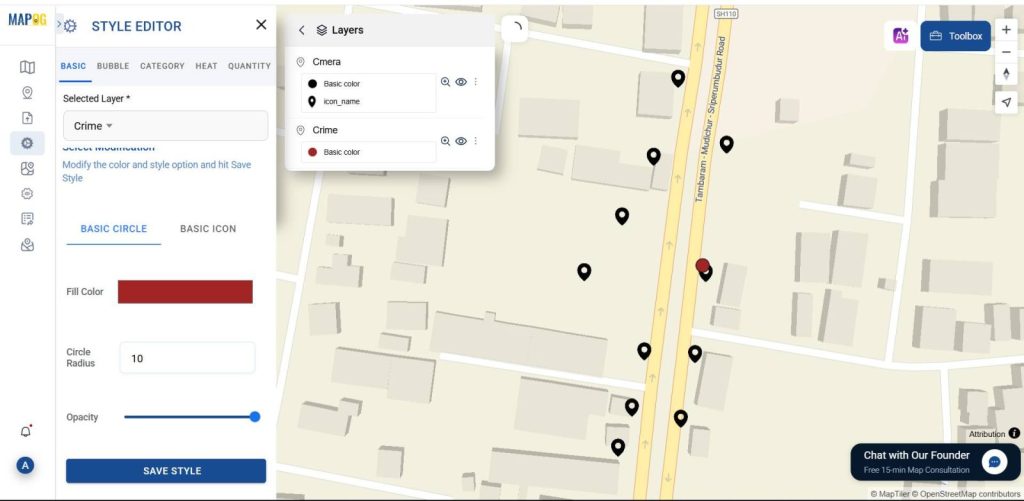
Step 3: Customizing Location Icons
Additionally, you can customize your location icons by going to the “Style Layer” option. From there, select a different icon to better represent your data points on the map and enhance visual clarity.
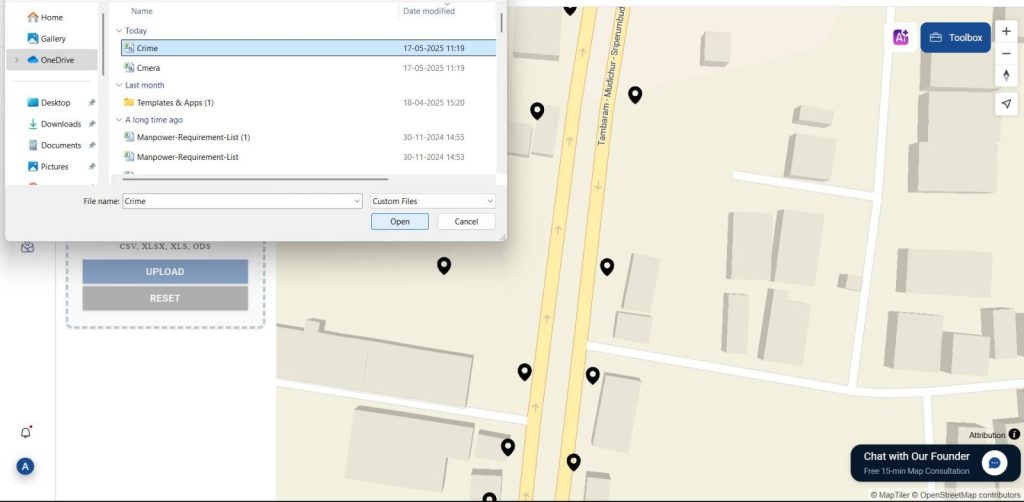
Step 4: Uploading Crime Location Data
Next, upload your crime location data using the same method you used for the CCTV camera locations. To do this, go to the “Add/Upload File” section and select the “Upload CSV/Excel File” option. Then, upload your crime data file and click “Upload.” Once the file is uploaded, map the appropriate columns by assigning the first to Latitude and the second to Longitude. After that, click “Publish” to display the crime locations on the map. Additionally, you can customize your location icons by navigating to the “Style Layer” option and selecting an icon that best represents the crime data points.
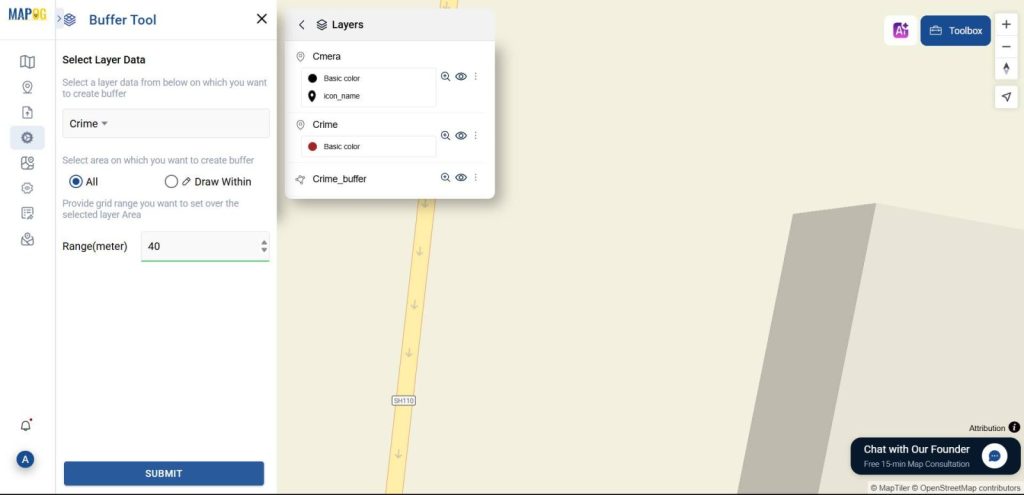
Step 5: Performing Buffer Analysis on Crime Locations
Go to the “Process Data” option and select “buffer tool.” In the Select Layer Data dropdown, choose your crime location layer. Then, set the desired buffer range (e.g., 100 meters) and click “Submit.” The system will generate the buffer zones around each crime location, and you’ll see the result displayed on the map. This is the way of Mapping CCTV Cameras and Crime Zones with GIS Tools.
Who Can Take Advantage of mapping CCTV and Crime Zone using GIS tools
1. Law Enforcement Agencies
- Identify surveillance gaps and high-crime areas needing more coverage
- Improve investigation efficiency by locating nearby CCTV footage
2. Urban Planners and Smart City Developers
- Design safer city layouts with integrated surveillance planning
- Ensure new infrastructure includes proper camera placement
3. Municipal Corporations and Local Governments
- Allocate resources effectively based on crime and coverage data
- Monitor and evaluate public safety projects with spatial accuracy
Conclusion:
Mapping CCTV Cameras and Crime Zones both insightful and efficient with the help of GIS tools like MAPOG. You can uncover surveillance gaps, visualize crime patterns, and create powerful data-driven maps that support smarter security planning and community safety initiatives.
Explore other Blogs :
Crime Data Mapping: Finding Patterns and Trends Using GIS
How To Create Population Density Map by Districts
Power Grid and Infrastructure mapping and planning using GIS