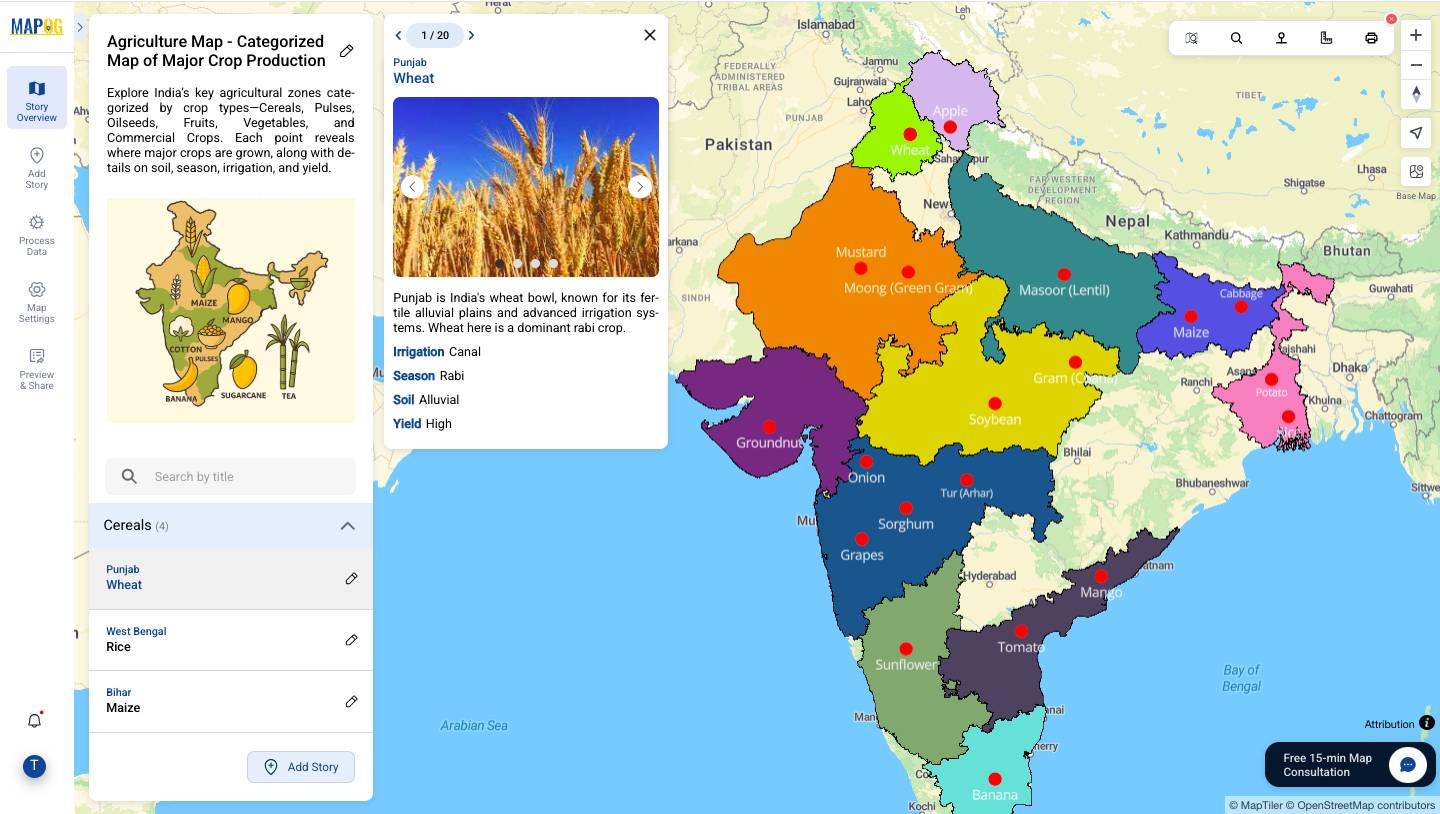
Mapping crops on a map platforms provides an effective way to categorize, analyze, and visualize agricultural data. By organizing crop information into clear layers, farmers, planners, and researchers can better understand agricultural trends and regional strengths. This method not only helps in identifying where each crop thrives but also supports long-term planning, monitoring, and sharing insights. Since you can map crops on online map tools with categories in MAPOG, it becomes easier to spot production patterns, track seasonal changes, and plan future farming strategies efficiently.
Key Concepts of How to Map Crops on Online Map
Categorizing and mapping crops on online map systems means grouping similar data points—like crop types—under specific labels or themes. Each mapped point contains metadata such as the season, irrigation method, soil type, yield, and production quantity. Consequently, users can quickly interpret agricultural potential across regions. Moreover, when you map crops on online map with detailed attributes, decision-making becomes both informed and data-driven.
Step-by-Step Process to Map Crops on Online Map
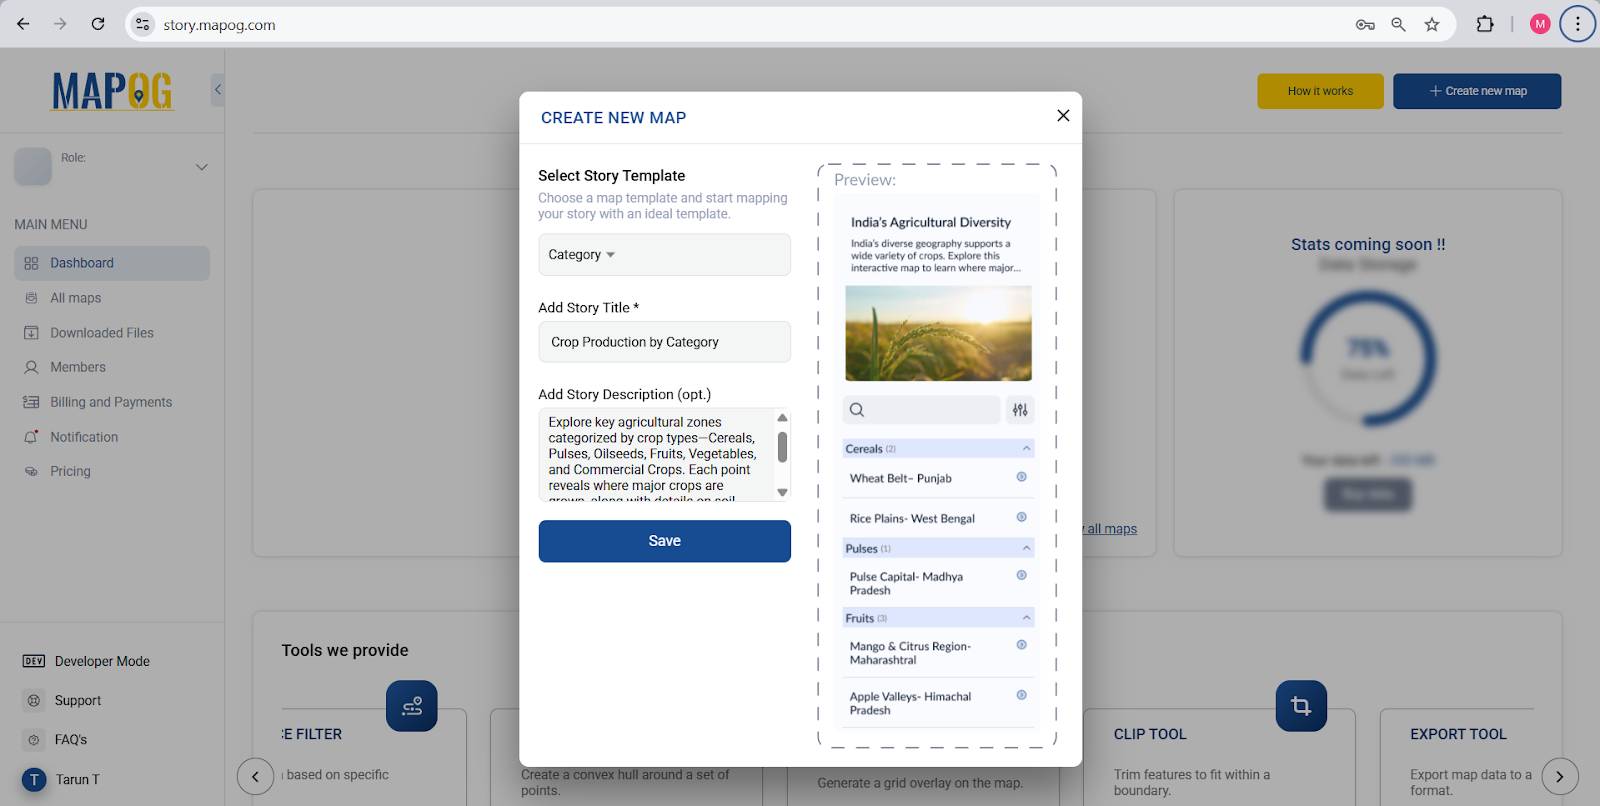
1. Create a New Map Using “Category Map” Type
Begin by selecting the “Category Map” type in the map creation interface. Assign a clear and concise title (e.g., “Crop Distribution by Category”) and a short description explaining the objective of your map.
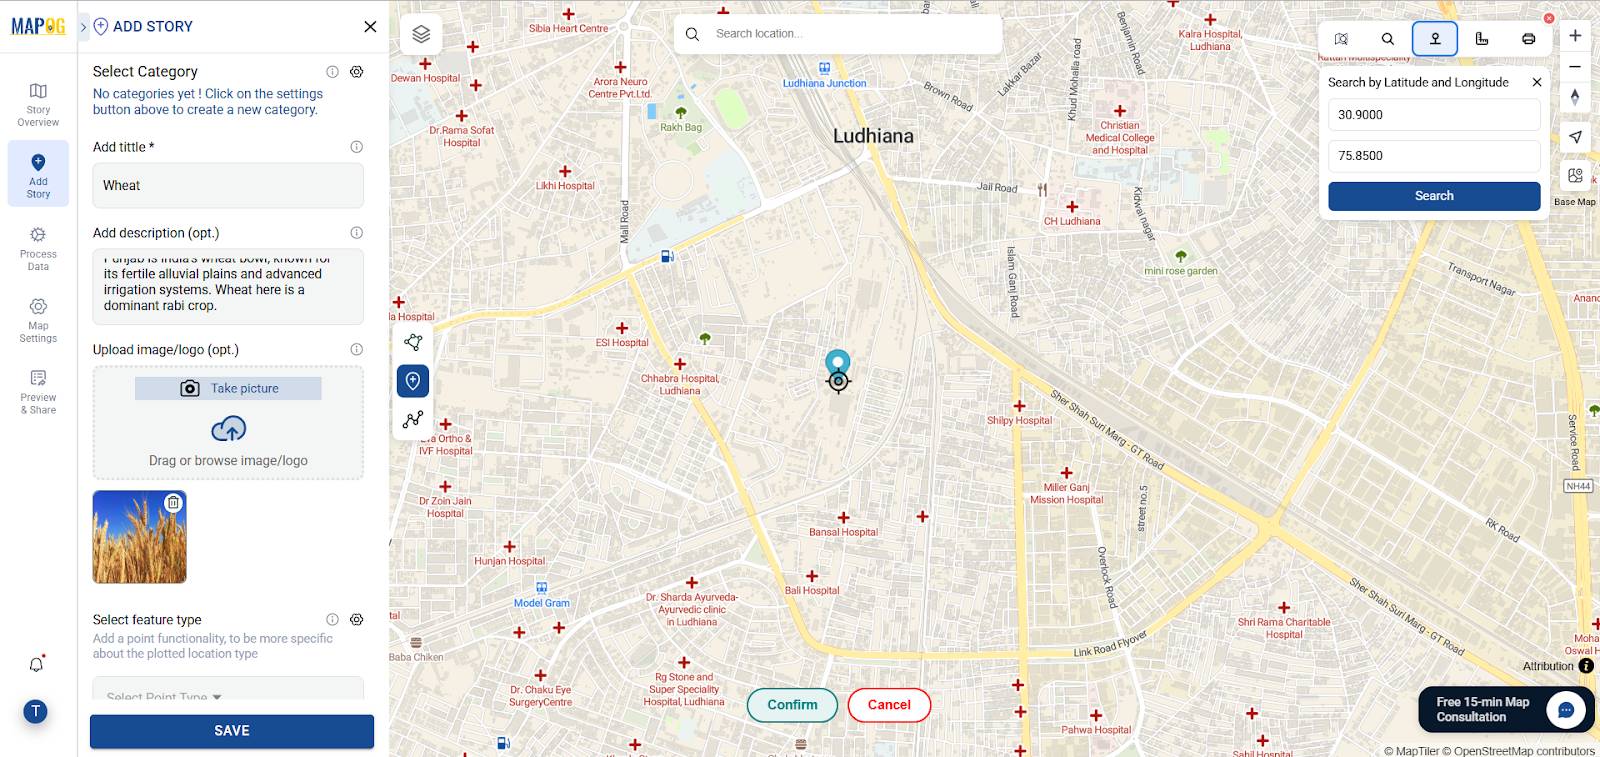
2. Add Your First Point
After coming to the interface, Click on Add story then Add Manually. Enter the latitude and longitude of your first location in search by coordinates option. Click “Confirm” and give the point a relevant title and a brief description. You may also upload an image representing the crop or region.
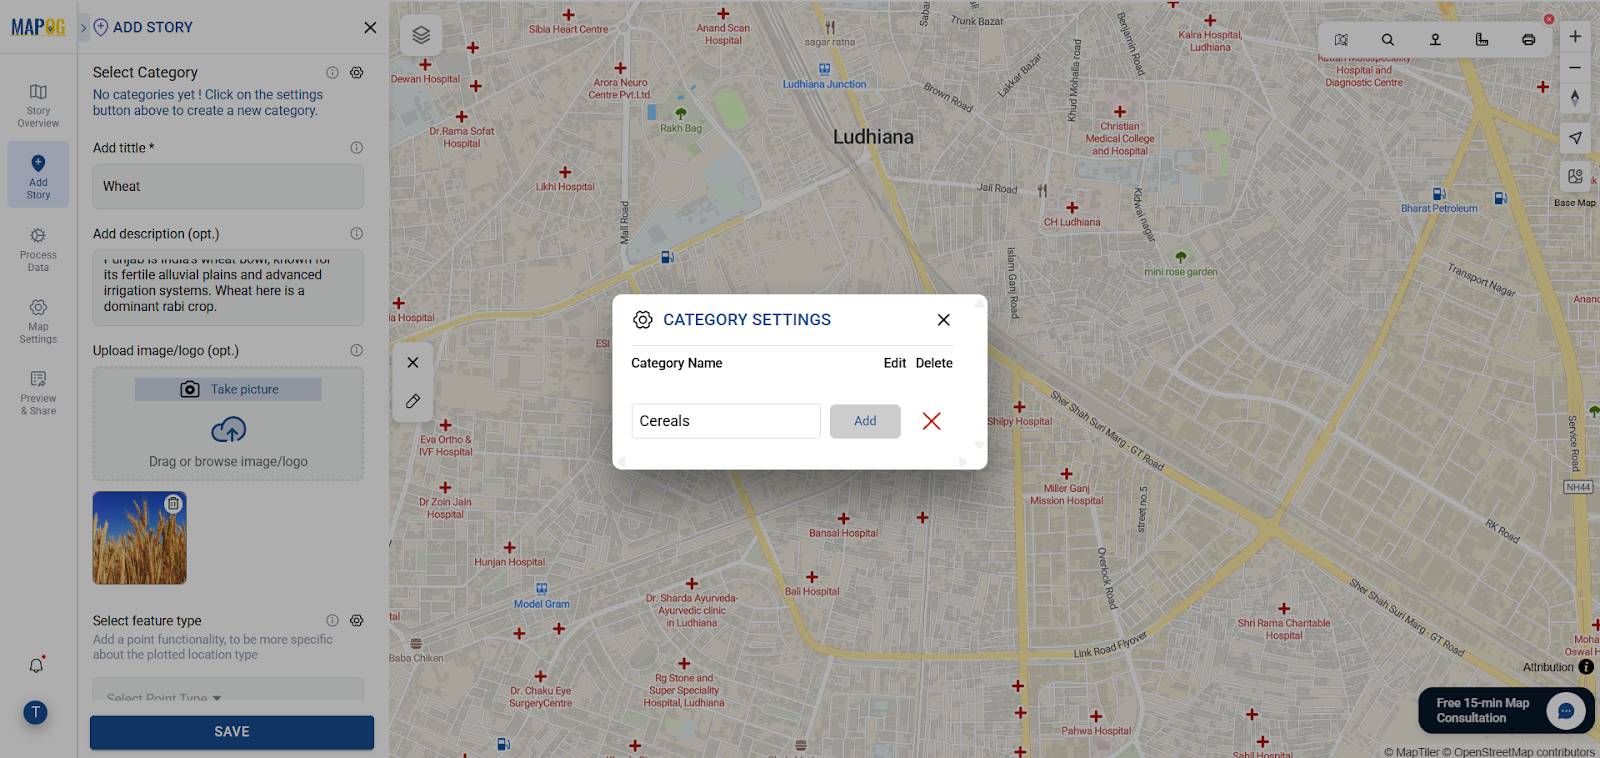
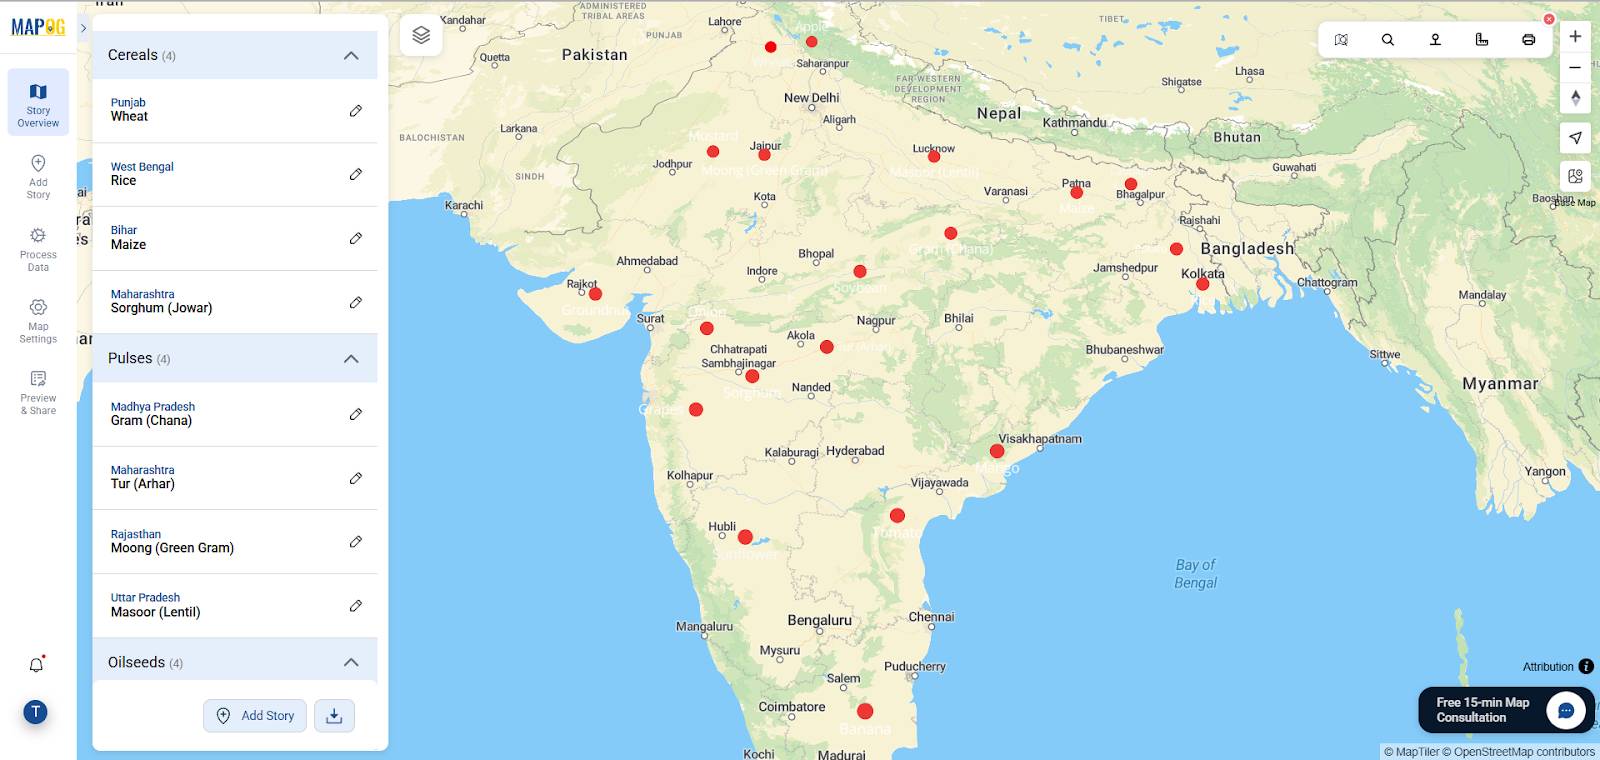
3. Add Categories to the Map
Next, define the categories under which your crops fall. In this case, categories could include: Cereals, Pulses, Oilseeds, Fruits, Vegetables, etc. For the first point, select “Cereals” as the relevant category.
4. Create a Point Type
Point Type refers to the category or kind of place that is being marked on the map. For this example, create a new point type called “Crop Production.
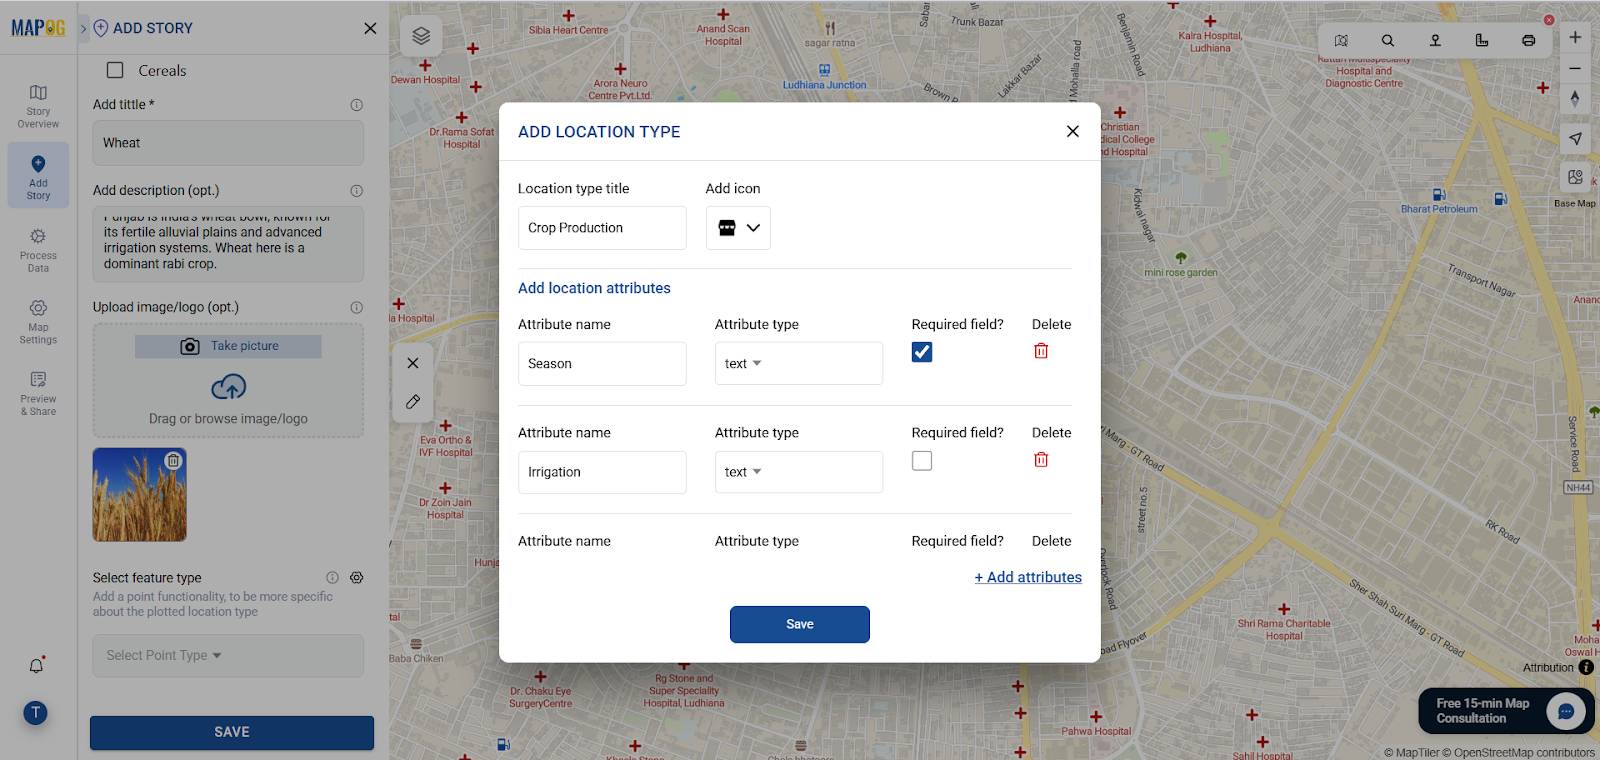
Attributes are the fields associated with a Point Type. These are the specific details that need to be filled in when adding a point. Define attributes relevant to this point type:
- Season (Text)
- Irrigation (Text)
- Soil (Text)
- Yield (Text)
- Production (MT) (Number)
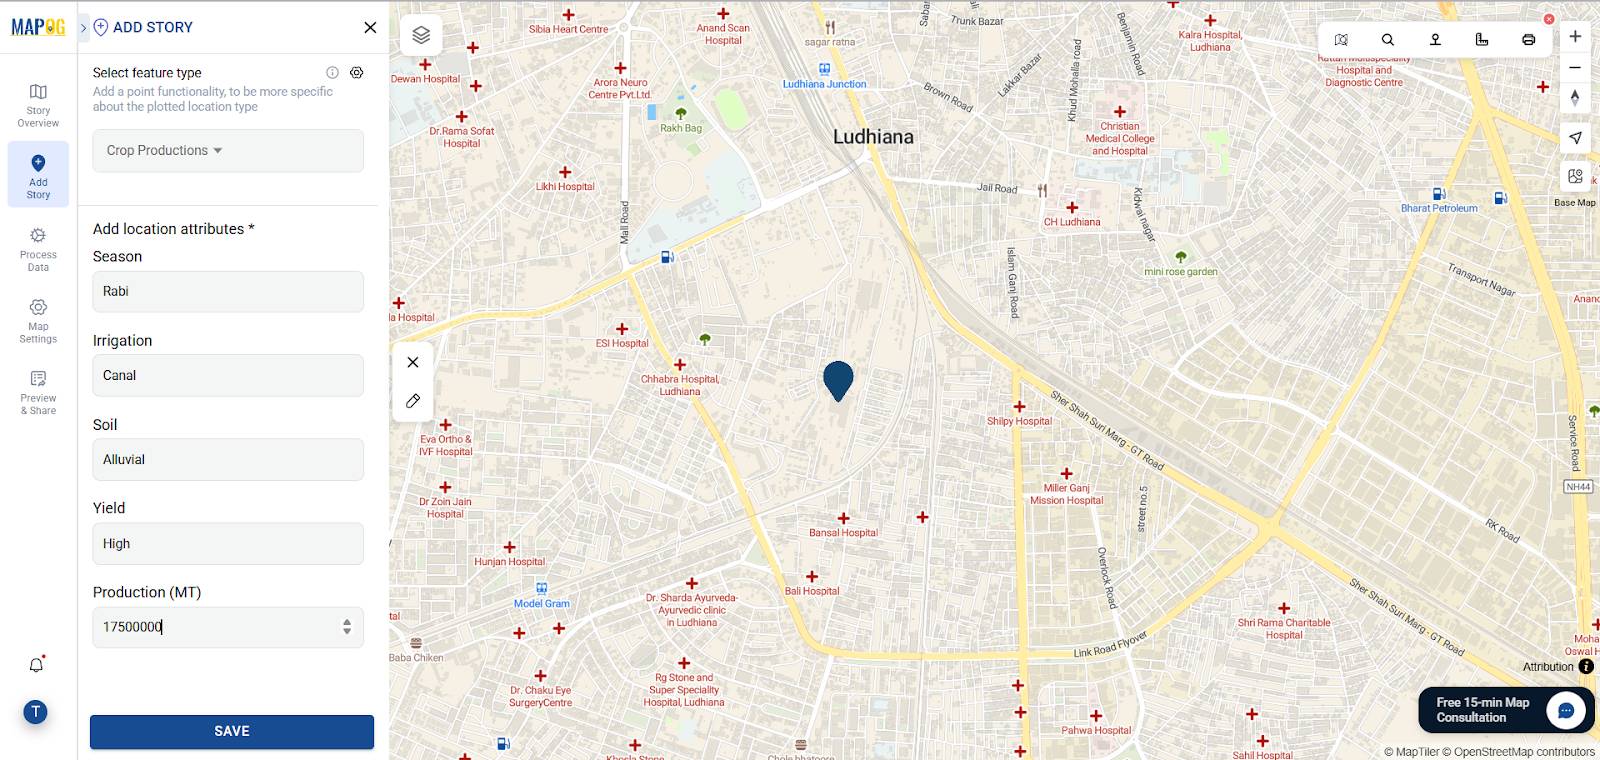
You can set attributes as mandatory fields if required. Save this point type and fill in values while adding or editing each point.
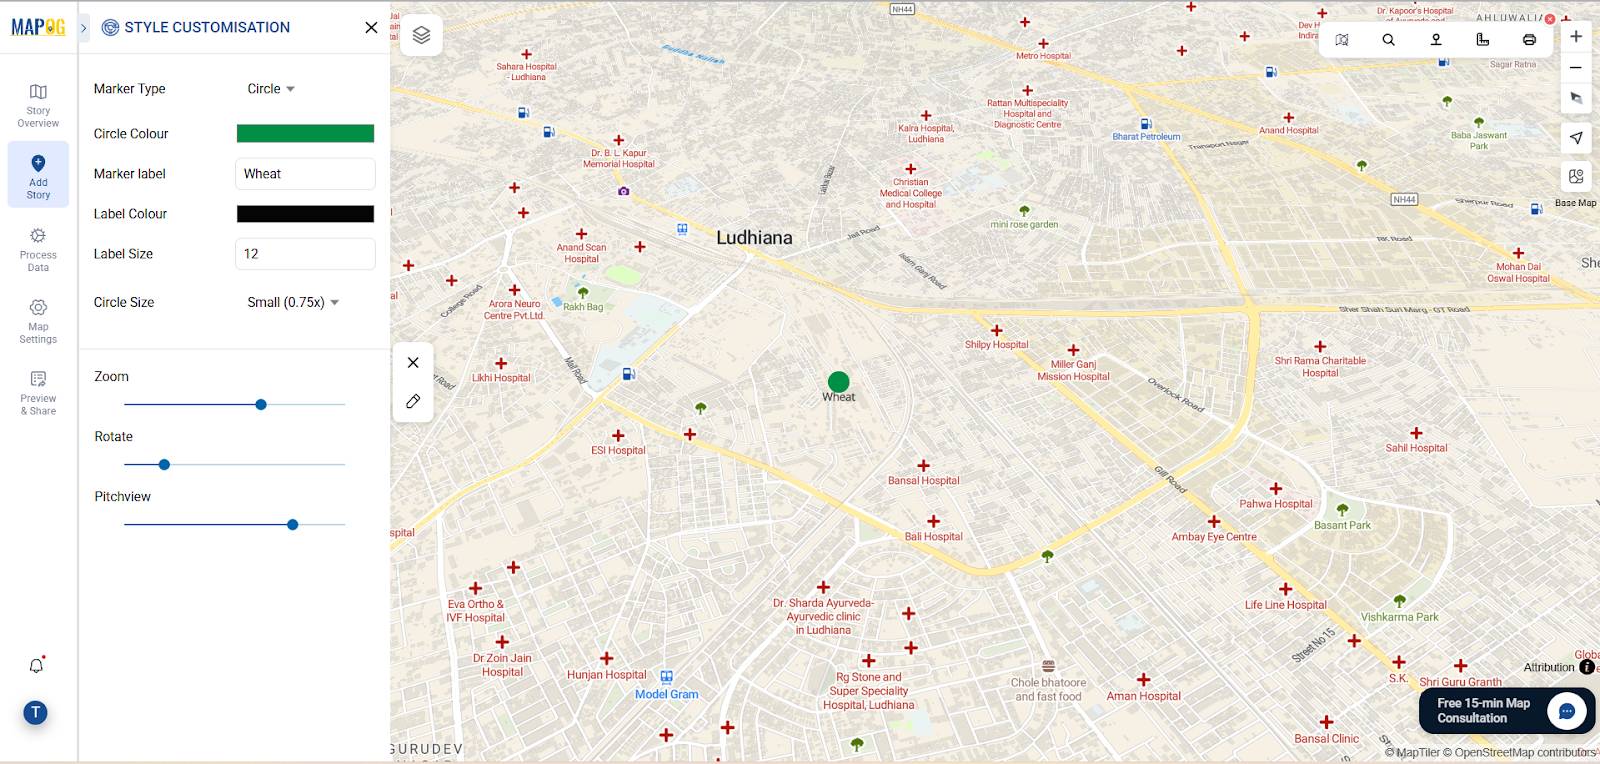
5. Customize Your Points
To make your map visually appealing:
- Change the marker icon to a circle.
- Choose a suitable color for the circle.
- Set label text and label color for clarity.
- Adjust circle size to represent data intensity or importance.
6. Repeat for All Points
Follow the same process for all additional crop points. Assign each to its category, apply the relevant point type, enter attribute data, and customize styling for consistency.
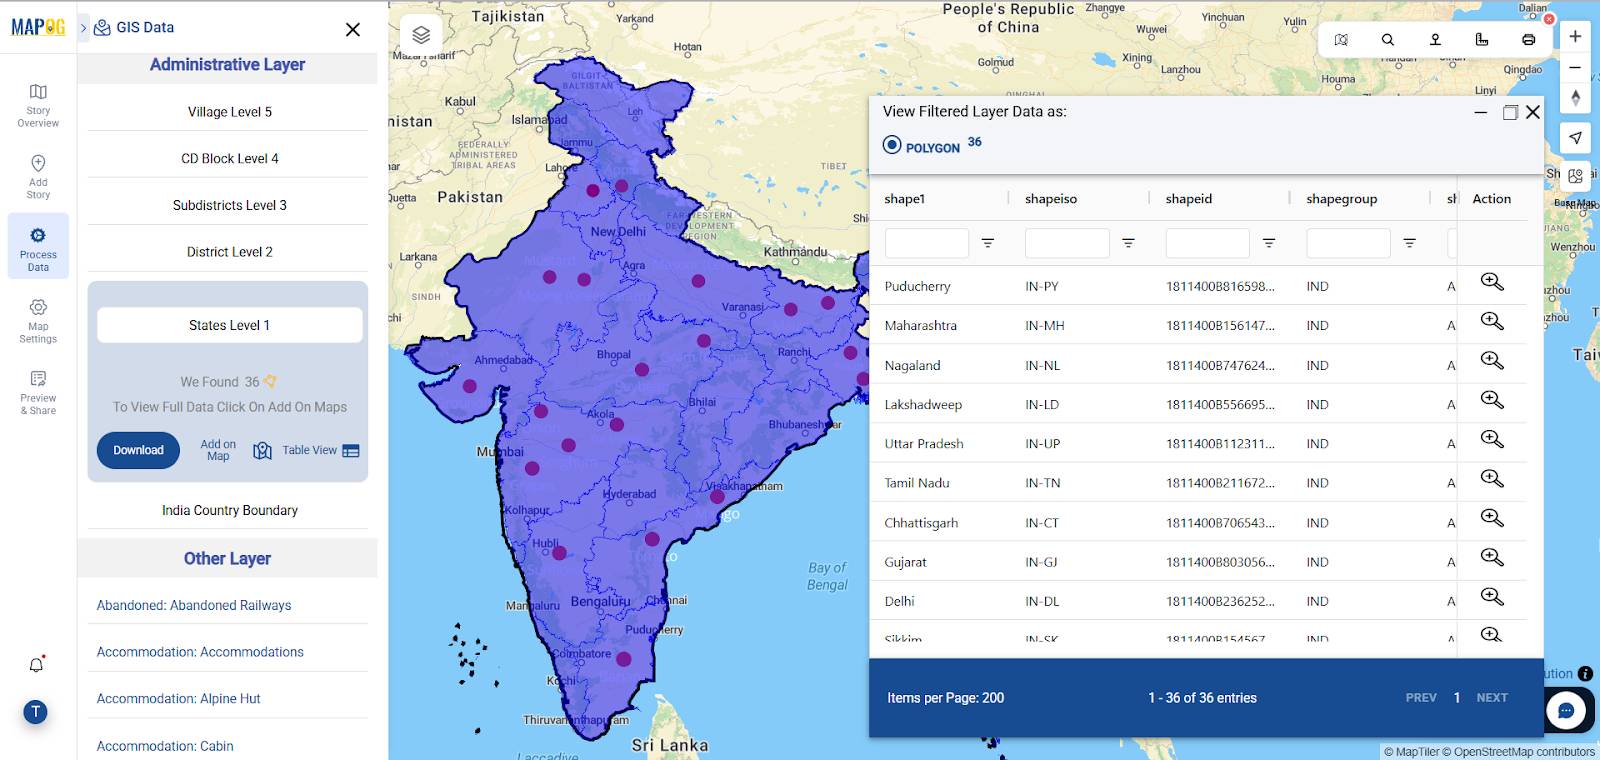
7. Add State Boundaries for Context
To enhance clarity, add state boundaries from the GIS data library. Select country filter states for “India State Level Administrative Boundary,” then add it to your map. Use styling options to color-code based on state name or emphasize regional context.
Major Findings
Categorical mapping of crops reveals key production patterns and crop diversity across regions. It highlights areas with high yield, dependence on irrigation, and soil compatibility—making it an essential tool for agri-planning.
Benefited Industries
- Agriculture & Farming Advisory
- Food Supply Chain & Logistics
- Research & Education
- Government Planning & Sustainability Initiatives
GIS Data Used
Conclusion
By classifying crop data into categories and presenting them visually, planners, farmers, and researchers gain deeper insights into agricultural potential. When you map crops on online map tools with accurate details, transparency increases, resource management improves, and sustainable farming decisions become easier to achieve. This technique bridges data with action, enabling a more productive and informed agricultural future.
Exploring Our Previous Blogs