In real estate development, success isn’t just built—it’s mapped. Today’s developers are moving beyond static brochures to embrace tools like interactive real estate portfolio map. Hence, these dynamic tools allow developers to present their projects with clarity, connectivity, and context.
For example, just as agents use maps to help homebuyers understand surroundings, developers are now turning to MAPOG to turn their entire project pipeline into a cohesive, interactive experience.
Moreover, embedding maps into a developer’s portfolio doesn’t just enhance presentation—it builds confidence. Just like in How to Organise Your Property Hunt: Pin Live Locations, Add Photos, and Manage All Details on One Interactive Map, this guide shows how real estate developers can use MAPOG to turn project listings into smarter, location-based narratives.
Key Concept: Why Turn a Real Estate Portfolio into a Map-Based Story?
A mapped portfolio adds more than just location—it adds meaning. Each project becomes a node in a broader story, highlighting:
- Connectivity
- Zoning and infrastructure
- Development timeline
Developers can:
- Visually organize their real estate assets
- Differentiate between completed, ongoing, and proposed sites
- Add data like launch years, built-up area, and amenities
- Filter by type, location, or status
For example, much like in “Create a Real Estate Map with Filters for Price, Location, and Property Type“, MAPOG allows users to add meaningful filters, making exploration and analysis easier for stakeholders and buyers alike.
Step-by-Step: How to Build a Developer Portfolio Map on MAPOG
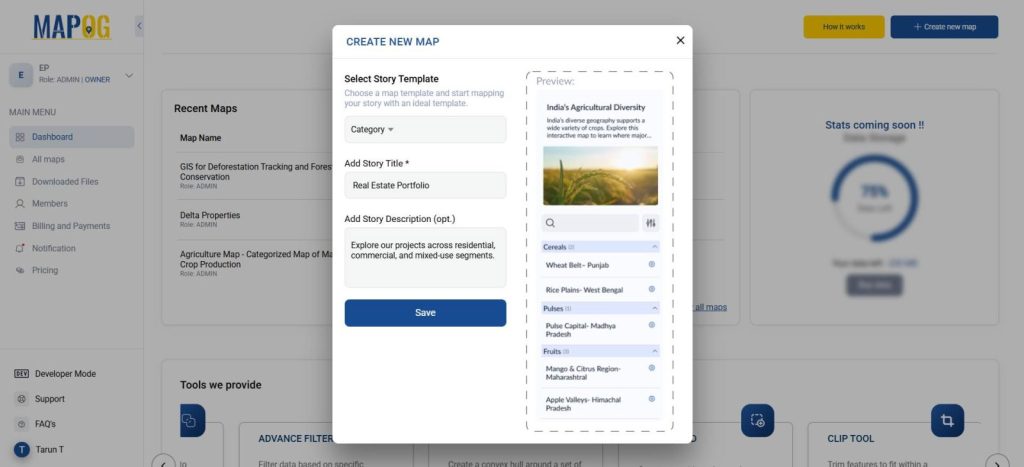
Step 1: Start a New Project
- Log in to MAPOG
- Click “Create New Story Map” → “Category Map”
- Name it something like “Real Estate Portfolio”
- Then, add a brief description.
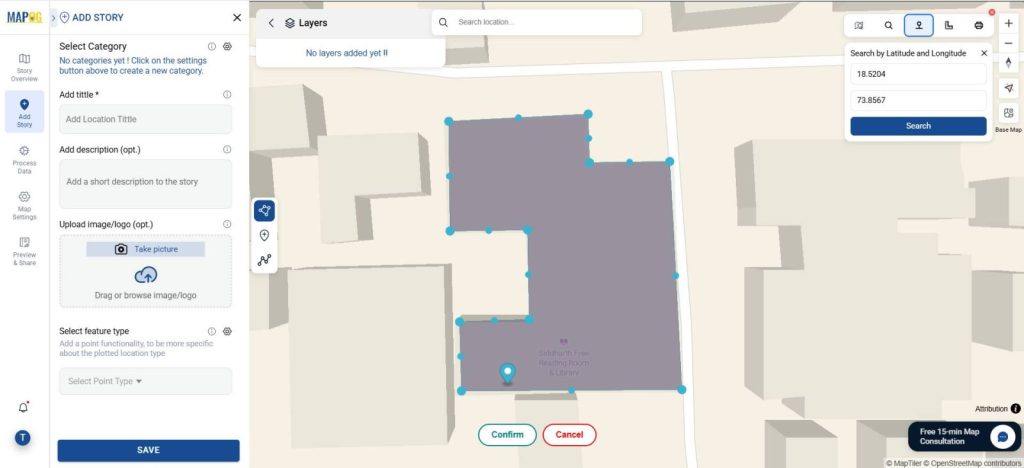
2 Step: Add Project Locations
- Use the search bar or manually locate each site via coordinates
- Click “Add Story” → “Add Manually”
- Use the polygon tool to outline the project footprint or place point markers
- Then, add project name, summary, and an image
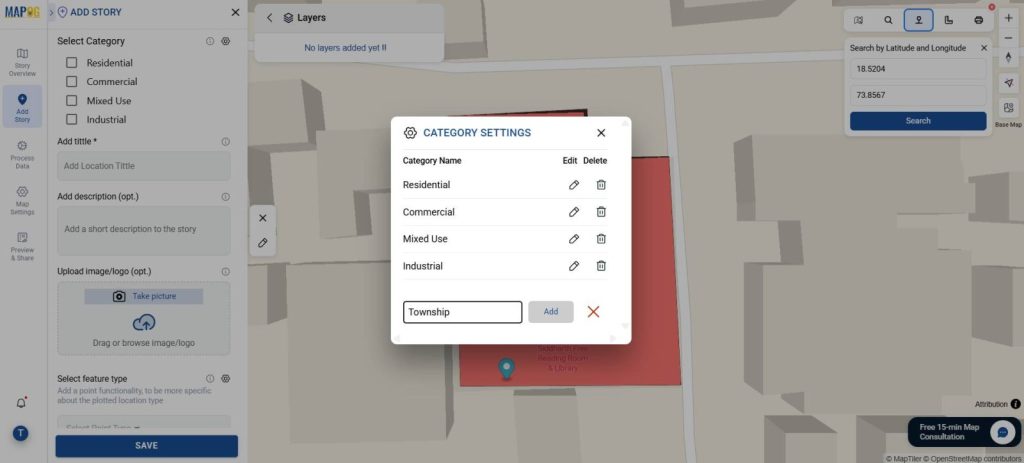
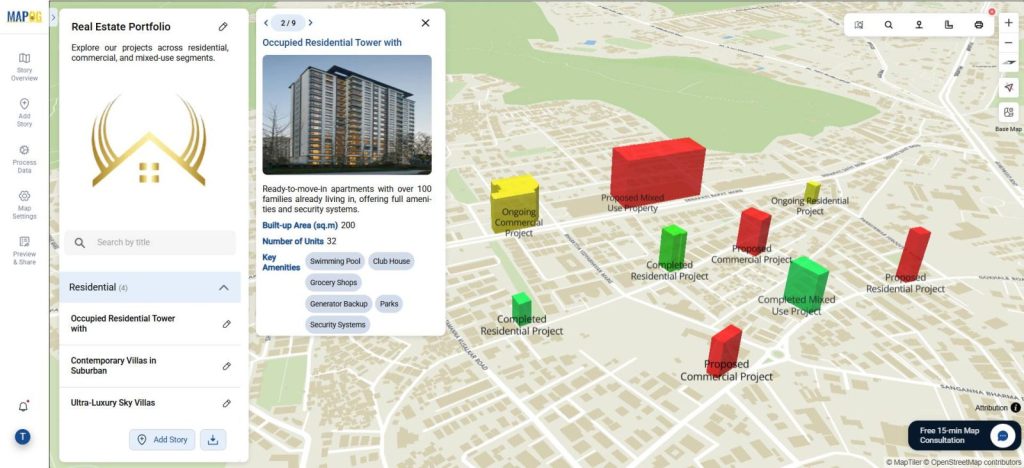
Step 3: Define Categories
Under Category Settings, add project typologies:
- Residential
- Commercial
- Mixed-Use
- Industrial
- Township
Assign each project to the appropriate category. Hence, this allows for filtering and color-coded representation.
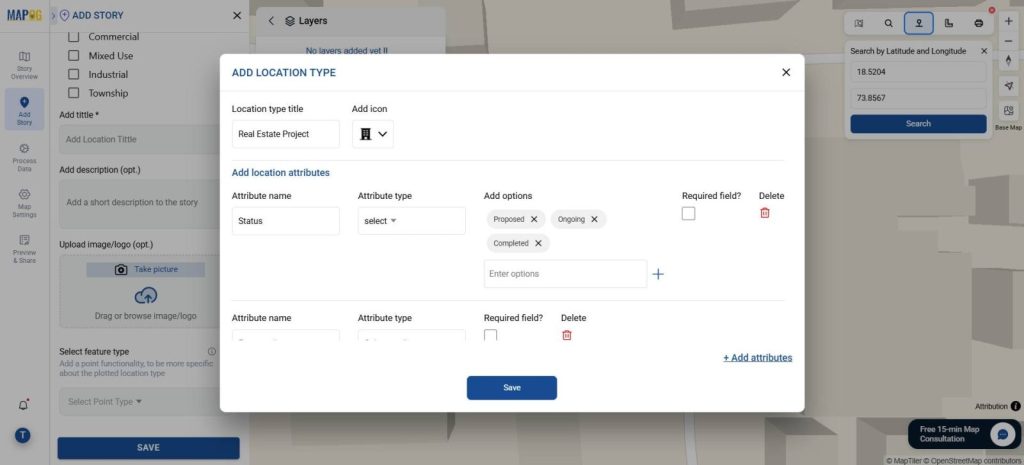
Step 4: Create Custom Location Types
Go to Location Type Management and create a type like Real Estate Project
Add fields like:
- Status (Proposed, Ongoing, Completed)
- Launch/Completion Dates
- Built-up Area
- Number of Units
- Key Amenities
- Connectivity Highlights
After all the fields are configured, hit Save.
Hence, these fields ensure every project pin carries rich, relevant metadata.
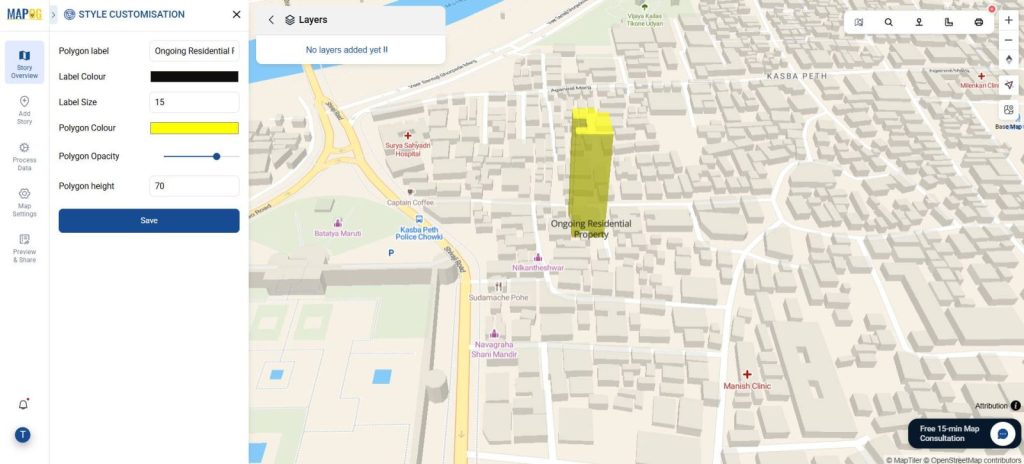
Step 5: Style Your Map for Clarity
Use “Polygon Customization” to improve map visuals:
- Assign colors by status (e.g., green for completed, red for proposed)
- Label project names
- Then, set polygon height to represent project scale
- Adjust opacity to improve layering and readability
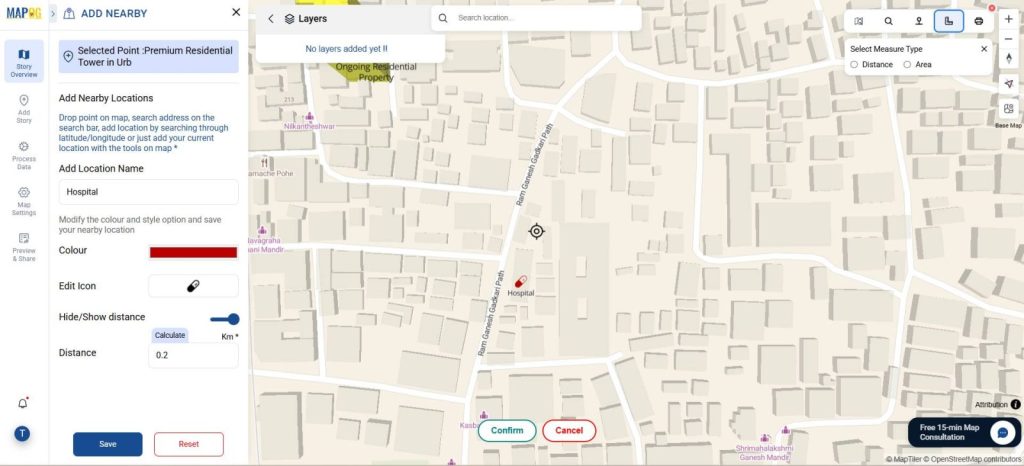
Step 6: Add Nearby Infrastructure
Use the Distance Measure tool to calculate proximity to:
- Highways
- Metro or rail stations
- Parks, schools, or Hospitals
Then, click “Add Nearby” to drop pins showing these facilities with distance indicators (e.g., “Metro Station – 600 m”). This improves understanding of location advantage.
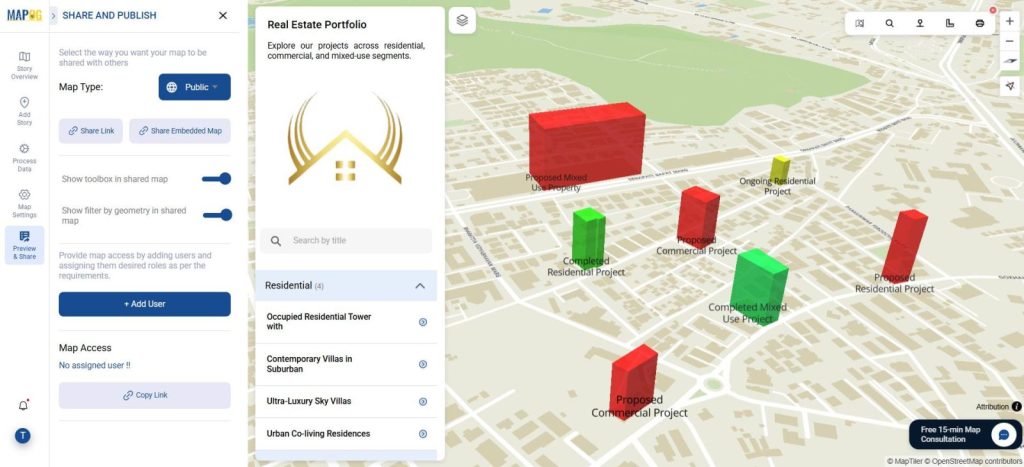
Step 7: Share and Publish
- Navigate to “Share & Publish”
- Choose visibility (Public, Private)
- Then, share via direct link, email, or embed on the developer’s website
Industry Use & Benefits of Mapped Real Estate Listings
Interactive real estate maps are transforming the way professionals work:
- Agents & Brokers use them to market properties with visual appeal
- Developers use them to analyze and present location potential
- Planners & Investors assess infrastructure, growth zones, and land use
For instance, when building a map like “Create a Real Estate Map with Filters for Price, Location, and Property Type”, developers can help stakeholders quickly identify high-value areas and understand how each project fits into a larger urban context.
Hence, MAPOG makes this process visual, organized, and easy to share
Conclusion
Hence, with MAPOG, developers can elevate their portfolio beyond static listings. An interactive real estate portfolio map gives decision-makers a unified view of their assets, locations, and performance—without spreadsheets.
A mapped portfolio isn’t just a digital asset—it’s a strategic one.