To create 3D building maps online without coding once felt out of reach, especially for field teams or planners without access to costly software. Yet in disaster-prone or rapidly changing areas, visualizing buildings in 3D is often essential. It helps people assess risk, communicate clearly, and act faster. That’s where MAPOG comes in: a GIS based storytelling platform that lets you draw, style, and view buildings in 3D, no code required. For grassroots teams and everyday users, it turns spatial data into something visual, practical, and ready to share.
Key Concept: Why 3D Building Maps Without Code Changes the Game
The idea behind 3D building maps is simple: show what exists on the ground in a way that’s easy to understand from above. But until recently, doing that meant using specialized software or writing code, barriers that kept a lot of people out. Platforms like MAPOG, which is a browser-based tool changes that and let you build these maps visually, using just polygons and a few height values.
Step-by-Step Guide to create 3D Building Maps Online Without Coding
1. Start a New Map
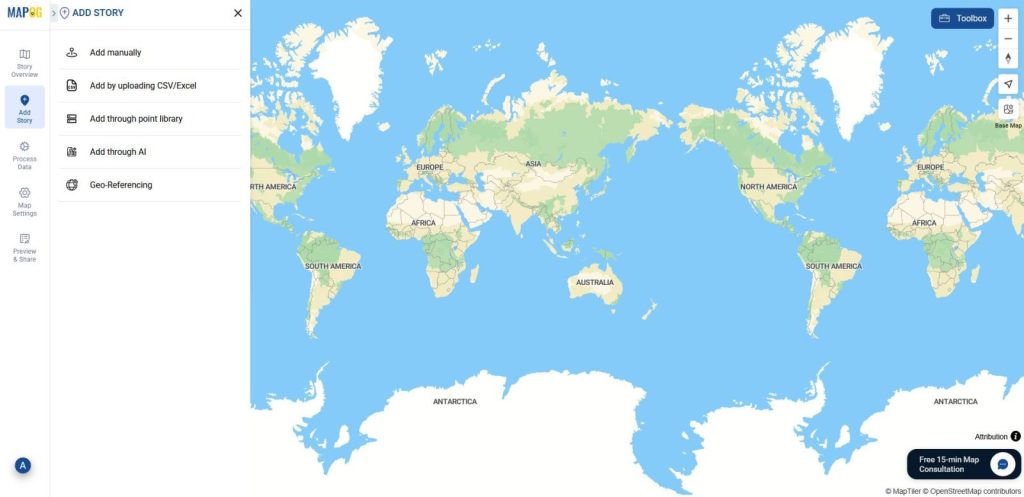
First, go to MAPOG and create a new map. Once inside, navigate to the “Add Story” section and choose “Add Manually” to draw and customize each building individually.
2. Find Area of Interest
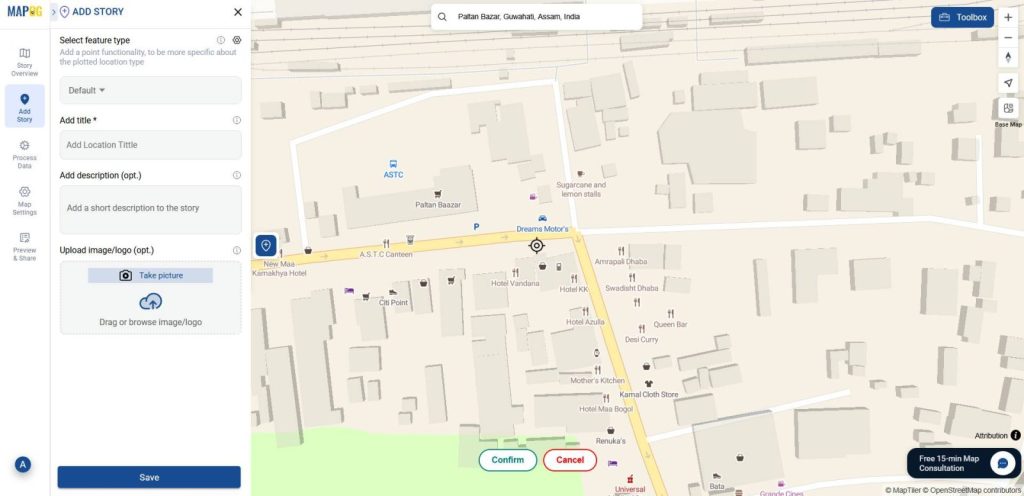
Next, use the Search Tool to locate your target area, you can search by place name, landmark, or use the toolbox and click on the coordinate tool to zoom in the exact location. This helps you center your map before adding any features.
3. Define and create Feature Type
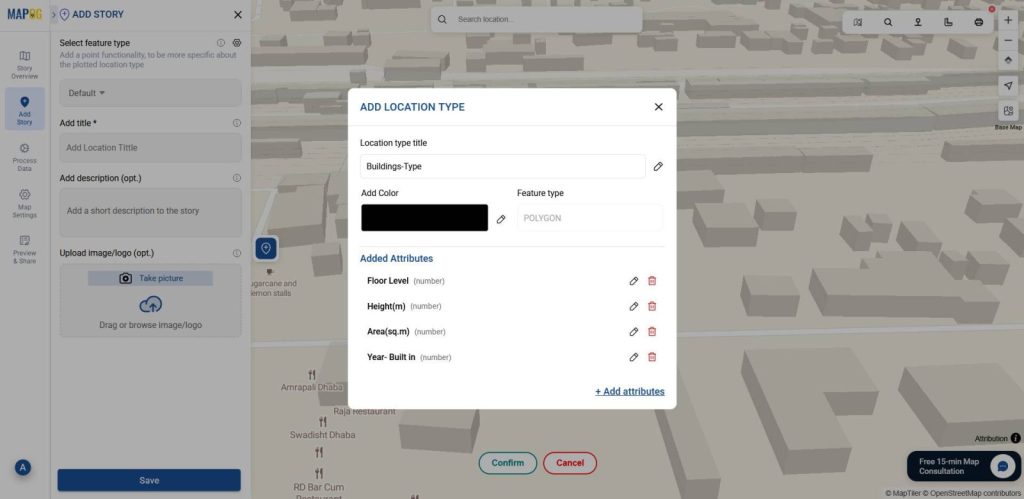
Once your area is set, open the Feature Type Settings to define your data structure. Think of it as creating a template for your features, whether you’re mapping types of buildings, hotels, schools, or shops. For that, give your location type a title and select Polygon as the feature type, since buildings are area-based. Then, add the attributes you want to showcase, such as name, number of floors, area, or height. These fields will later appear in your pop-up details.
4. Draw the Building Footprint
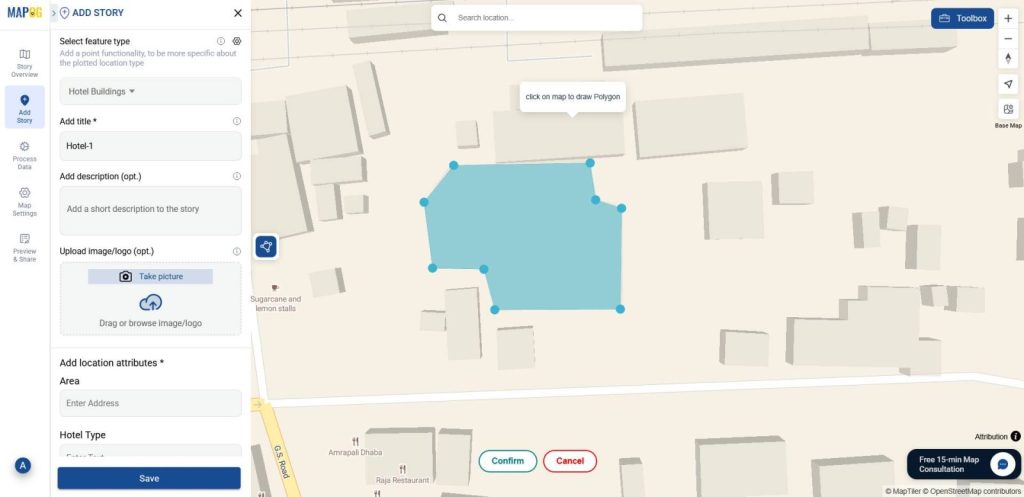
Once your area is set, click the polygon shape icon to begin tracing your building. Click to mark each corner, continue until the full outline is complete, and then click “Confirm” to save the shape.
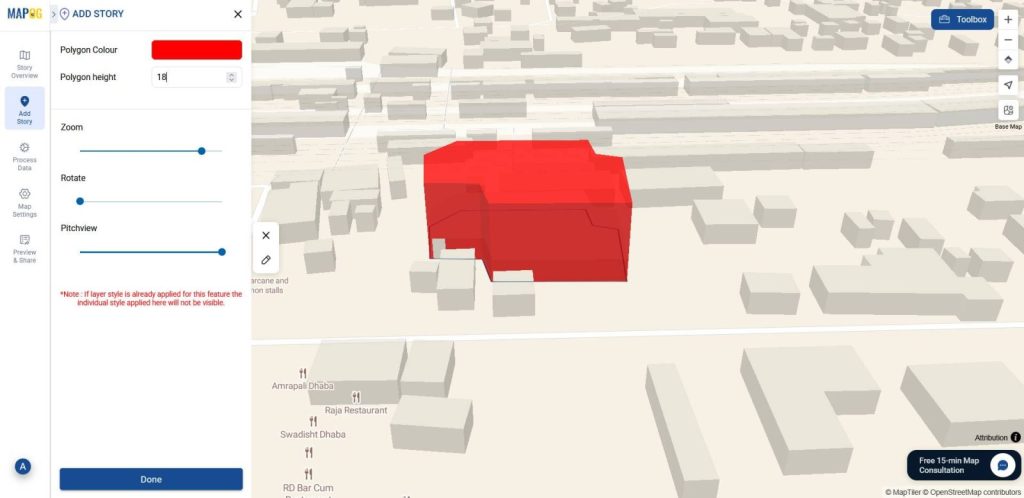
5. Style and Add Details
Then, click the pencil icon to open the styling panel. You can change the color, adjust the height, and rotate or zoom the view.
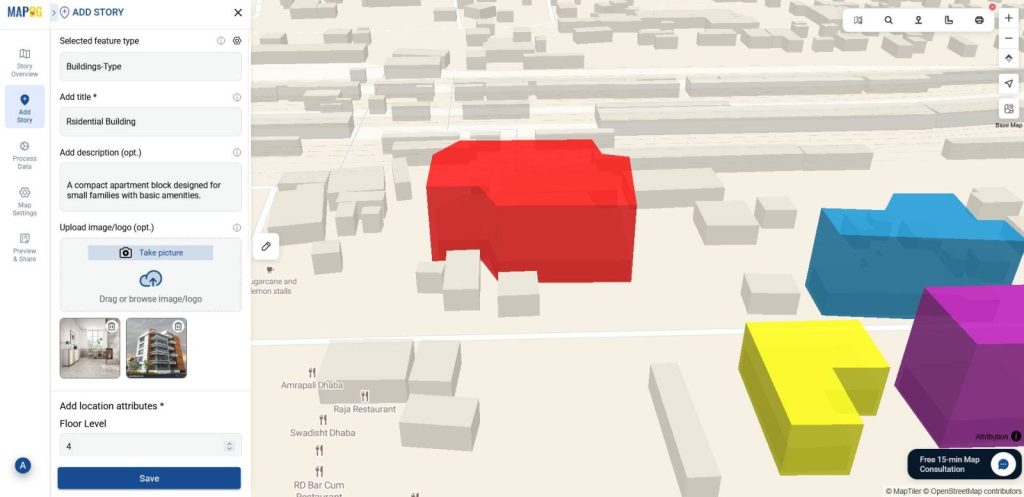
To define each polygon fill in the attributes and add images and then click save.
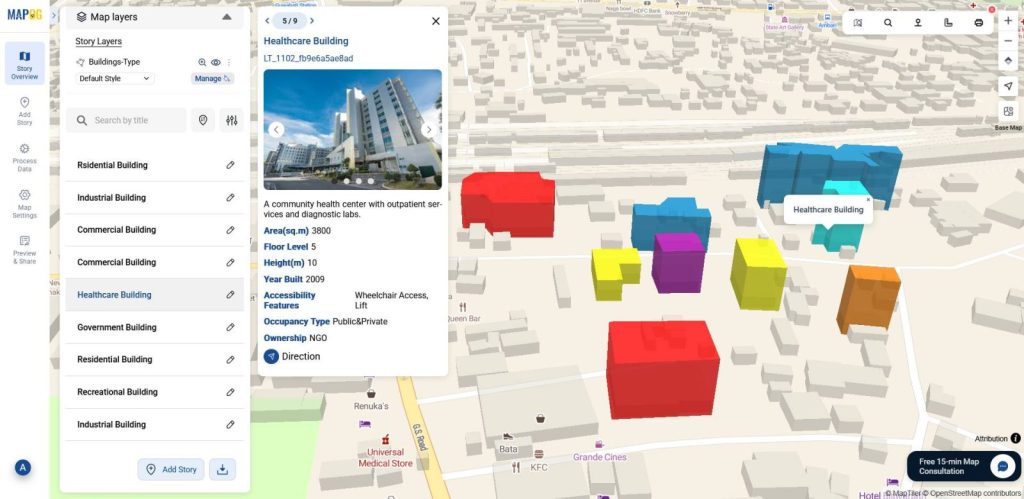
Finally, zoom out and take a look, your 3D building map is ready. From here, simply repeat the same steps to add more buildings: trace, style, fill in details, and save.
Industrial Use & Benefits
Teams can now create 3D building maps online without coding, that work across sectors ,from planning to education, with intuitive tools like MAPOG
In Urban planning it can help planners to visualize zoning and infrastructure more clearly. In contrast, disaster response teams can rely on them to assess structural vulnerability and simulate impact zones. Moreover, tourism projects can be benefited by showcasing hotels, landmarks, and local businesses with accurate spatial context. Also, educators and community leaders can also use 3D maps to make spatial concepts easier to teach and understand.
Conclusion
Overall, the shift to no-code 3D mapping has made spatial visualization accessible across sectors. As a result, planners, educators, and field teams can create clear, interactive maps without technical hurdles. With MAPOG, spatial storytelling becomes faster, more inclusive, and easier to share, whether for disaster resilience, urban planning, or public engagement.
Here are some other blogs you might be interested in: