Managing interior design projects often feels overwhelming, especially when updates are scattered across WhatsApp chats, shared drives, and endless spreadsheets. For years, spreadsheets seemed like the go-to option; however, they usually fail to provide clarity when teams need real-time visualisation across multiple sites. That’s exactly where interactive maps step in. With MAPOG, Interior design project management map can easily shift from static tracking to dynamic mapping. Instead of juggling files, they can now visualise, categorise, and share project updates in one place. Moreover, MAPOG’s “Add story” and “Category” options keep workflows not only organised but also collaborative, ensuring smoother communication between teams and clients.
Key Concept of On-Map Interior Designers Project Management
Interior design projects usually span several sites—residential apartments, commercial outlets, cafes, retail stores, and hospitality spaces. Although spreadsheets may show data, they rarely tell a story. A map, on the other hand, does both. It highlights location, status, and category at a glance. Therefore, MAPOG bridges this gap by letting users upload their existing data and instantly view every site on a live, interactive map.
Step-by-Step Process to Interior Designers Map Projects
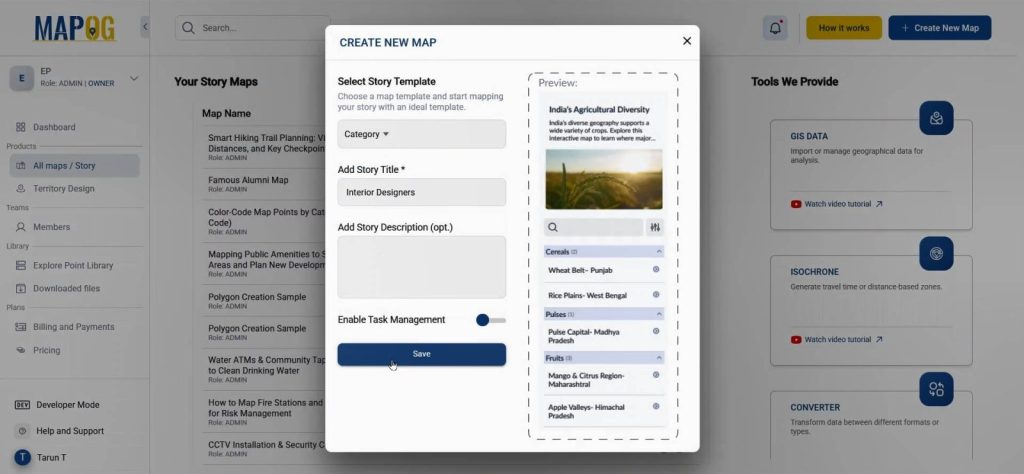
1. Creating the Map
Go to MAPOG and click on “Create new map.” Then, under the story template category, add a clear title and description. For an extra touch, you can even attach an image, which makes the project presentation more engaging. Once saved, the base setup is ready, and you can move forward without delays.
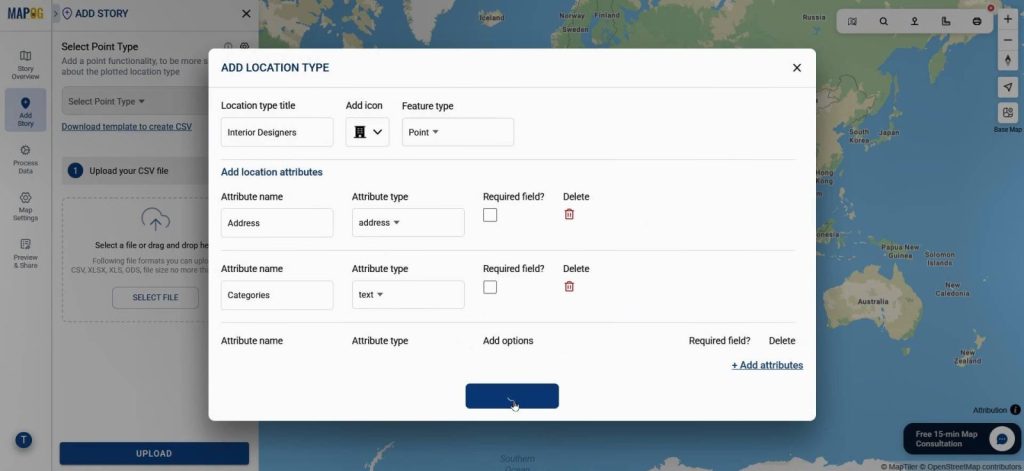
2. Adding Stories Through Data
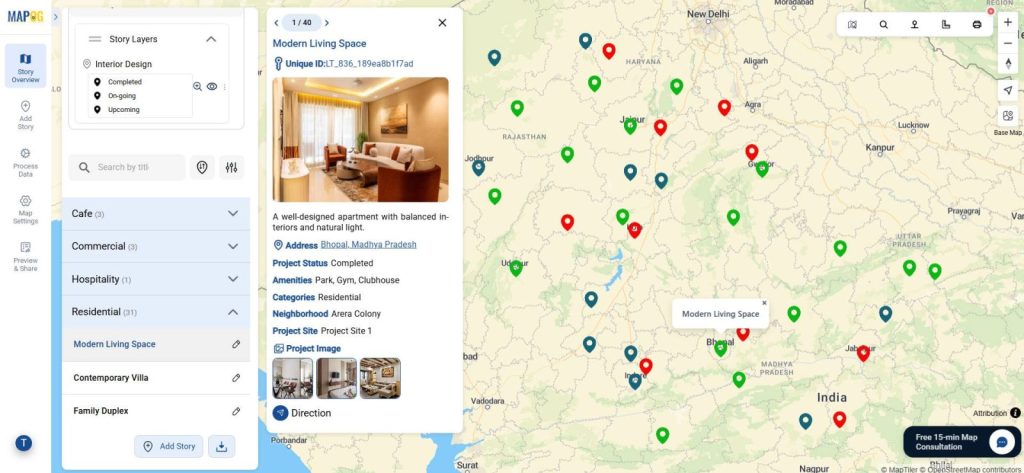
Afterward, the real magic begins. Go to the “Add story” option, where you can upload your prepared CSV or Excel file by choosing “Add by uploading CSV/Excel”. Next, select the point type and create a new attribute type named “Interior Designers” as a point feature. Under this feature, include attributes such as Project Site & Location, Project Status, and Category. Consequently, your entire workflow becomes visually structured, easy to track, and client-friendly.
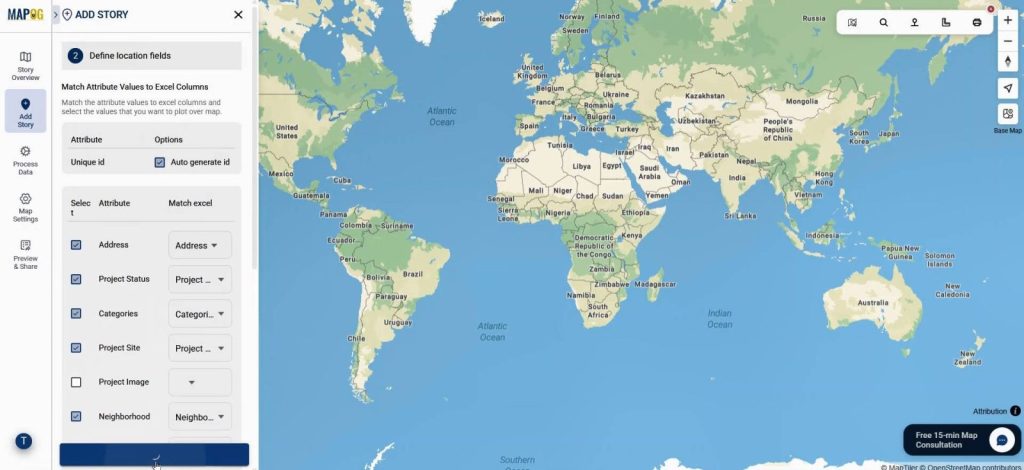
3: Matching Attributes and Geometry
After uploading, match the excel data with attributes. Designers select the latitude & longitude section, ensuring accurate plotting of each site. Once submitted, the map automatically generates points. This process transforms spreadsheet data into a clear geographical story of Interior Designers Projects, making progress instantly visible.
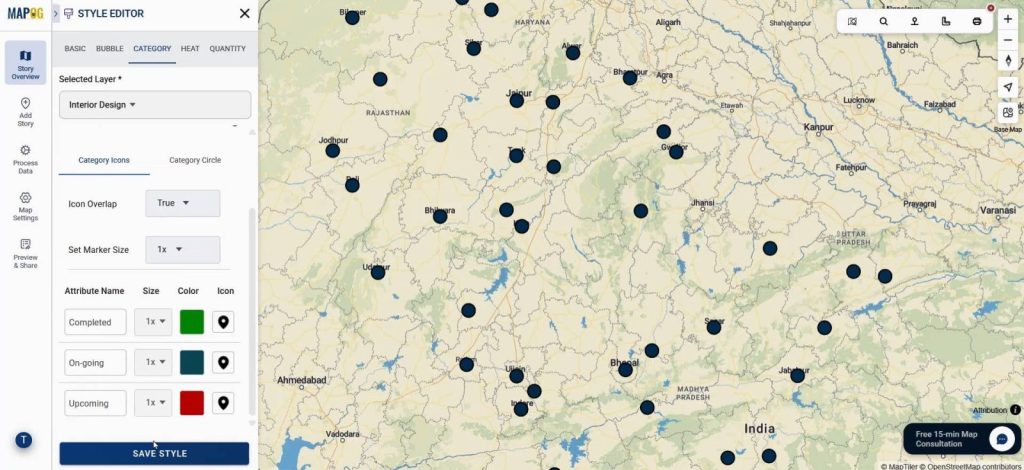
4. Categorizing the Projects
MAPOG’s “Category” feature allows users to classify projects. Go to point details of any point & select category settings option, from there points can be grouped under Residential, Commercial, Cafe, Retail, and Hospitality. By categorizing, Interior Designers Projects are easier to navigate, and teams can immediately distinguish ongoing work across industries.
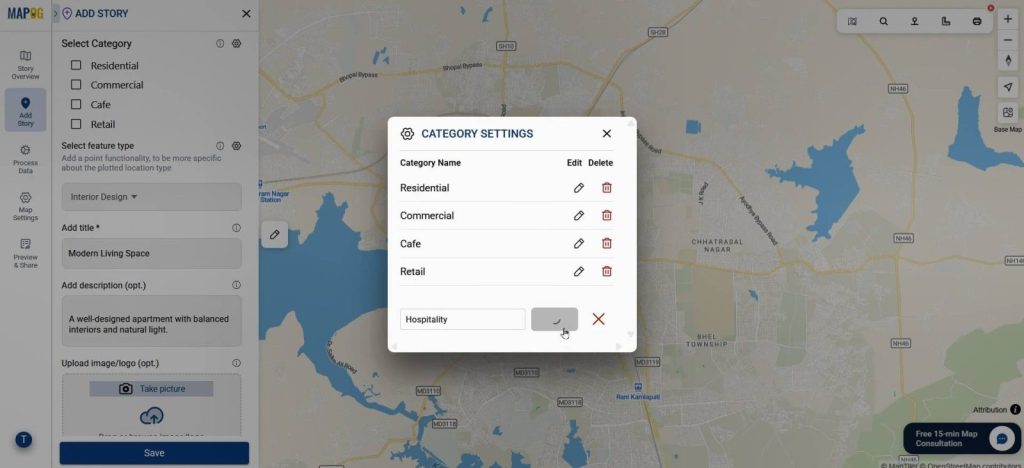
Lastly add images and other finishing touches & save the point.

5. Styling Points
The category style from style layer option makes the map more readable by adding colors to project sites. Such clarity is essential when showcasing Interior Designers Projects to stakeholders or coordinating with team members remotely.
6. Sharing for Collaboration
The final step is Preview and Share. Once complete, designers can preview the map and choose the “public” option for sharing. The generated link can be shared with clients, contractors, or team members, replacing dozens of scattered files.

Industry Impact and Benefits
By moving Interior Designers Projects from spreadsheets to interactive maps, designers gain more than just organization. They achieve transparency, stronger client engagement, and faster decision-making. For instance, a cafe project still in concept can be shown alongside a nearly complete residential apartment, making progress visually obvious. Clients appreciate seeing updates mapped out, while teams enjoy reduced confusion and improved task alignment.
Conclusion
Consequently, the shift from spreadsheets to on-map visualization completely redefines how Interior Designers Projects are managed. In addition, by using MAPOG’s “Add story” and “Category” options, designers instantly transform static data into living stories. Thus, this approach saves time, and moreover, it organizes data visually. Finally, it makes collaboration seamless, and in turn, it drives efficiency across every project stage.