In today’s data-driven world, GIS Mapping Optimizes Public Service Delivery by transforming how cities manage essential services. MAPOG help planners visualize, analyze, and optimize infrastructure such as waste management, healthcare, and safety. With targeted layers like Public Health Maps and tools to Map EV Charging Stations, cities address both core needs and sustainability goals. As a result, Municipal GIS Mapping not only enables smarter decisions but also helps reduce service gaps and, moreover, significantly boosts overall efficiency.
Key Concept: GIS Mapping Public Service
GIS (Geographic Information Systems) is more than a mapping tool—it merges spatial data with analytics, allowing decision-makers to visualize service coverage and access patterns. Planners can overlay layers to better assess community needs. This approach aids public utilities and tasks like optimizing bank branch locations, ensuring services reach both urban and rural areas while helping identify gaps and build inclusive cities.
Step-by-Step Guide to Creating GIS Mapping Public Service
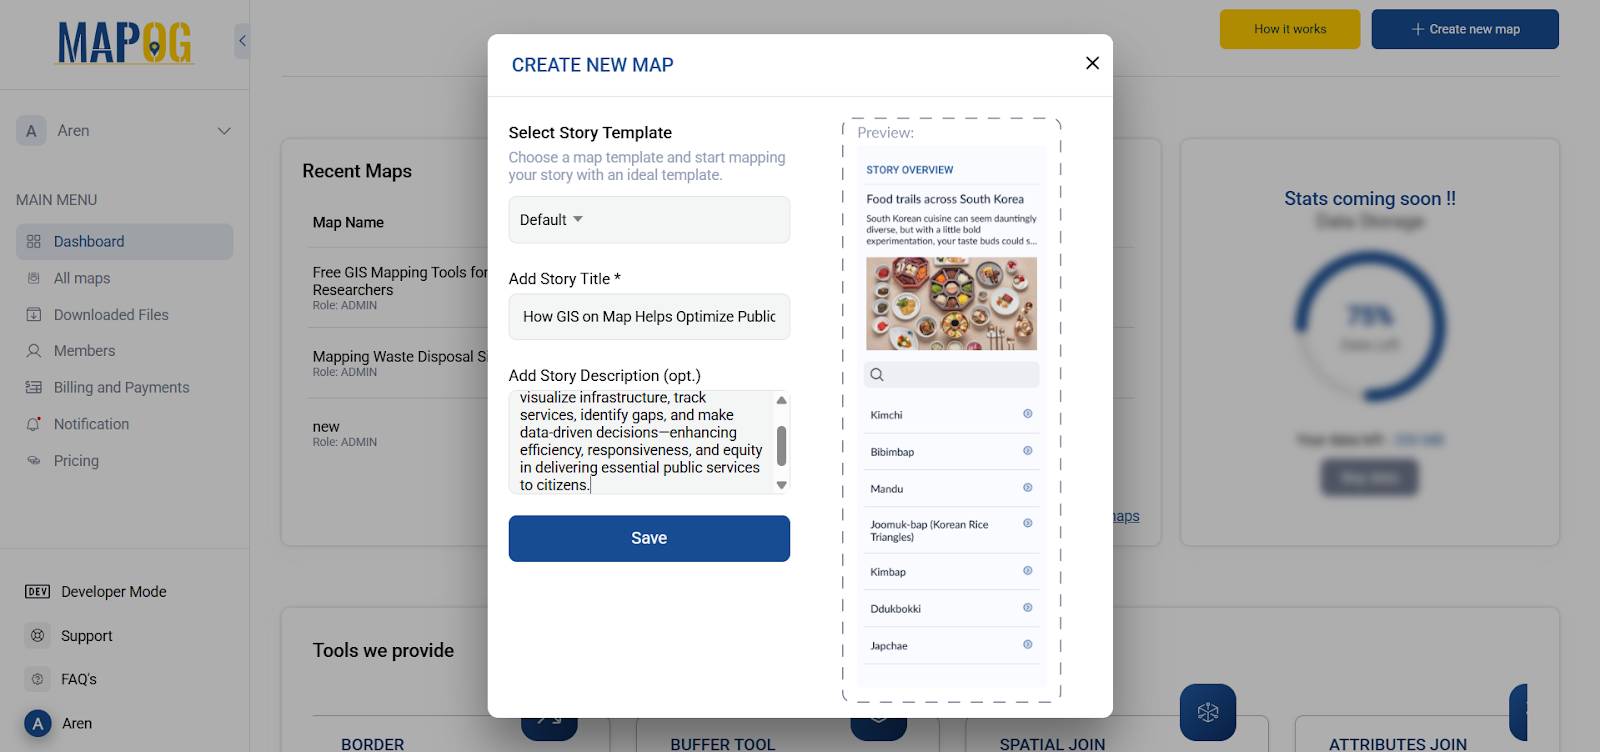
1. Start with a Purposeful Story Map
To begin with, head over to MAPOG, log in, and click on “Create New.” Subsequently, add a clear and concise title and description outlining your theme—public service delivery optimization using GIS tools.
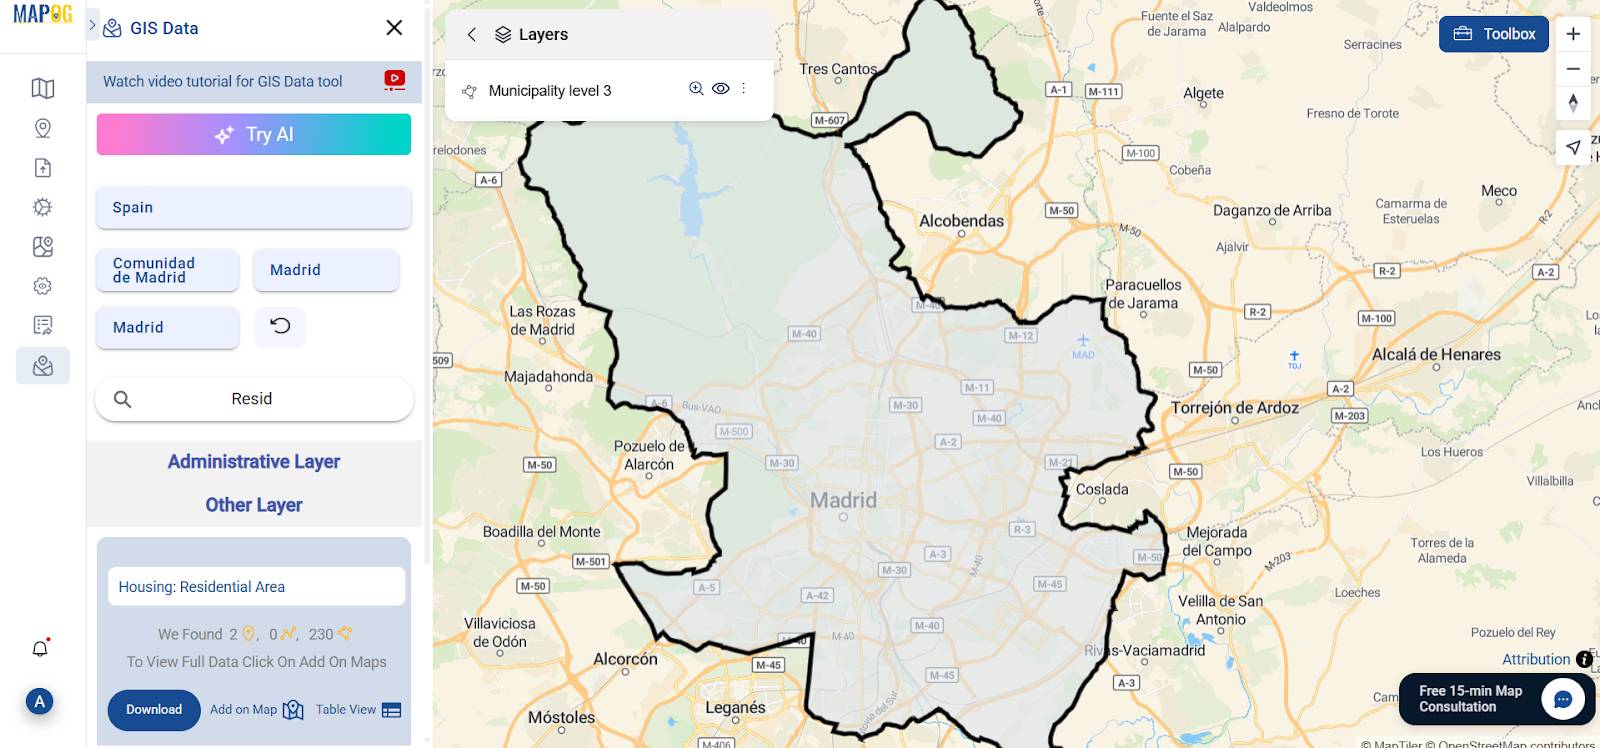
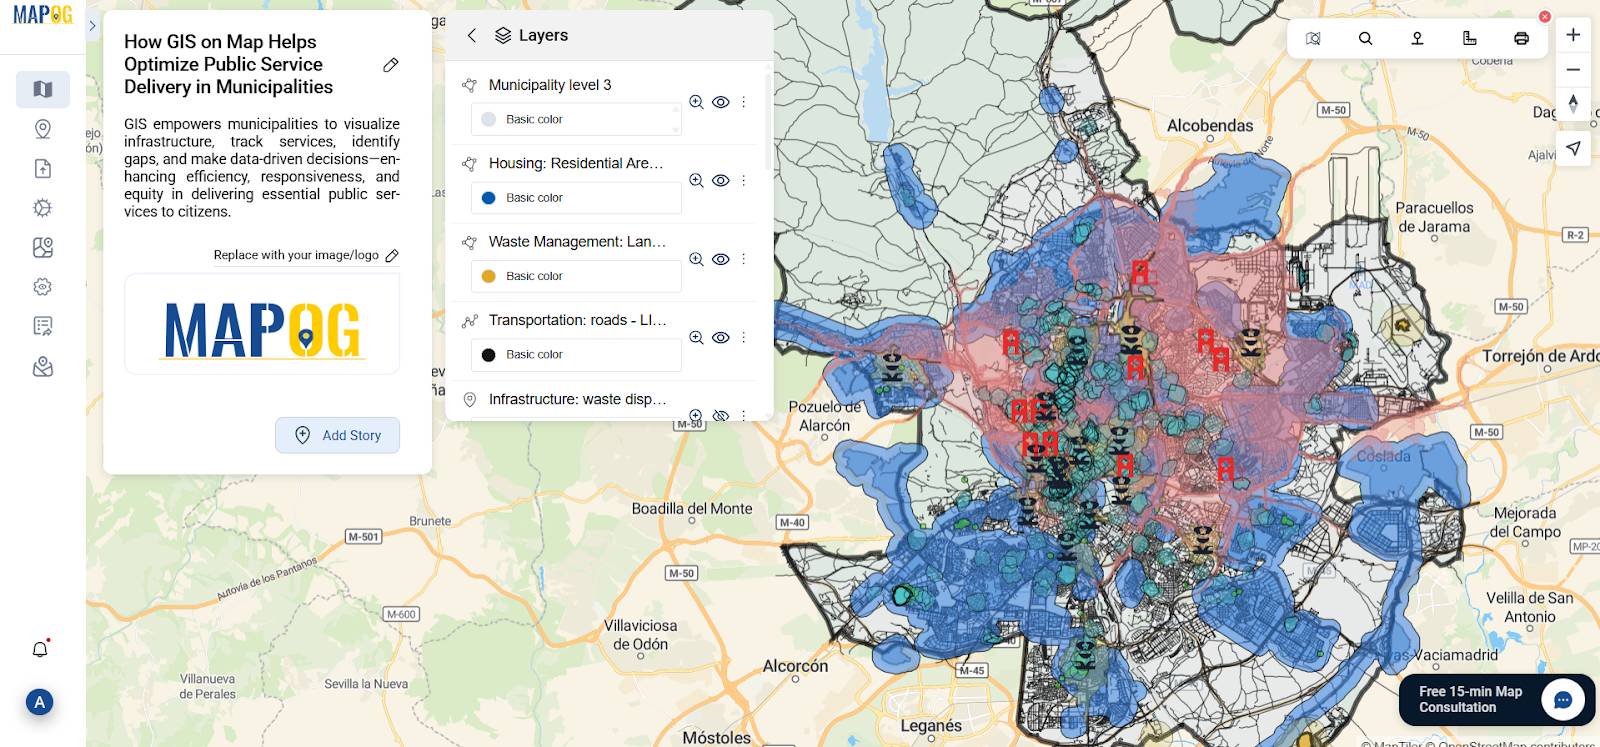
2. Upload Your GIS Layers
Next, using GIS data, upload your spatial layers.
- Your study area
- Residential zones
- Public services like hospitals, ATMs, and waste management facilities
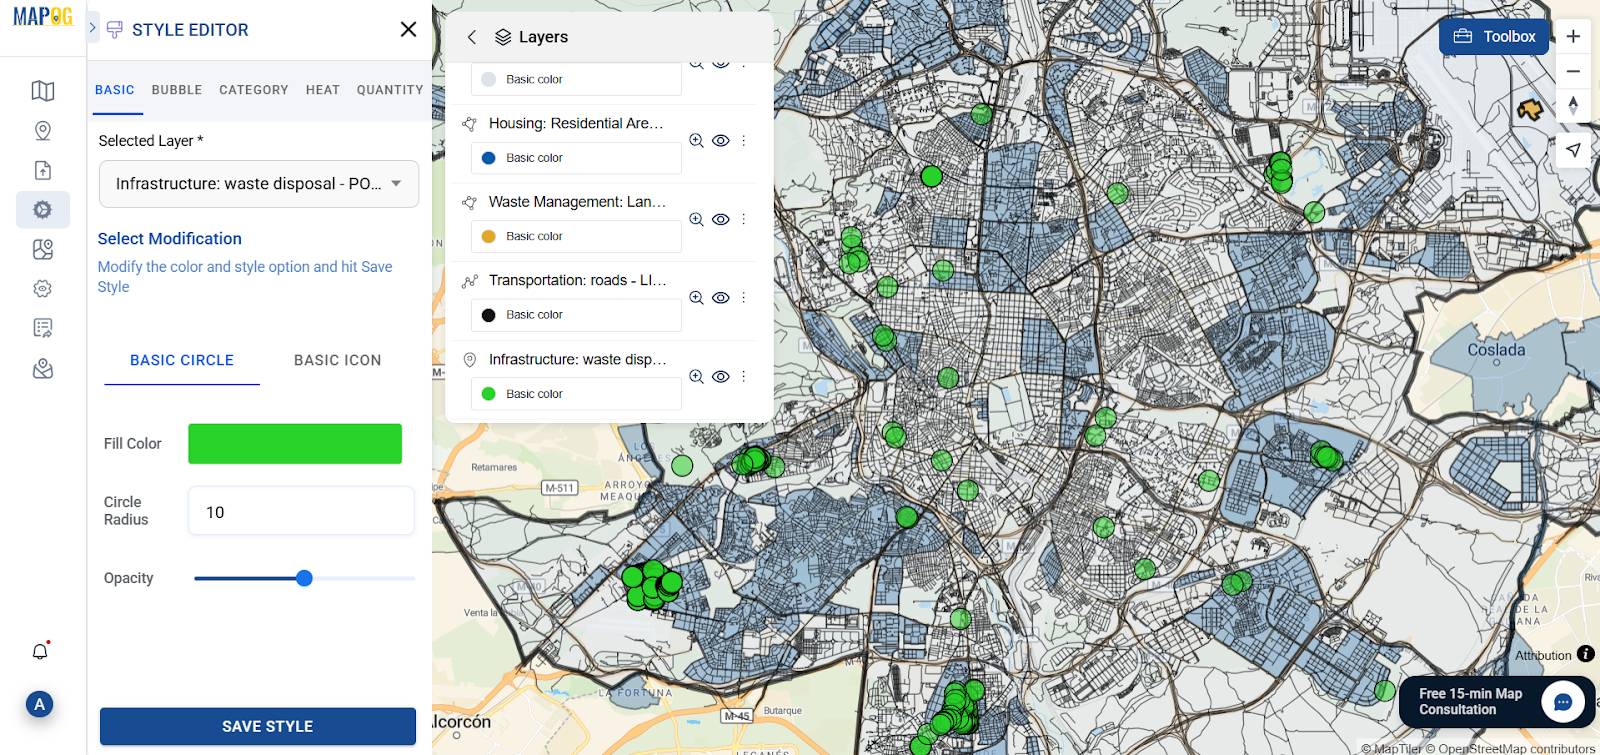
3. Style the Data for Visual Clarity
Using MAPOG’s style editor, enhance your map by adjusting colors, icons, and opacity settings. A well-styled map not only looks appealing but also improves interpretability for stakeholders and the public.
4. Use the Buffer Tool for Proximity Analysis
Next, navigate to the “Process Data” tab and then select the Buffer Tool. After that, choose the residential area polygon, set the range to 500, and finally click on “Submit.
- Waste bins – 150 meters
- Landfill sites – 600 meters
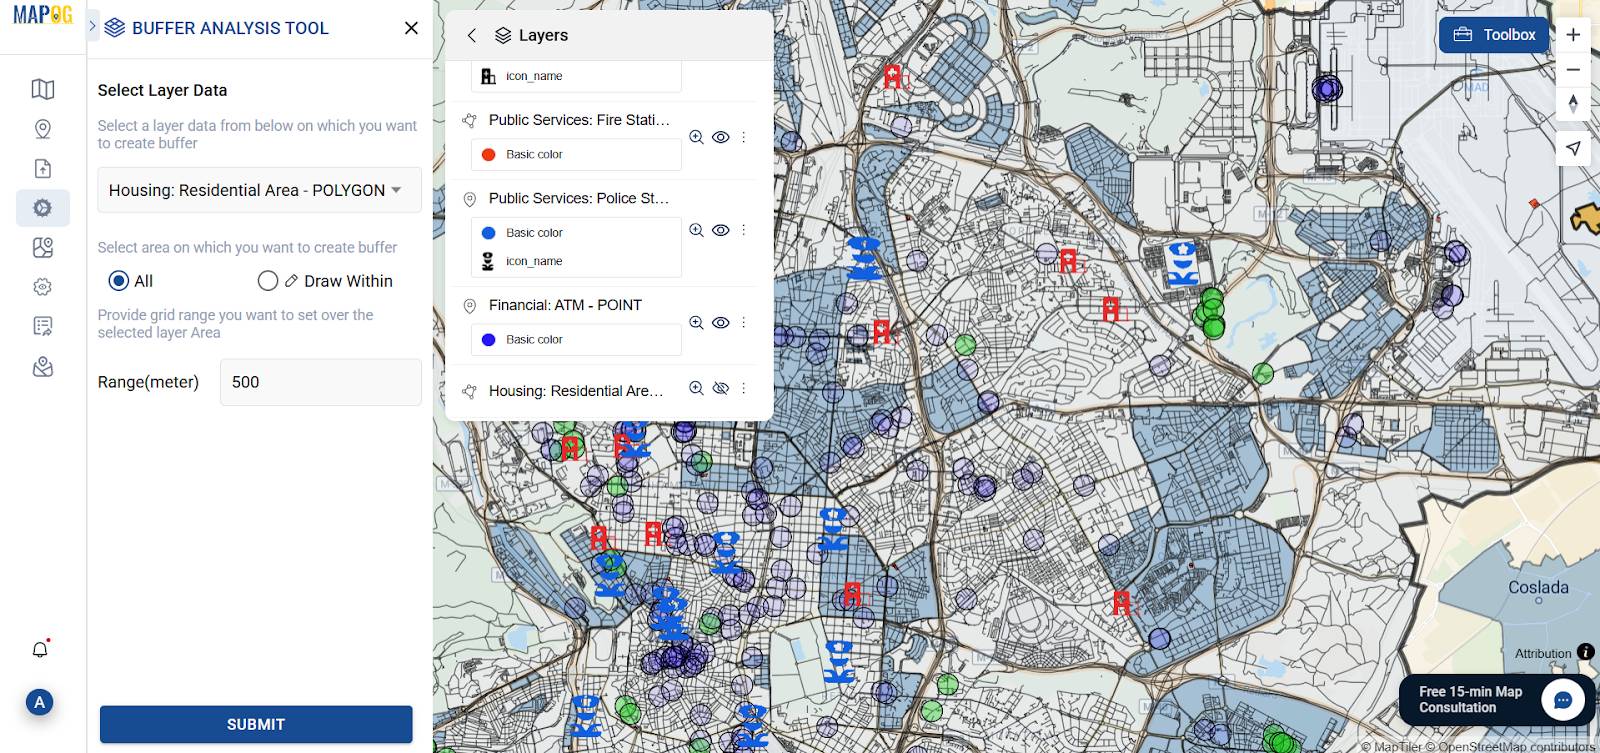
Buffers map ideal urban service reach. As a result, they help you understand service coverage and, furthermore, identify underserved areas.
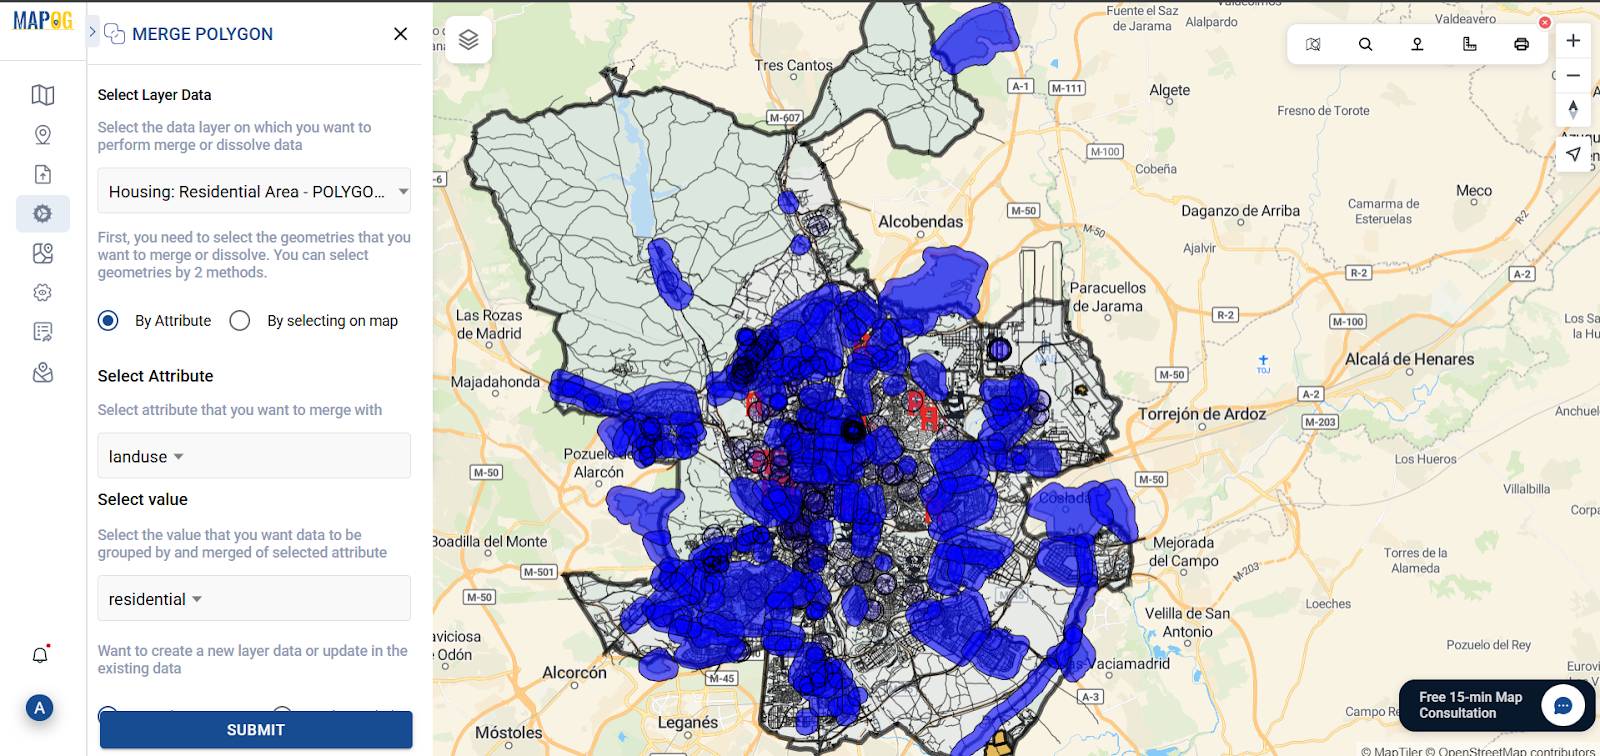
5. Merge Buffers for a Clean View
To improve map readability and, moreover, remove overlapping zones, apply the Merge polygon. Then, input the residential buffer and, subsequently, merge by attributes. Finally, save it as a new layer. Also do the same for waste bins & landfill site’s.
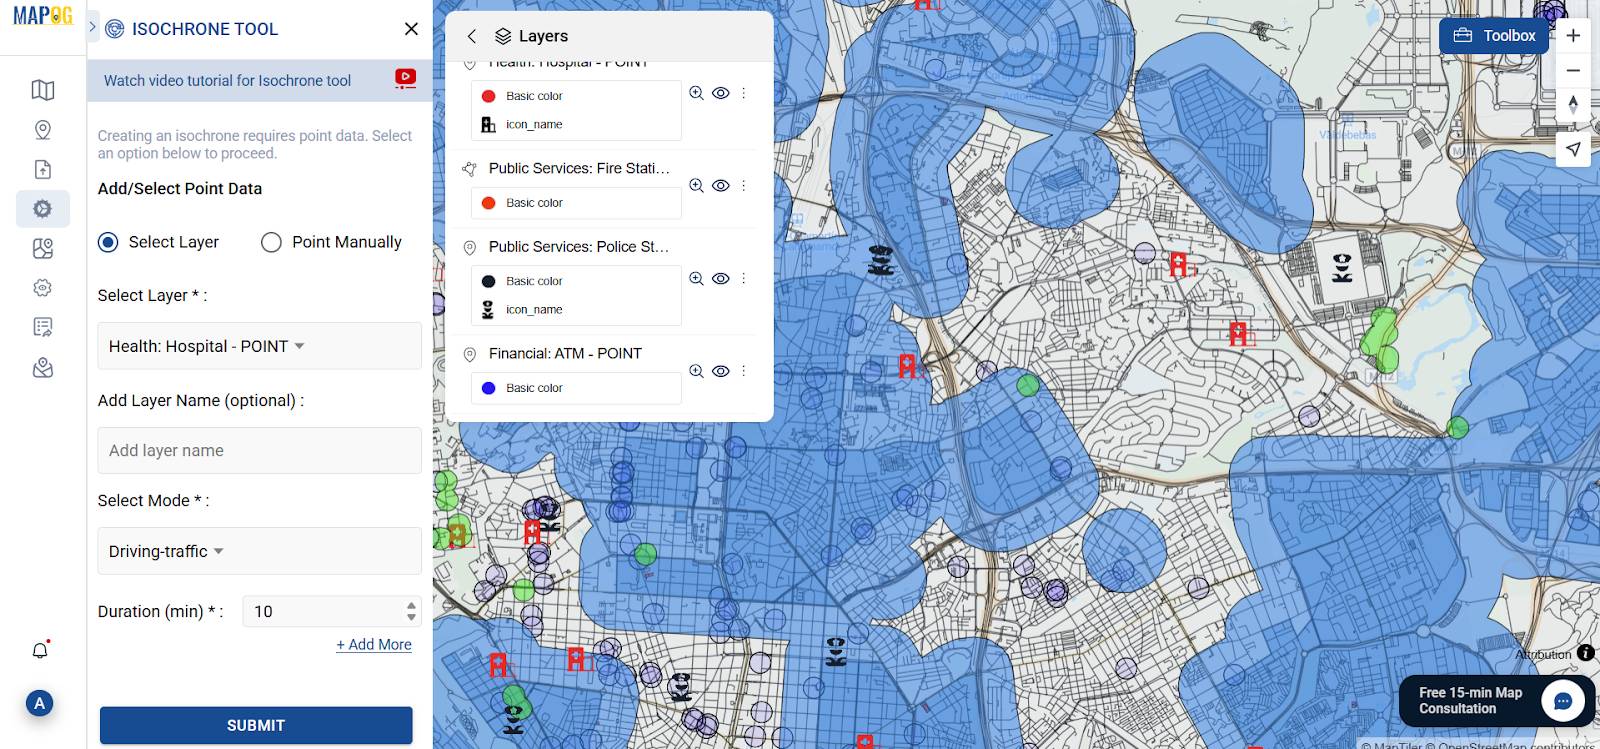
6. Apply Isochron for Access-Based Delivery
Next, under the same Process Data section, select the Isochron Tool ,then select the Hospital layer , choose mode driving and duration 10 mins. This tool calculates service accessibility based on actual travel time rather than distance also do for :
- Police stations – 5-minute drive
- ATMs – 5-minute walk
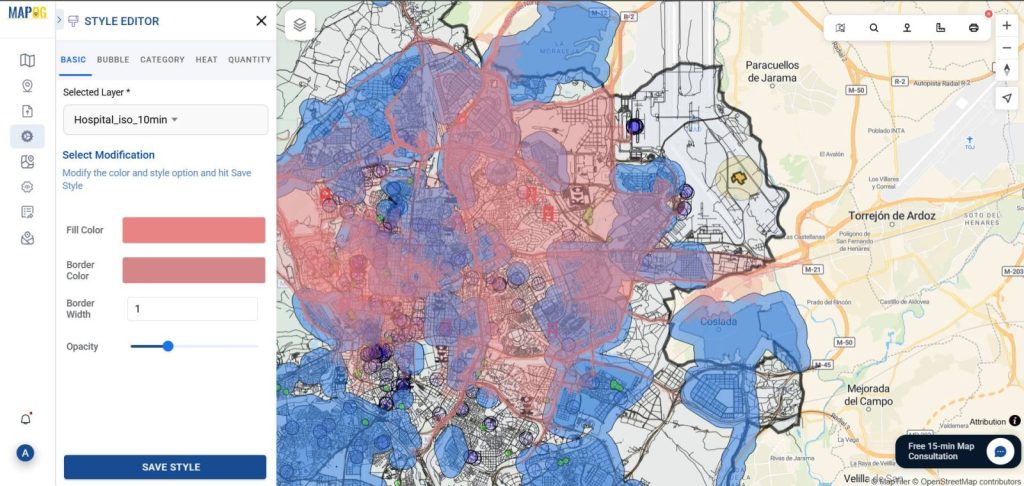
Finally, enhance the visual clarity of your isochrone layers by customizing their style—adjust opacity and apply appropriate color schemes for improved map interpretation.
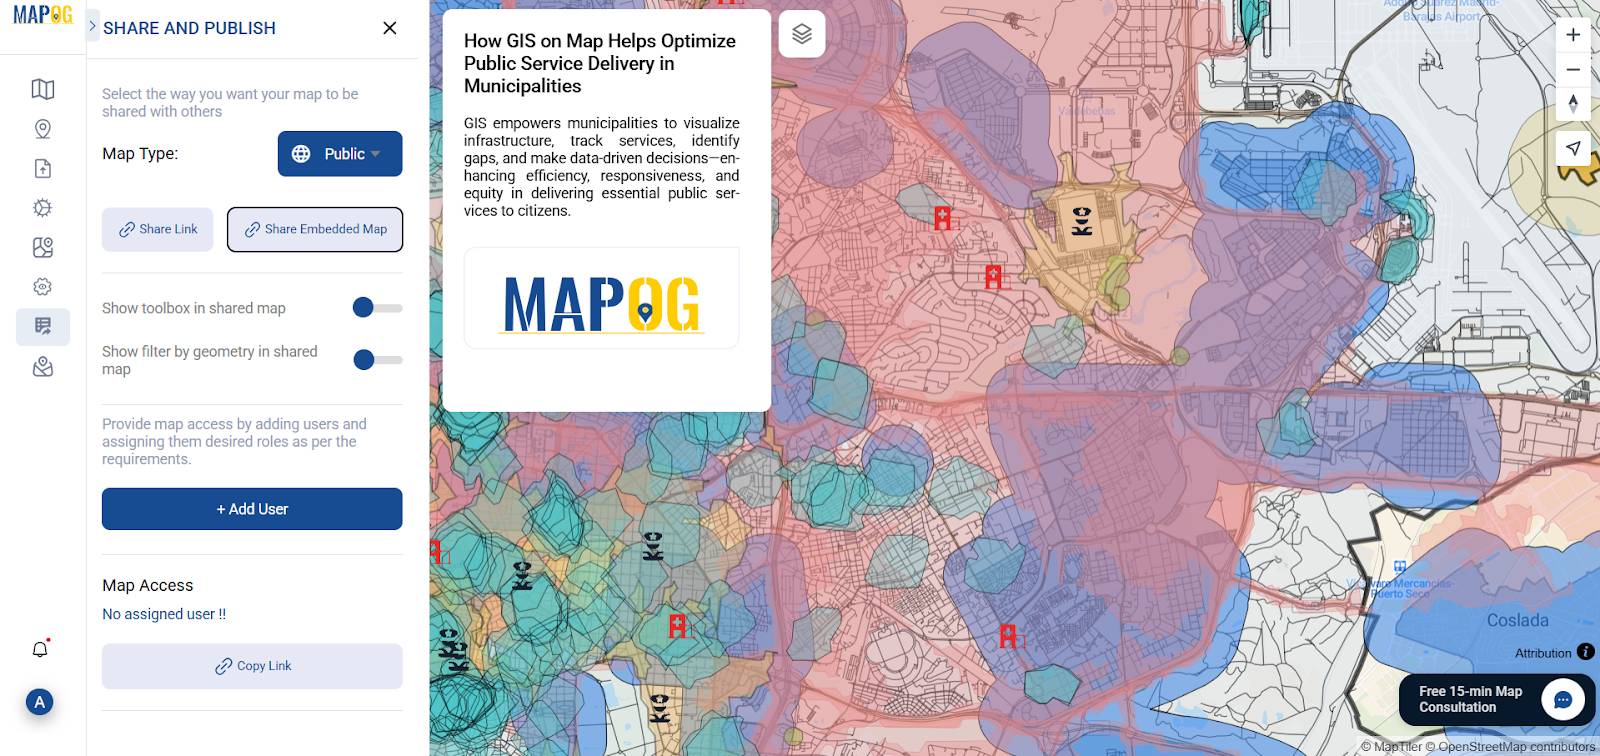
7. Share and Publish
After finalizing your map, click on “Share & Preview.” You can either copy the link for distribution or embed the map directly into websites or digital reports.
How GIS Helps Optimize Public Services
In essence, GIS transforms how municipalities plan and, furthermore, deliver services. Through the approach of GIS Mapping Optimizes Public Service Delivery, local governments, as a result, gain:
- Accurate visibility of underserved zones
- Data-backed service planning
- Efficient allocation of resources
- Response analysis during emergencies
GIS allows for proactive service design rather than reactive crisis management. MAPOG puts spatial analysis at the heart of smart city planning.
Sectors Benefiting from GIS Mapping
Meanwhile, various industries and departments are increasingly leveraging GIS; in doing so, they streamline service delivery across multiple sectors and, as a result, boost operational efficiency.
- Urban Development Authorities
- Solid Waste Management Boards
- Health and Disaster Response Units
- Transport and Mobility Planners
- Citizen Engagement Platforms
GIS Data Used
Conclusion
As cities grow more complex, integrating spatial intelligence into public service systems becomes not just helpful—but essential. With MAPOG, municipalities can use data to ensure all citizens access vital services. Moreover, from buffers to isochrones, GIS-based planning continues to serve as the backbone of smarter and, consequently, more responsive cities.
Explore more insightful blogs you might find useful:
Clean Cities in India: Mapping with a GIS Perspective
Mapping Noise Pollution Levels: Using Heat Maps and Buffer Tools