Ensuring the emergency services Near Education become more critical than ever safety of students in educational institutions is a high priority in urban and regional planning. As cities expand rapidly and population density increases.
This article explains how Geographic Information Systems (GIS) can be effectively used to map emergency services near educational institutions. For this purpose, we used MAPOG, a powerful web-based mapping tool that helps visualize, analyze, and interpret spatial data with accuracy and ease.
Key GIS Concepts for Mapping Emergency Services Near Education
GIS integrates both spatial and attribute data to help evaluate accessibility and proximity. In this mapping exercise, two essential service layers—fire stations and hospitals—were analyzed in relation to educational institutions. Specifically, the Nearest Neighbor Tool was used, as it calculates the shortest distance between features across layers. Consequently, this allows for the identification of service coverage gaps, which is crucial for urban planning, emergency preparedness, and public safety management.
Methodology: Step-by-Step GIS Methodology to Map Emergency Services Near Education
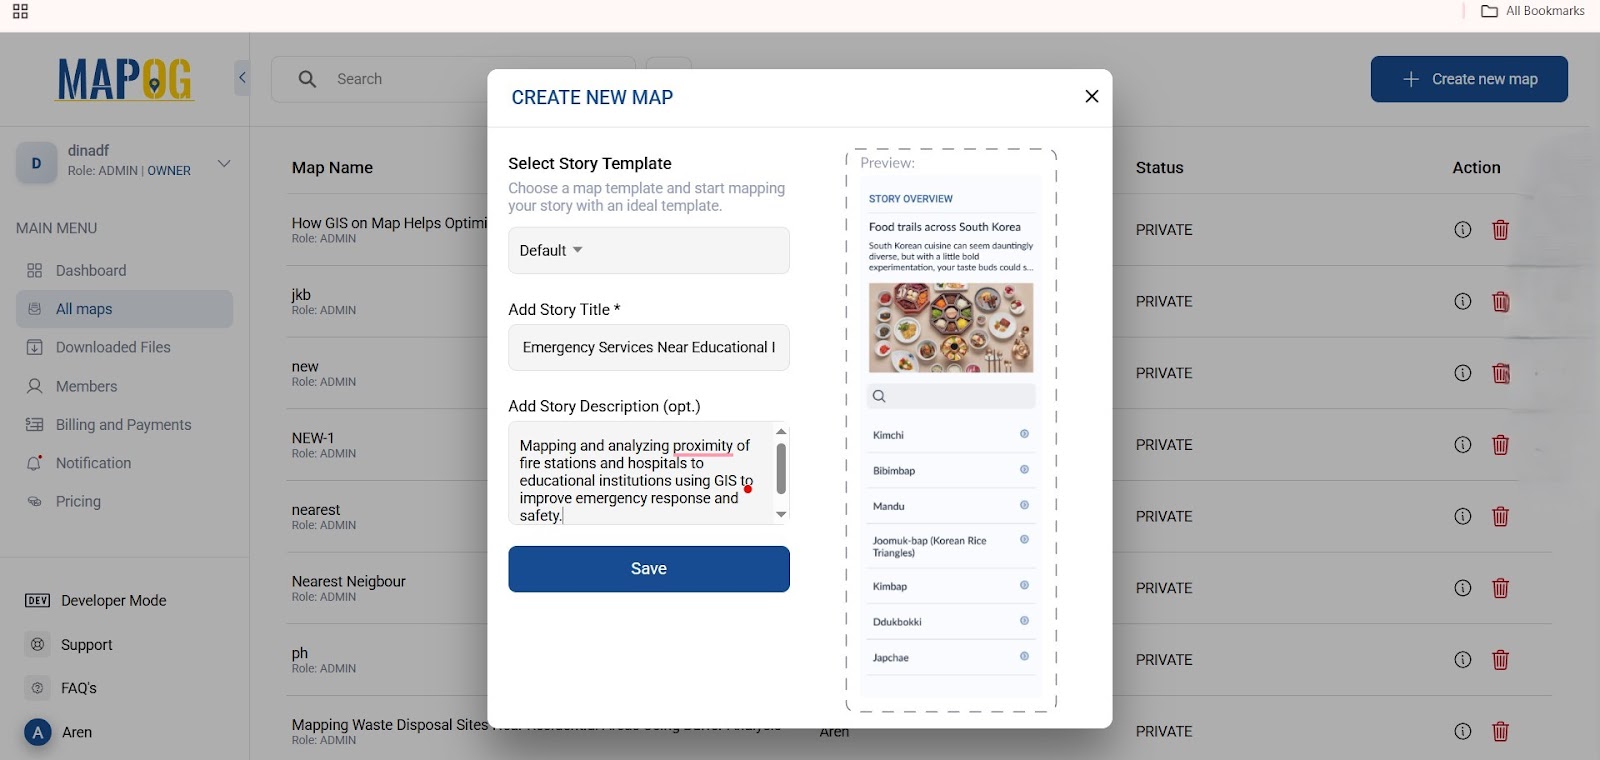
Step 1: Login and Setup on MapOG
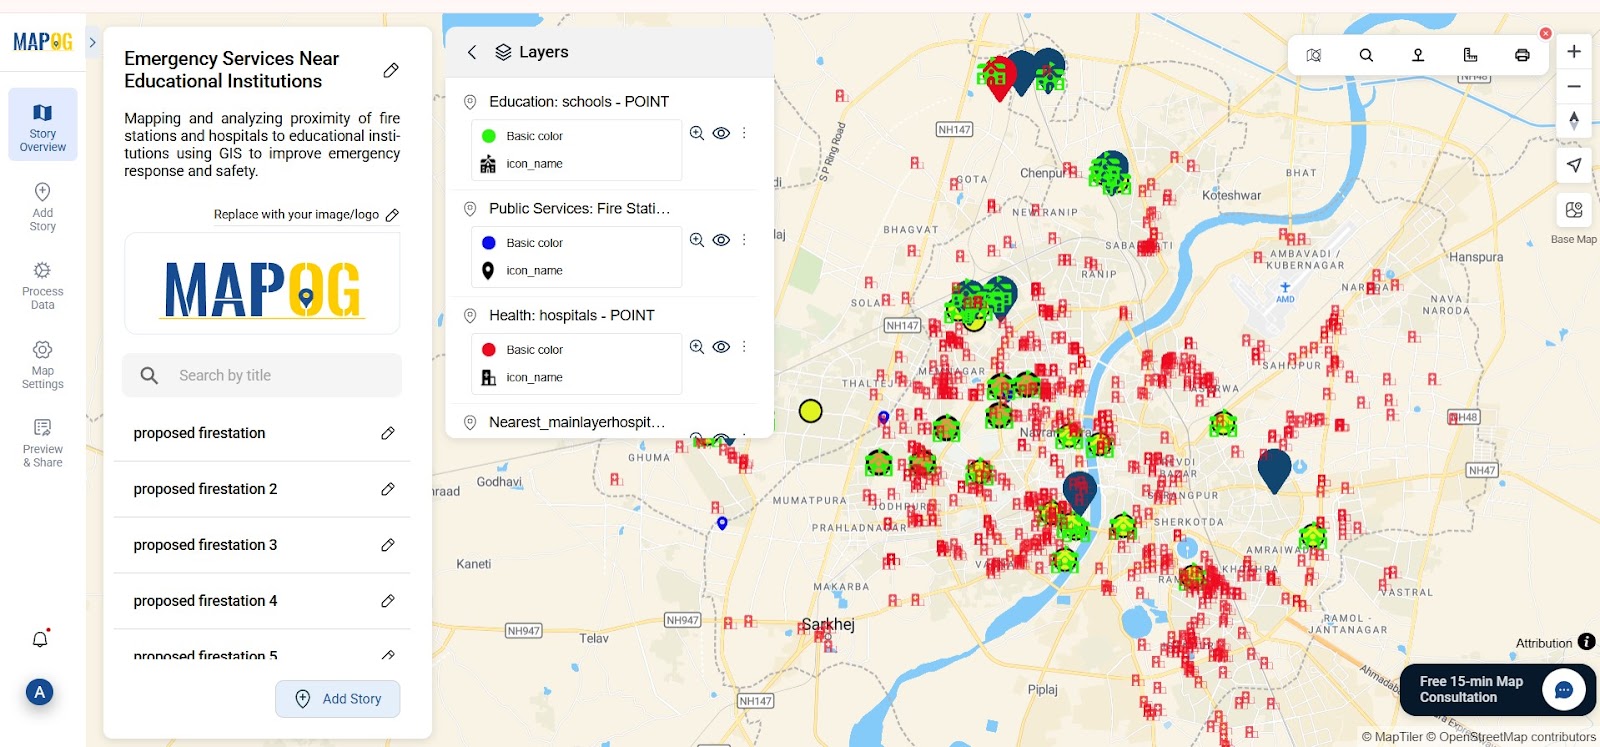
Begin by logging into your MAPOG account. After logging in, click on “Add Title” and provide a suitable name for your project, such as “Emergency Services Near Educational Institutions.” Then, write a brief description outlining your objective.
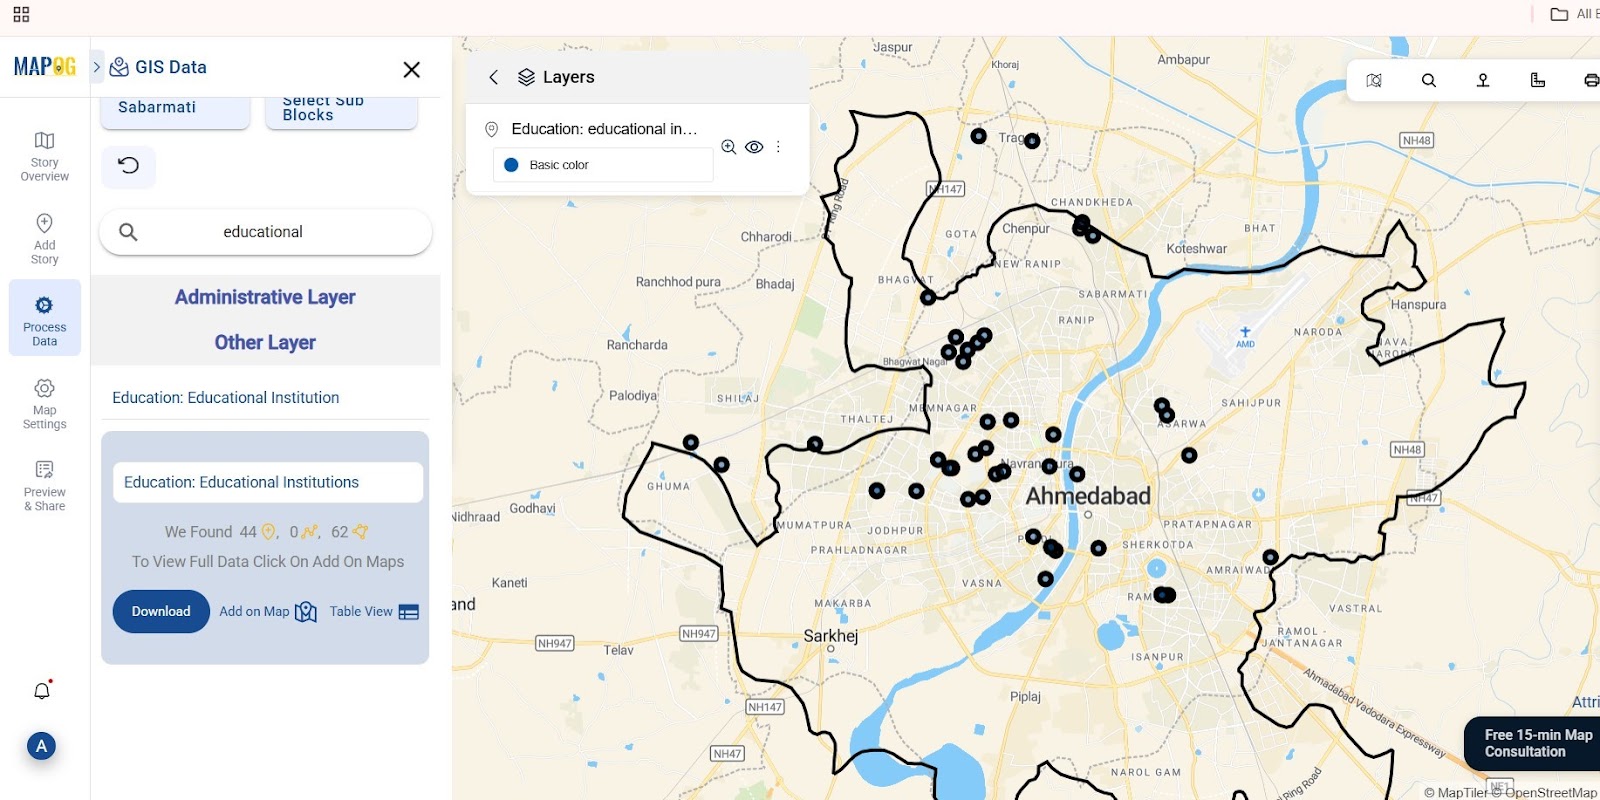
Step 2: Selecting Study Area & Importing Educational and Service Layers
Begin by navigating to the “Process Data” section and selecting your country under GIS Data. Then, refine your area of interest down to the block level to maintain a focused and detailed study region. After selecting the area, add your first data layer—educational institutions—which will serve as the main layer for analysis. Next, add two joining layers: one for fire stations and another for hospitals.
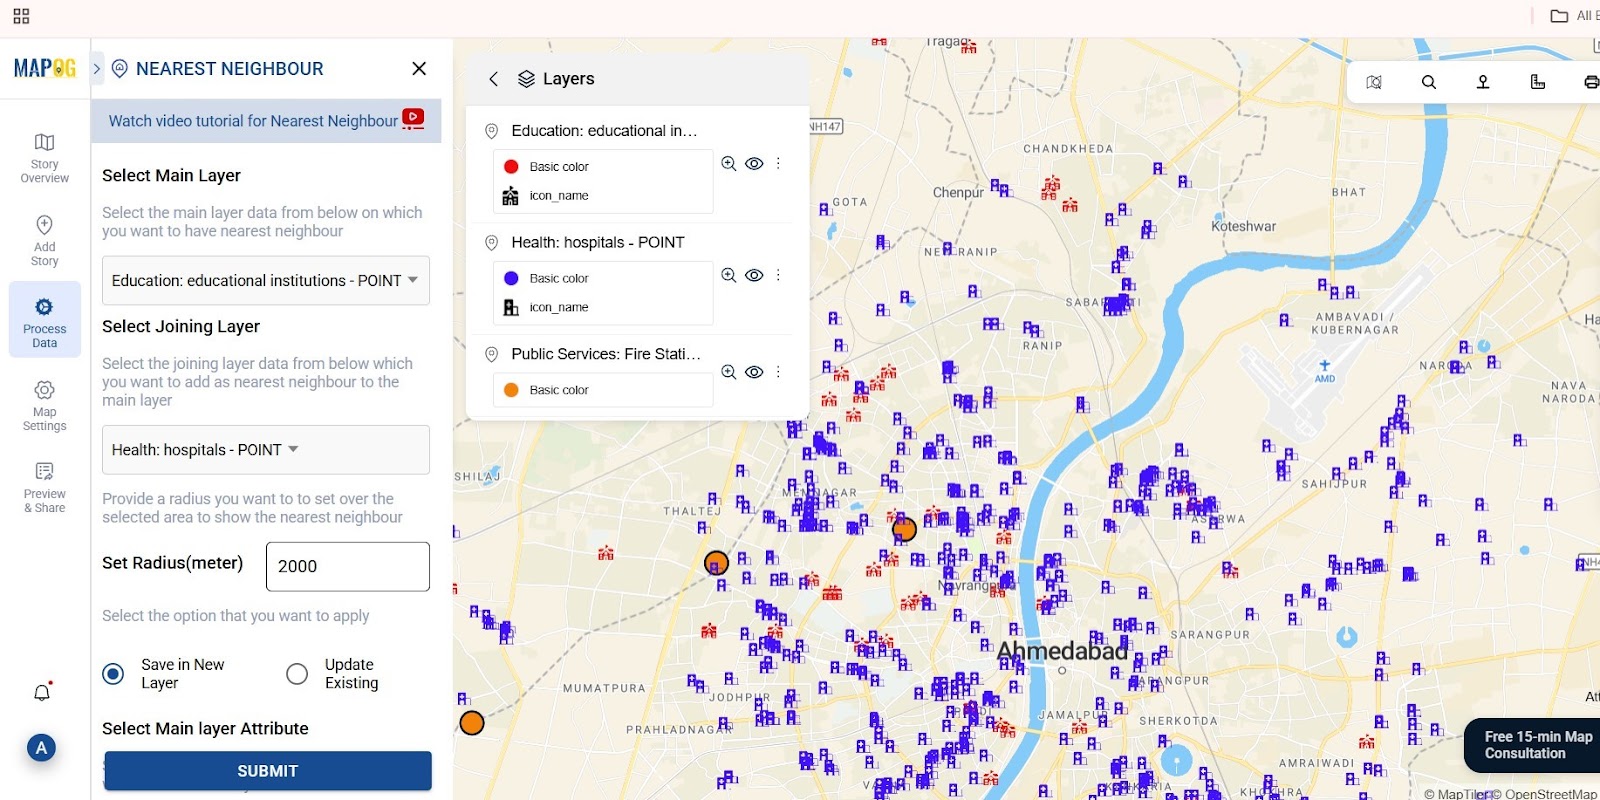
Step 3: Analyzing Proximity of Emergency Services Using Nearest Neighbour Tool
Return to the Process Data tab and open the Nearest Neighbor Tool. Choose educational institutions as the main layer and fire stations or hospitals as the joining layer. Set a 2 km search radius and generate an output layer. Select key attributes like name, type, and location, then repeat for the second service layer.
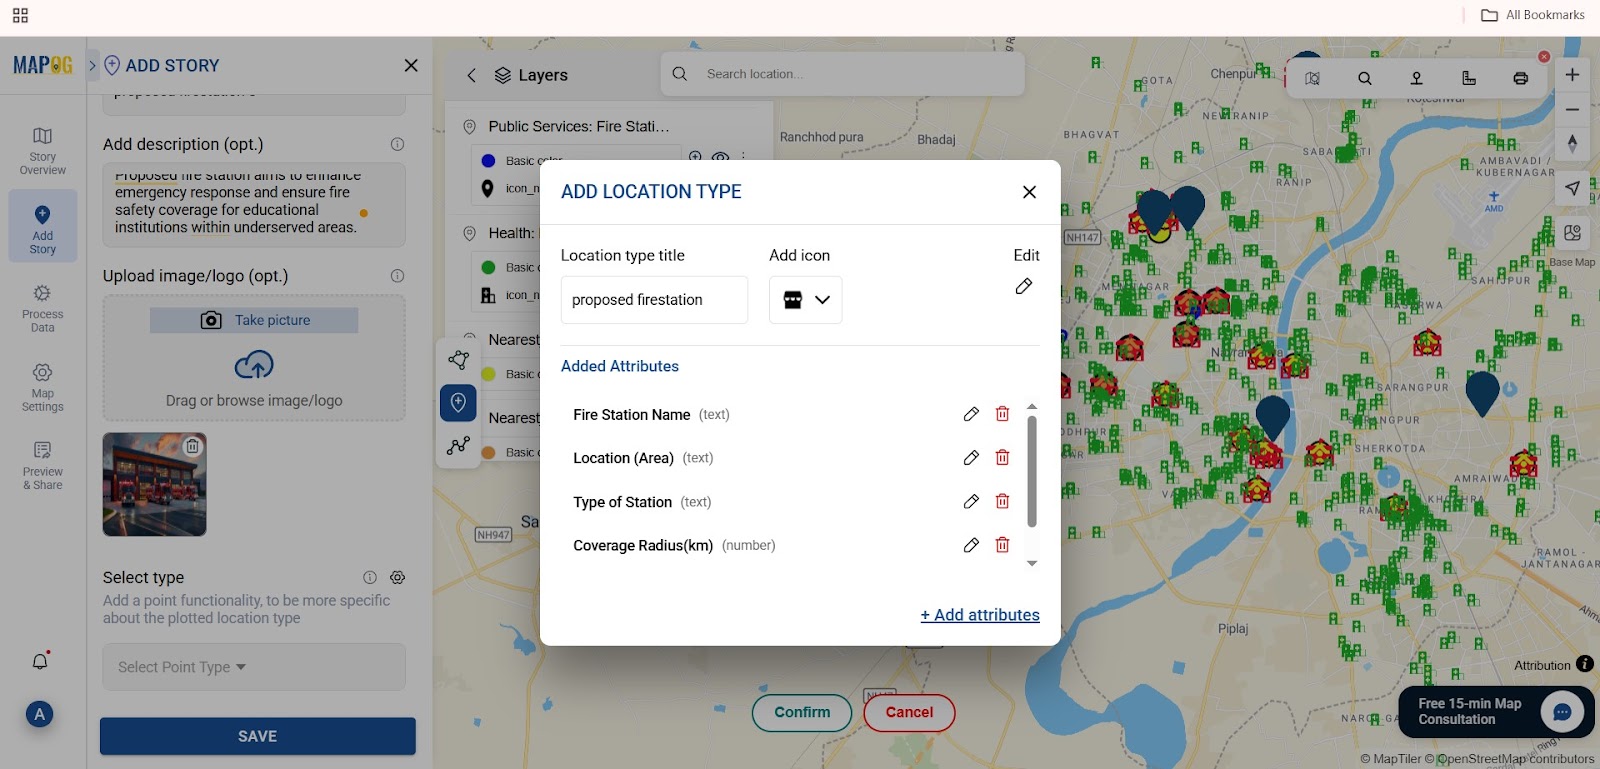
Step 4: Identifying Gaps in Emergency Service Coverage Near Schools
Go to Add Story, manually add proposed service points with a title, description, and image. In “Select Type” Settings, create a new type like “proposed hospital” or “proposed fire station.” Then, define attributes such as name, type, capacity, and service details.
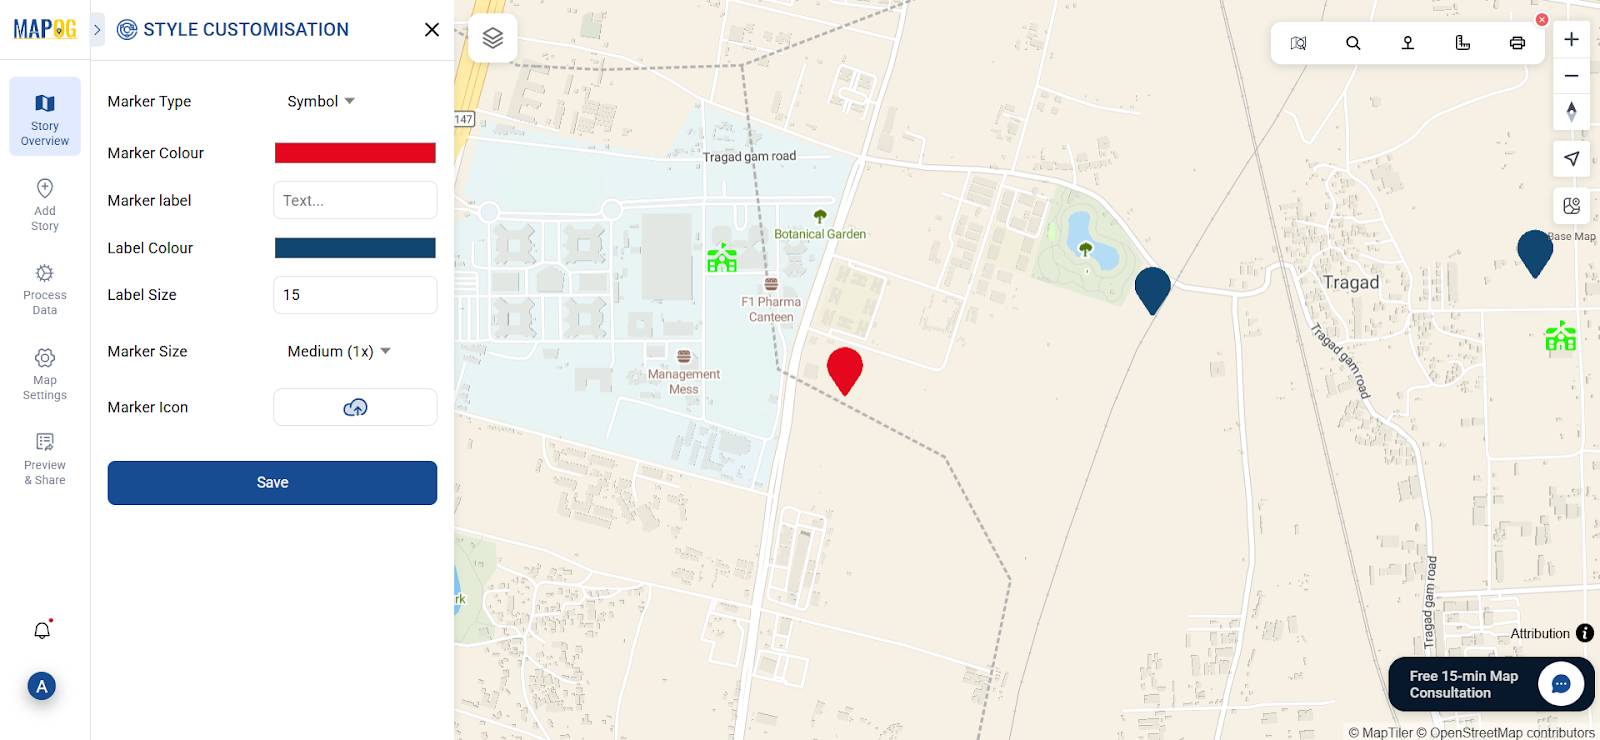
Step 5: Customizing and Differentiating Points
After adding the proposed fire stations and hospitals using the Add Story feature, go to the style editor to customize each point.
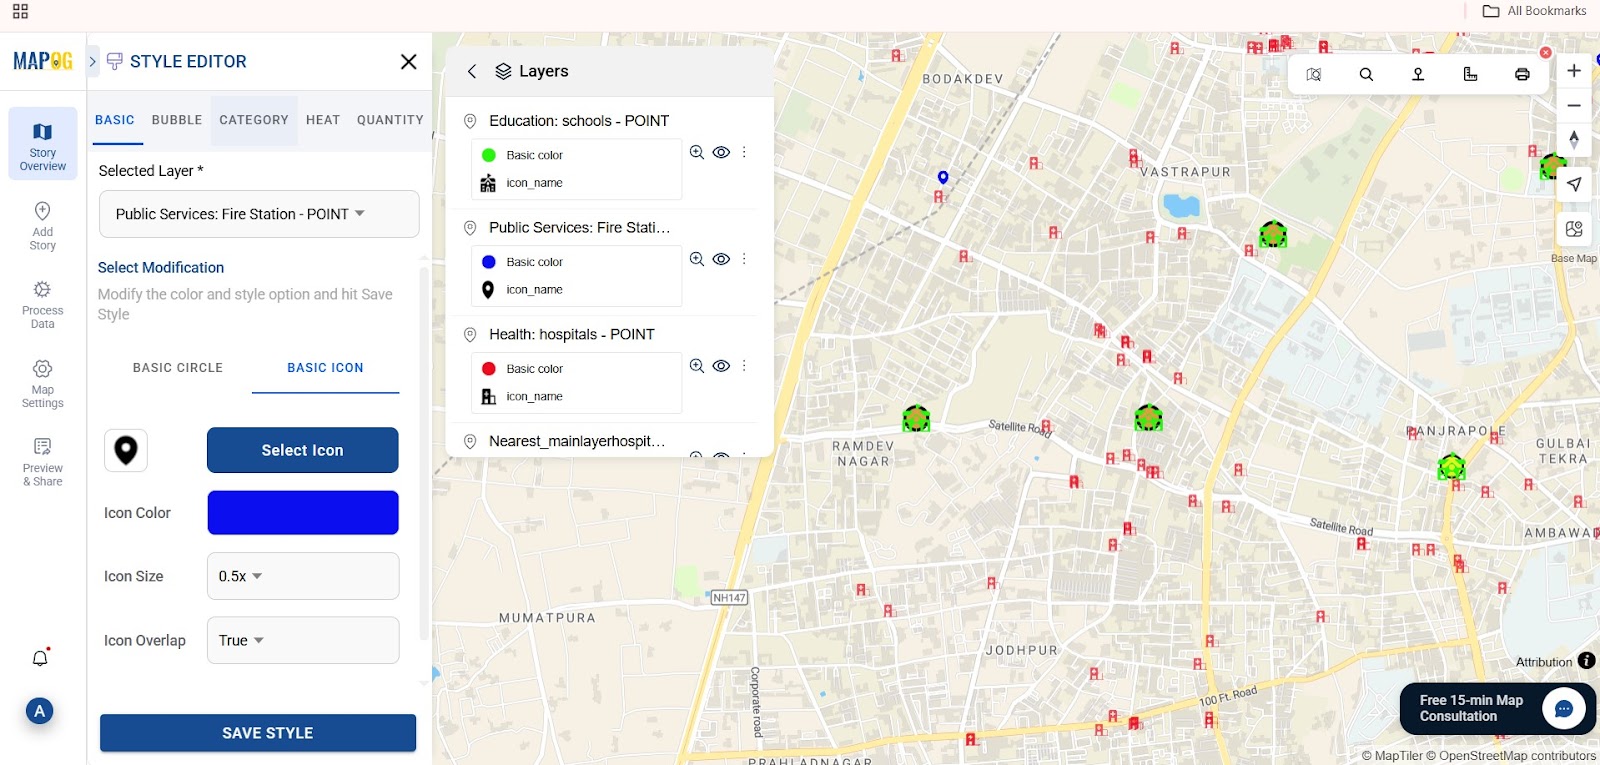
Then, also customize the proposed points added via Add Story by going to point customization and choose unique colors, icons, and labels to distinguish between fire stations and hospitals visually.
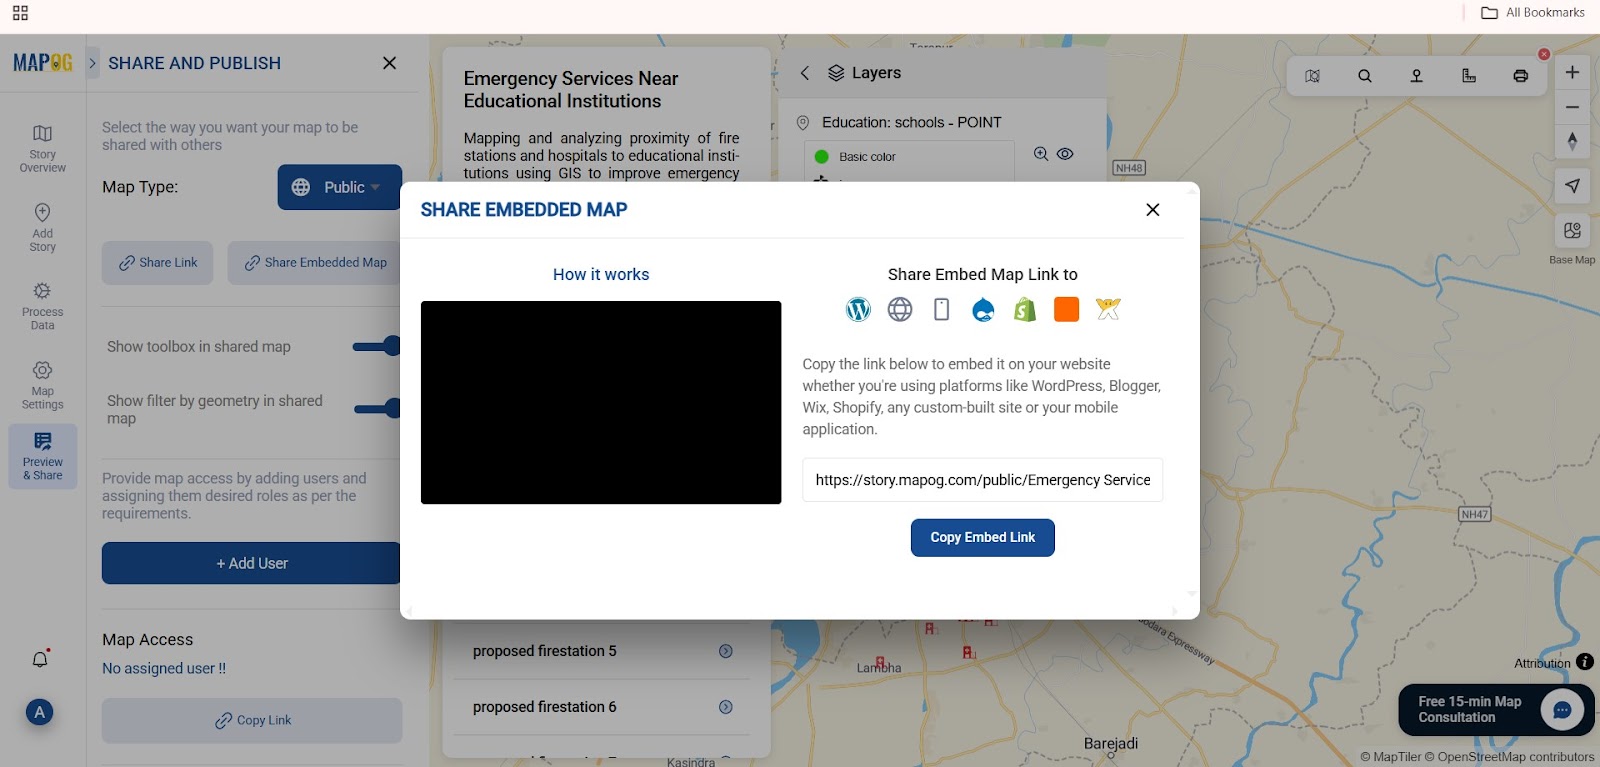
Step 6: Visualizing and Sharing GIS Maps for Emergency Planning
Click Preview and Share to check your final map. Make any last edits, then click Publish. You’ll get a shareable link to embed on your website or promote through emails and social media.
Applications and Benefits of Mapping Emergency Services Near Education
Moreover, this method plays a vital role in urban planning, disaster response, and school safety, as it helps allocate resources efficiently and reduce emergency response times. Additionally, it aligns well with Smart City initiatives and supports data-driven governance strategies.
Conclusion:Enhancing Educational Safety Through Emergency Services Mapping
By using GIS and tools like MAPOG, planners can bridge the gap between location data and infrastructure needs. Identifying where emergency services fall short and proposing new ones makes cities safer and more resilient.
GIS Data Used