With the help of GIS, professionals Draw and Style Property Boundary Maps to visualise, manage, and analyze land ownership clearly and efficiently. Whether you are a city planner, a surveyor, a real estate professional, or simply someone trying to understand land parcels in your community, drawing and styling property boundary mapping with GIS includes polygons on a map can turn raw data into something clear, interactive, and actionable.
With the growing use of GIS, this process has become easier than ever. MAPOG allows users to create property polygons, add attributes such as ownership details or land use, and style them for quick understanding. Ultimately, the result is a map that not only shows where properties are located but also tells a story of land use, management, and patterns that emerge when viewed in the bigger picture.
Key Concept: Why Draw and Style Property Boundary Maps?
In fact, property maps are much more than lines on a page; they:
- Provide legal clarity, showing who owns what.
- Help in urban planning and zoning, ensuring fair and efficient use of land.
- Moreover, property maps guide real estate transactions by offering transparency to both buyers and sellers.
- Support environmental management, especially when wetlands, forests, or agricultural zones overlap with human settlements.
Without proper mapping, property disputes can escalate, infrastructure projects may stall, and consequently, communities may miss opportunities for sustainable growth
Steps of Property Boundary Mapping
Select Feature Type Settings
- Log into MAPOG & create a map. After coming to the map interface click on Add Story and select “Add Manually.”
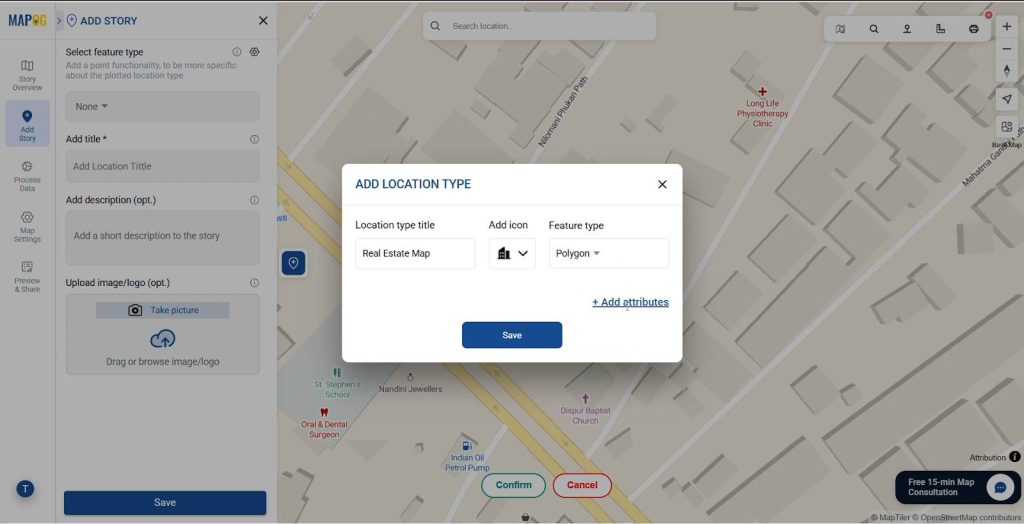
- Next, click on the Select Feature Type Settings option and either choose or create a suitable Location Type..
- From the feature type, select Polygon, also provide a location type title & a suitable icon for it.
- Add the necessary Attributes (e.g., area, ownership, land use, etc.) for the polygon
- Save the Location type and Add the Attributes according to necessity.
Draw the Polygons
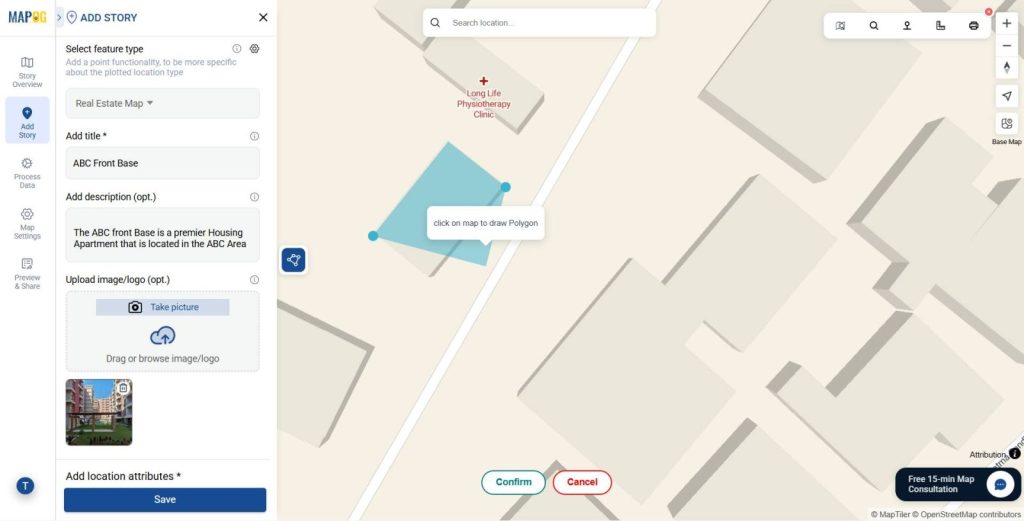
- Click on the Draw Polygon tab to create a Polygon. In MAPOG, once you’ve set up your map and chosen the right feature type, you can use the Draw Polygon tab to start creating property boundaries or building outlines.
- Draw a polygon around the Building or Property area. Carefully click along the perimeter of the building, land parcel, or property area you want to map. Each click places a vertex, and MAPOG automatically connects them with straight lines.
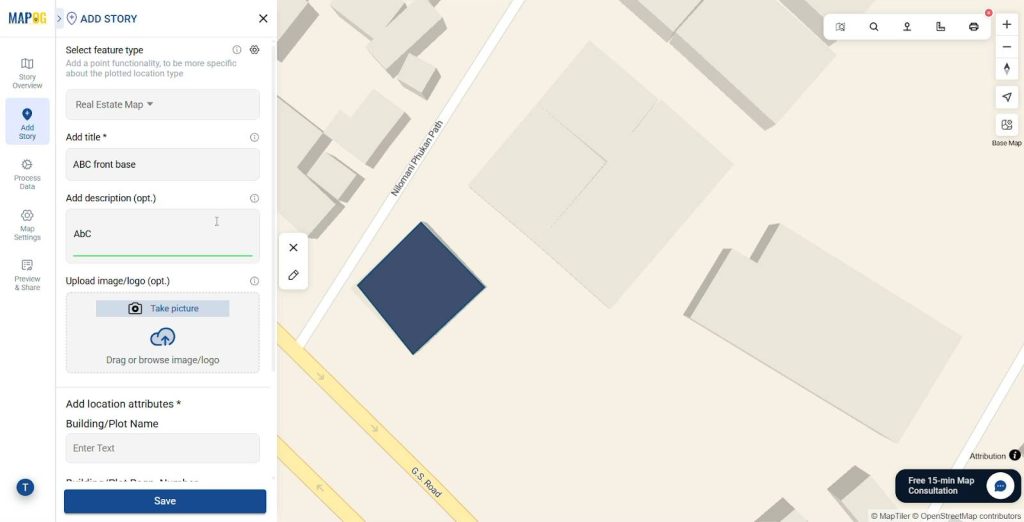
- Once you’ve completed the shape, confirm it by clicking the Save or Confirm Polygon option.
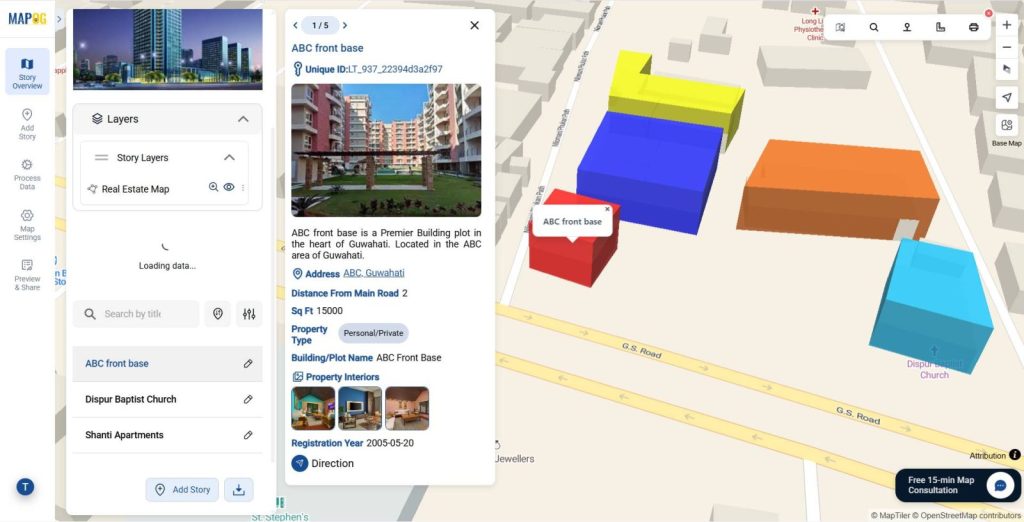
- Add a Title and Description for the polygon and also add necessary images to depict the property or building.
- Fill in the attributes accordingly and Save the Point.
Customize Polygons
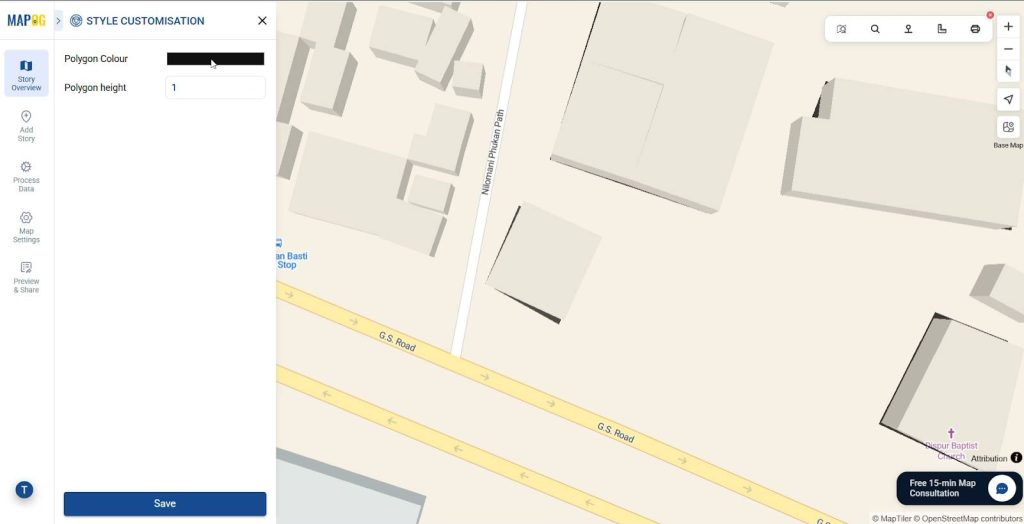
Click on the Style Customization and style Polygons according to necessity. Add suitable color & height to the location. This will provide an interactive 3D look to your map.
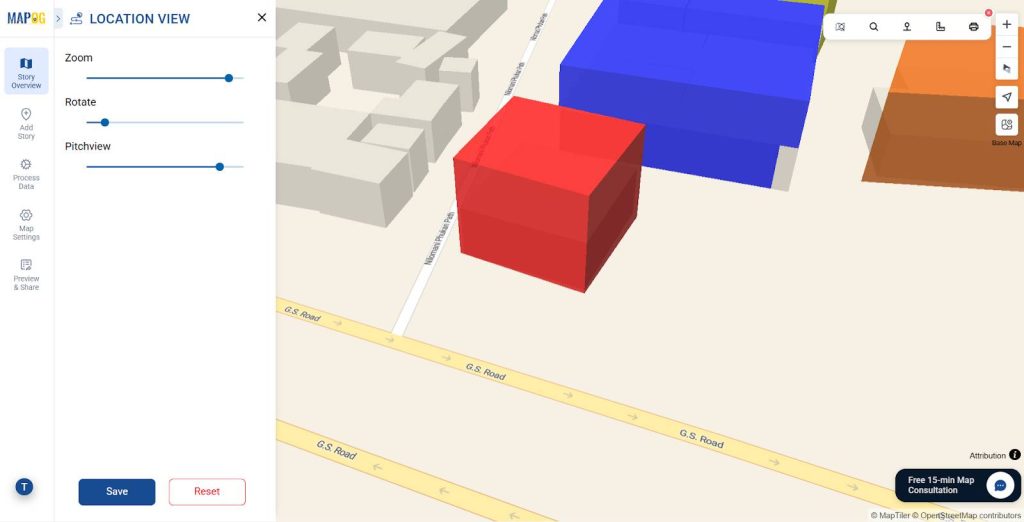
Customize the Location View
Click on the pencil icon of any building location & Customize the Location View, you can zoom in & out, set rotate & pitchview to efficiently determine and visualize the polygons for the Plots or Buildings.
Applications of Property Boundary Mapping
- Urban Planning: Identify land available for infrastructure, schools, or public facilities.
- Real Estate: Showcase property details interactively to potential buyers.
- Government & Policy: Maintain up-to-date records for taxation and resource allocation.
- Environment: Track changes in wetlands, agricultural plots, or forests as cities expand.
Conclusion
Drawing and styling property boundary polygons on a map with MAPOG may sound technical, but it’s really about communication. By combining accurate boundaries with clear visual styling, you create a tool that cuts through complexity and provides clarity. For planners, it means better zoning; for citizens, it means transparency; for businesses, it means smarter decision-making.
Have you ever created polygons in maps? Share your thoughts and experiences in the comments!
More from MAPOG:
- Protecting Wetlands: Guide to Create GIS Map for Nature
- Fast Emergency Response: Using GIS and Isochrone Maps for 10-Minute Ambulance Arrival
- Make Routes for Military Aerial Planning- Through Bearing angle and Distance calculation – Online Route Compass
- GIS Analysis in Urban Planning: Reshaping Transportation Future Insights of state/city