In today’s data-driven world, learning how to create and embed live maps into your blog or Website can instantly boost engagement and clarity. Whether you’re showcasing public services, identifying urban gaps, or promoting inclusivity, interactive maps transform static content into immersive, insightful experiences no GIS skills required.
With MAPOG, a no-code mapping tool, anyone can create and embed live, interactive maps in just minutes. These maps respond to user actions like zooming, clicking, and filtering, bringing your story to life. For example, let’s look at a practical case: Public Park Accessibility Mapping.
Key Concepts Covered
To begin with, this guide simplifies GIS and web-embedding for non-technical users. It focuses on interactive mapping by enabling dynamic, clickable maps for blogs or reports. Furthermore, it introduces accessibility mapping as a way to visualize service reach. Moreover, tools like buffer zones and isochrones help present spatial data in a meaningful way, all without requiring any GIS expertise. Above all, the real power lies in MAPOG’s embedding feature. With its built-in functionality, users can generate a simple embed code that integrates seamlessly with platforms like WordPress or Medium or in your Website. As a result, your content becomes fully interactive, inviting readers to explore, zoom, click, and engage with your story in real time. Consequently, this boosts both content visibility and audience engagement.
Step 1: Create and Embed Live Maps
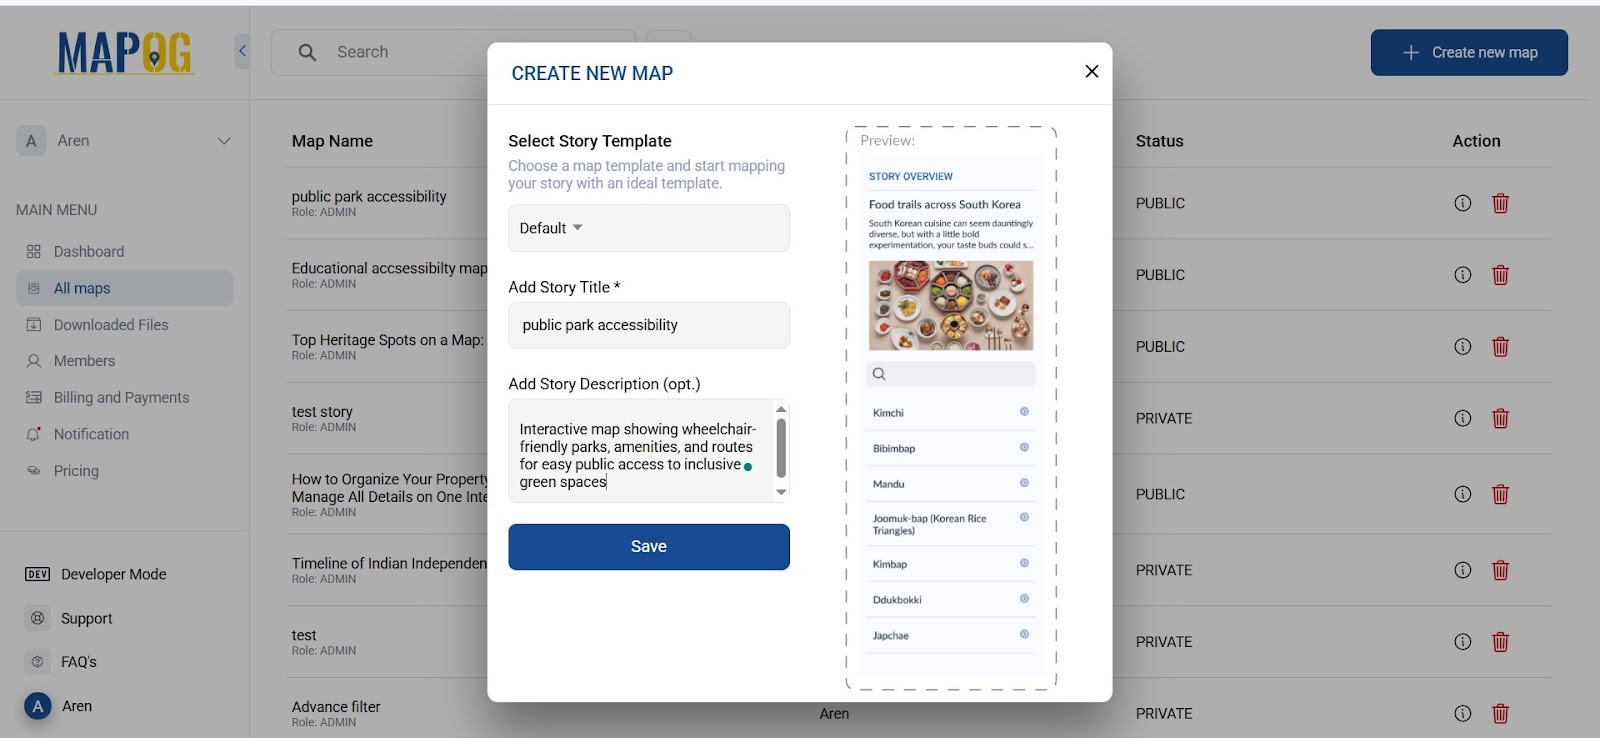
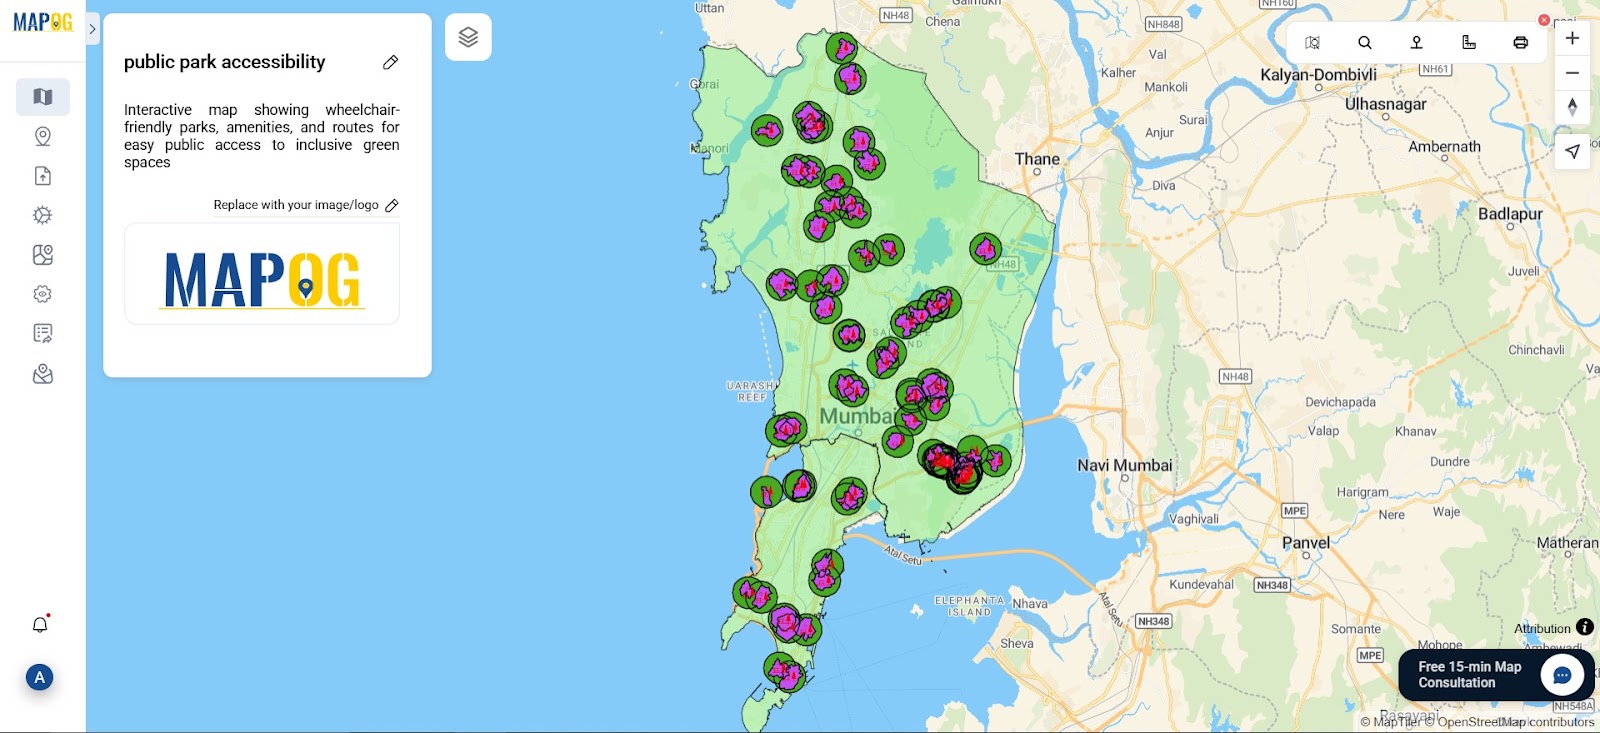
To get started, visit MAPOG and click “Create New Map.” Assign your project a clear title, such as Public Park Accessibility, and add a short description that outlines your map’s objective. This helps users quickly understand your intent.
Step 2: Define Boundaries to Create Accurate Live Maps
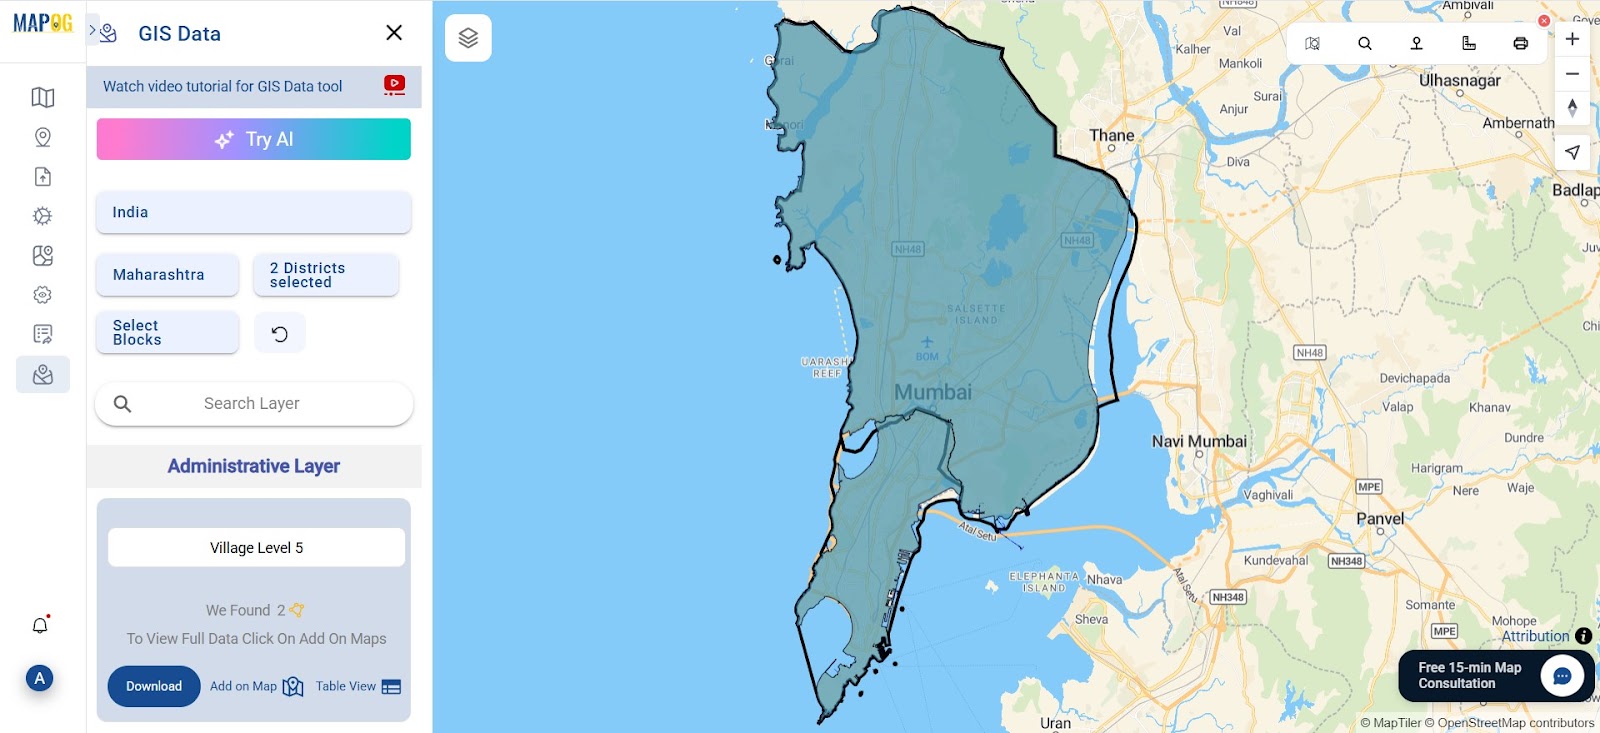
Next, define your area of interest. Go to the GIS Data panel and select your region, right down to the district or block level. Add the Administrative Boundary layer and style it with a soft green tone. This will serve as the base layer, setting the stage for all additional data.
Step 3: Add Green Spaces to Enhance Your Live Map
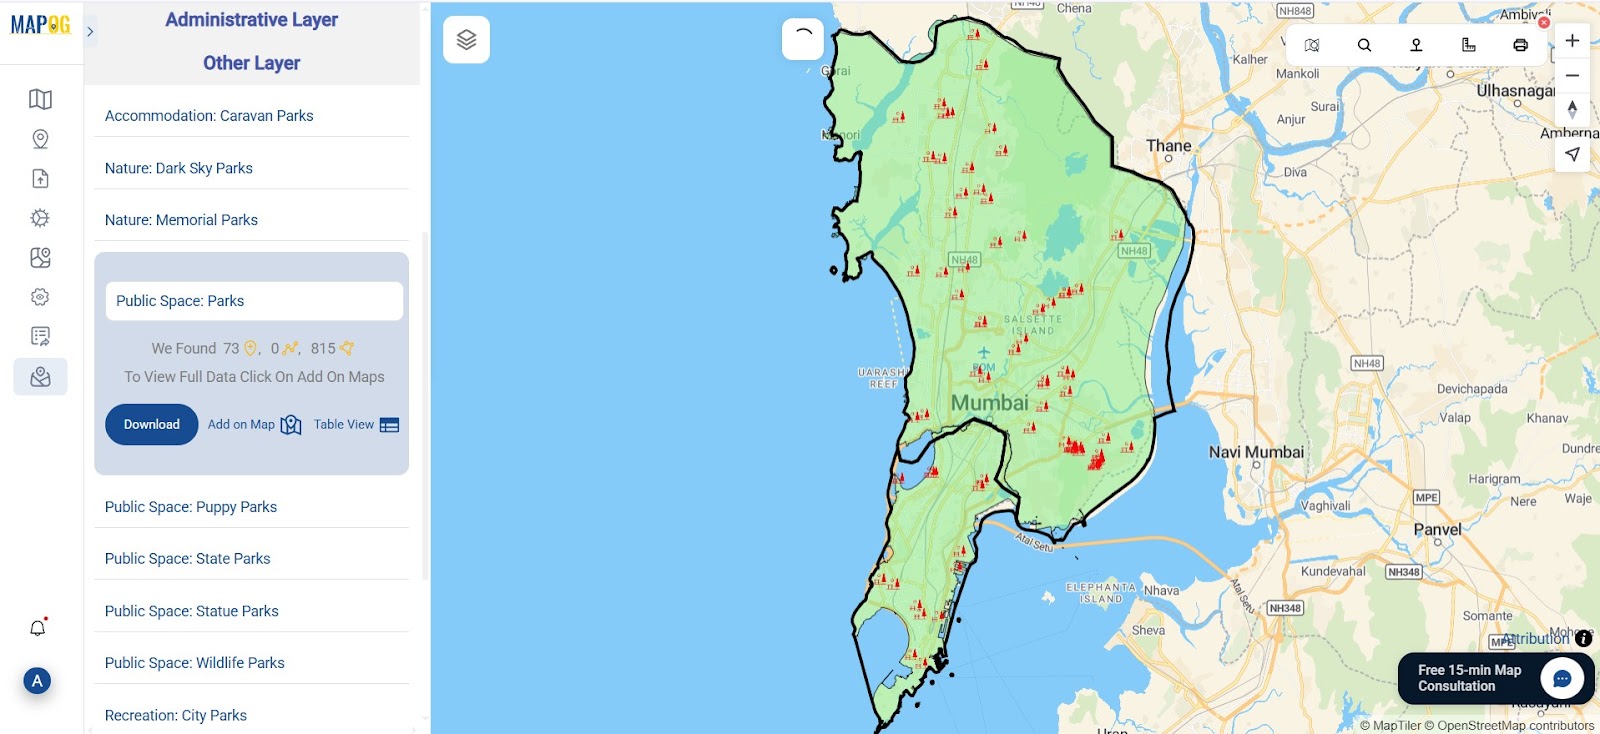
Now it’s time to showcase your public green spaces. Return to the GIS Data panel, choose the Public Parks layer for your selected region, and add it to your map. Markers will automatically appear, giving your audience a quick visual of all park locations.
Step 4: Use Buffer Zones to Create Smarter Maps
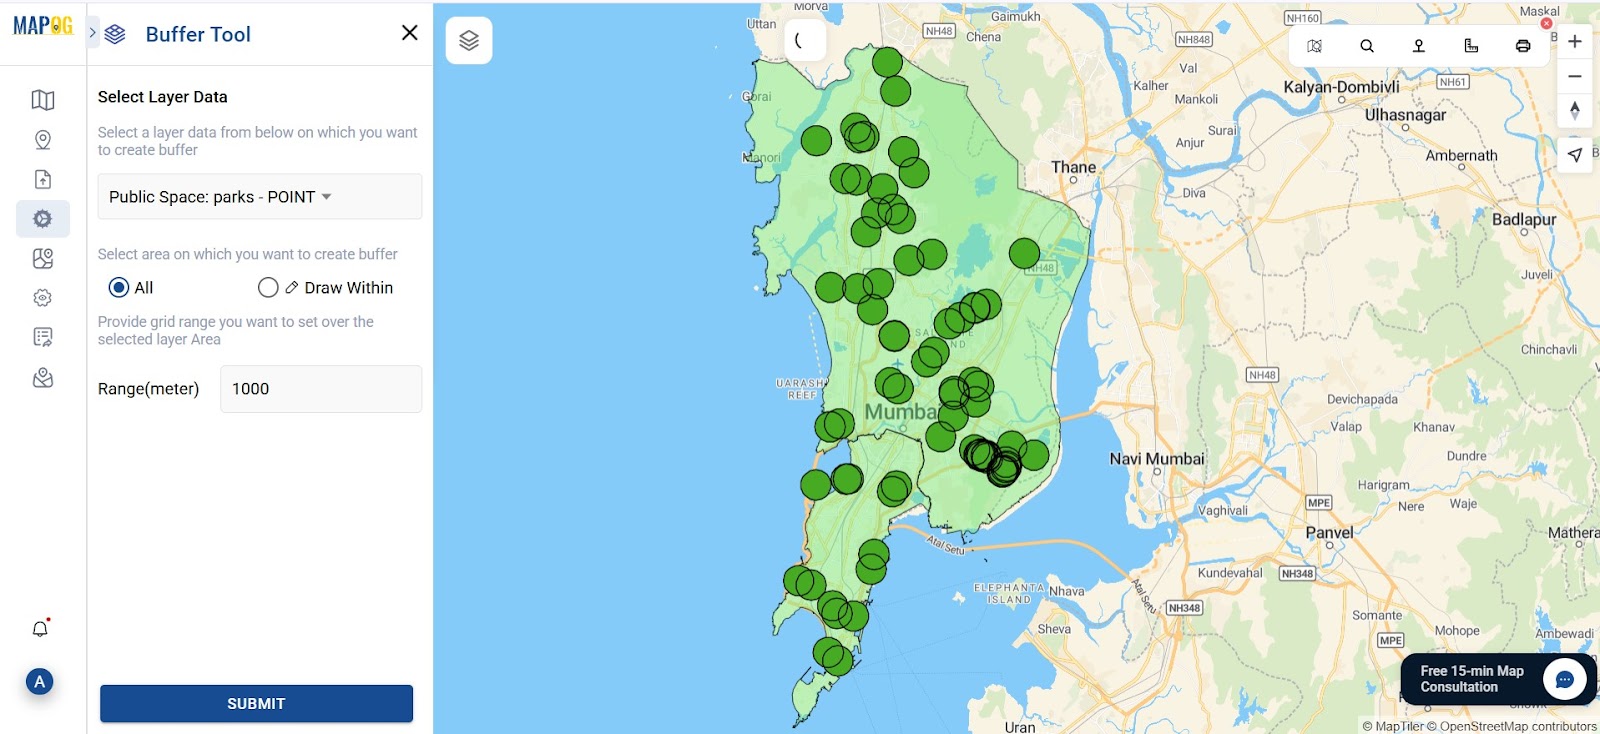
To analyze park accessibility, go to the Process Data and open the Buffer Tool. Choose the Public Park layer and set the range to 1 kilometer. This shows all neighborhoods within walking distance of a park ideal for assessing equitable park access.
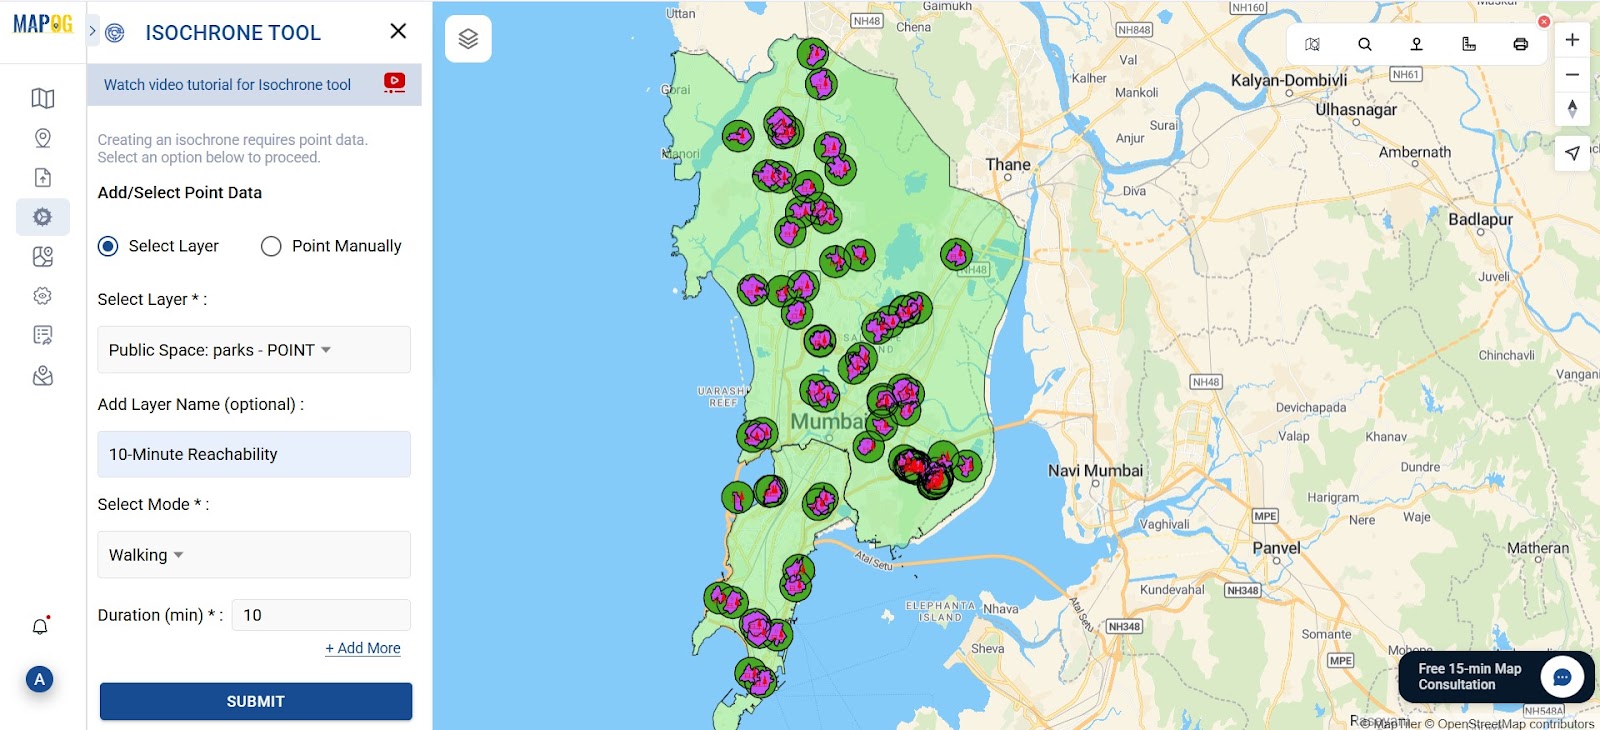
Step 5: Map Walkability with Isochrones for Deeper Insight
For deeper insights, use the Isochrone Tool to visualize walkability. Select the Public Park layer and name the output 10-Minute Reachability. Choose “Walking” as the mode and set the time to 10 minutes. Colored polygons will appear, representing areas reachable within that duration. To clarify the map further, apply custom icons or hues to distinguish these zones.
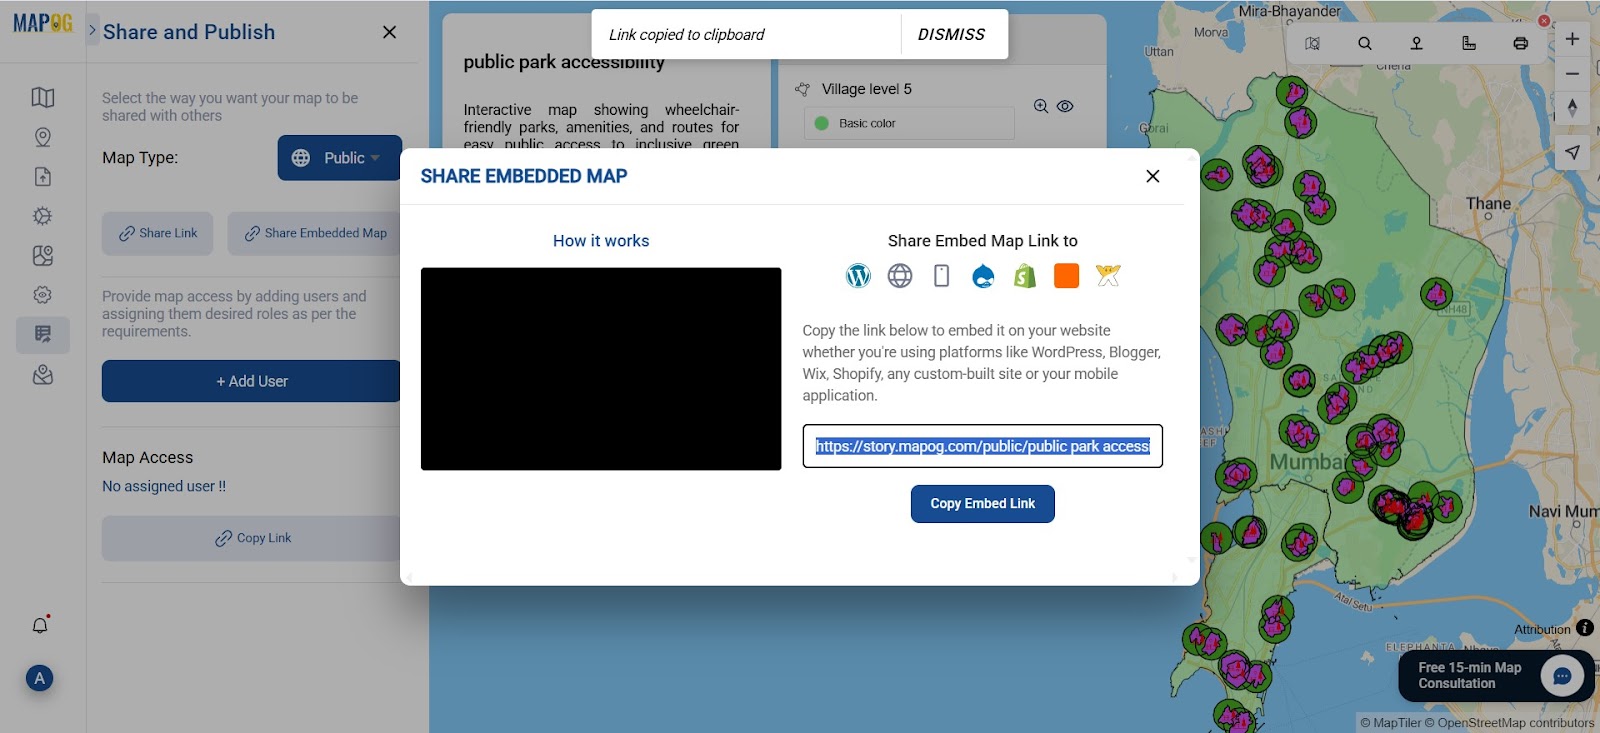
Step 6: Preview, Create, and Embed Your Live Map in Any Blog or Story
After reviewing your map, click “Preview and Share.” Make it public, then select “Embed Map.” MAPOG will generate an embed code, which you can paste directly into your blog, report, or website. Unlike static screenshots, these live maps stay current and interactive, offering long-term value and encouraging user engagement.
Industry Use & Benefits
This method serves many fields. Urban planners can assess green space access, while advocacy groups highlight inclusive infrastructure. Local governments gain insights on park equity, and researchers or NGOs can tell impactful, data-driven stories. In short, live maps turn raw spatial data into real-world action.
GIS Data Used
Conclusion
You no longer need technical skills to create and embed live maps. Thanks to no-code tools like MAPOG anyone can turn raw location data into rich visual stories.
Whether you’re mapping accessibility, green spaces, or urban issues, live maps make your story stand out.
Here are some articles you might be interested in :