In the Real Estate Project Portfolio industry, spreadsheets limit visibility and location context. Flat listings reduce projects to rows, hiding regional spread and stage differences. MAPOG solves this by turning project data into an interactive map portfolio, enabling clearer comparison, quick insights, and better portfolio management.
Key Concept: Real Estate Project Portfolio
Interactive maps display all real estate projects in one place. Instead of long spreadsheets, users quickly view project locations, regional clusters, and coverage areas. Key attributes like project name, stage, property type, and availability remain linked to each location.
What Is an Interactive Real Estate Project Portfolio?
It is a GIS-based mapping approach where real estate developments appear as map markers with project details. This allows users to explore projects visually, identify development clusters, and manage the entire project portfolio from one map interface.
Methodology: Real Estate Project Portfolio
Interactive mapping simplifies portfolio analysis by turning scattered project data into a clear visual workflow.
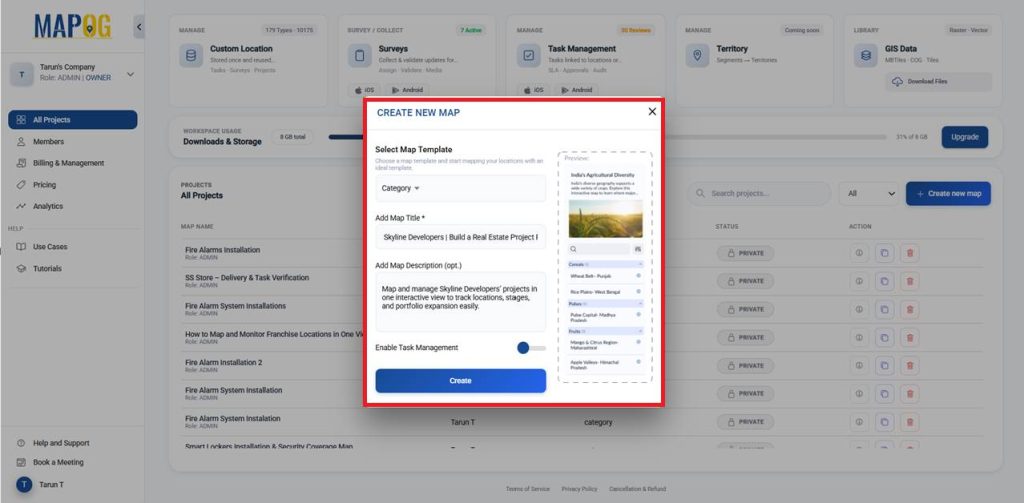
1. Build Your Property Portfolio Map
First, open MAPOG and click Create to start a new map project. Select the Category template, then add a clear title and short description. Click create to save the map.
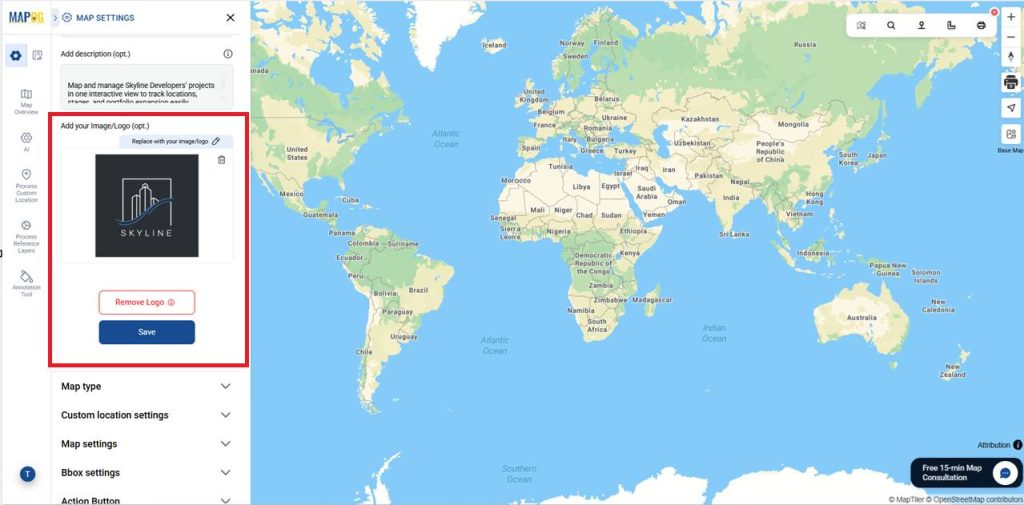
2. Add your Image/Logo
Therefore, click Replace to upload your image or logo, make the required edits, and save it as your company logo.
3. Use of Action Button
In Map Settings, choose the Action Button to add details such as a website link and phone number.
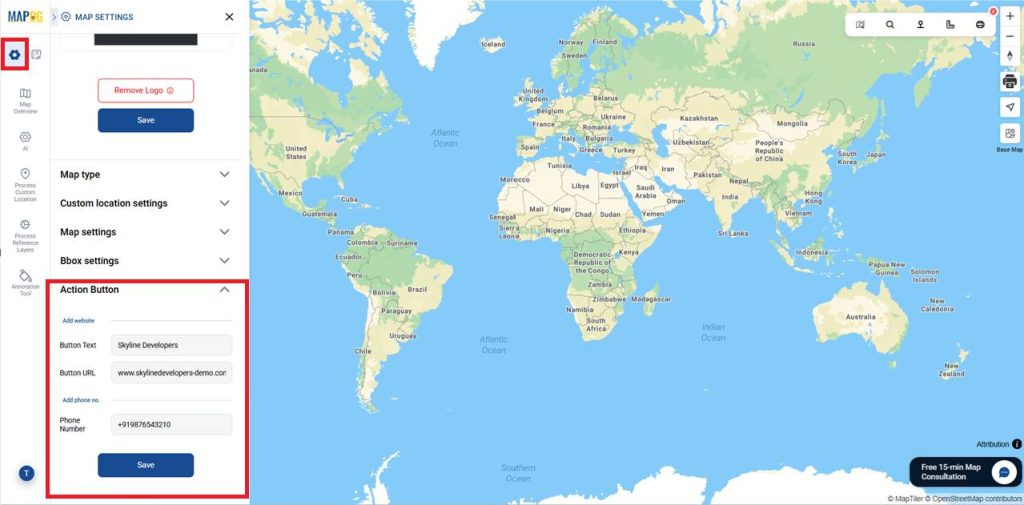
After entering the information, click Save. When selected, the button instantly opens the website or initiates a call.
4. Add Project Portfolio Data
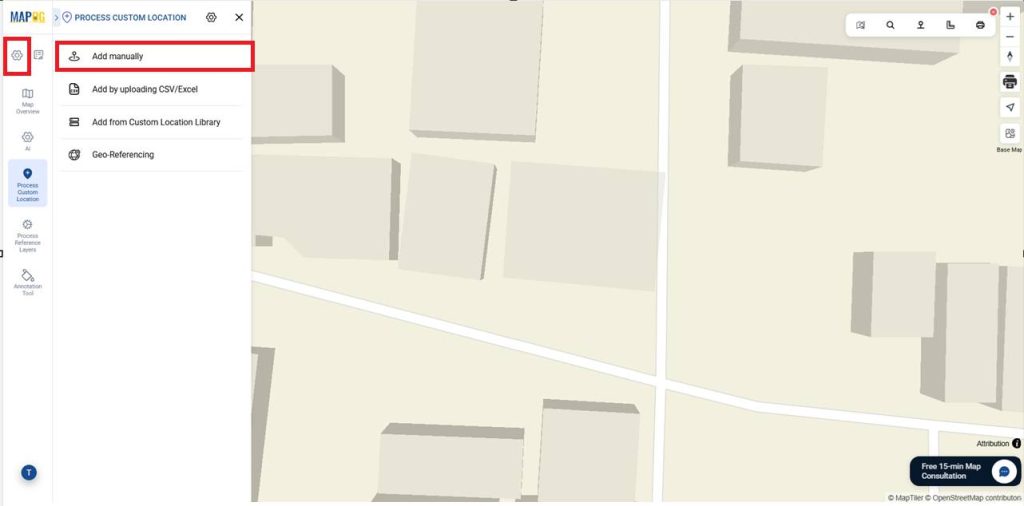
Furthermore, open Process Custom Locations and select Add Manually to add property locations individually.
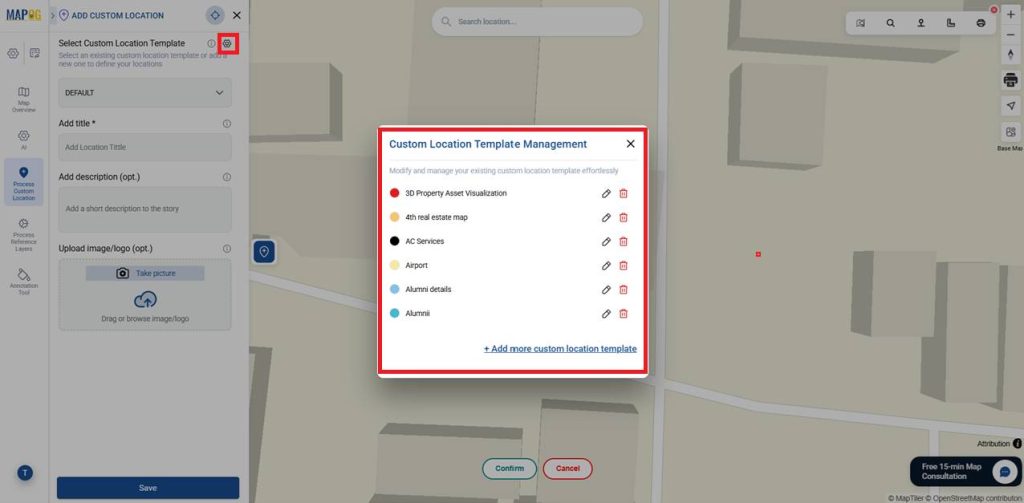
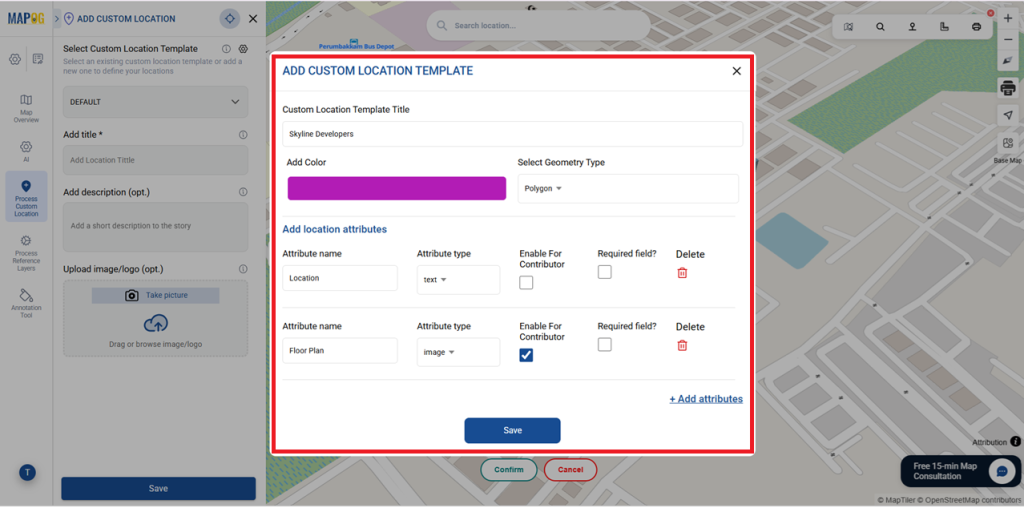
Meanwhile, open Select Custom Location Template Settings. To create a new property template in Custom Location Template Management, click + Add More Custom Location Template.
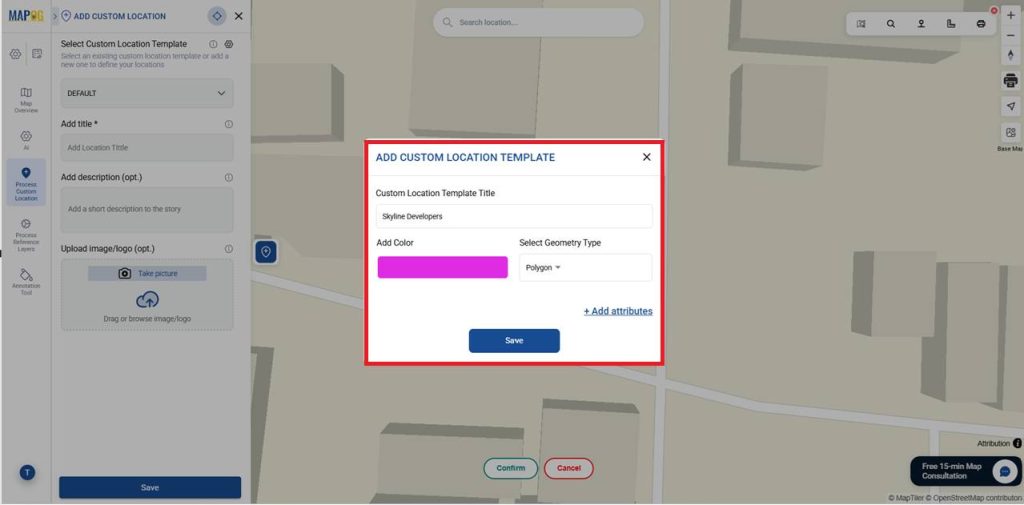
Consequently, enter the template title, choose a color, and set the geometry type to Polygon to define the building footprint and enable accurate 3D height and depth in MAPOG.
Additionally, click Add Attributes to add fields like Property Name and Project Stage and set their types as Text, Select, Multiselect, or Number to create a structured location template.
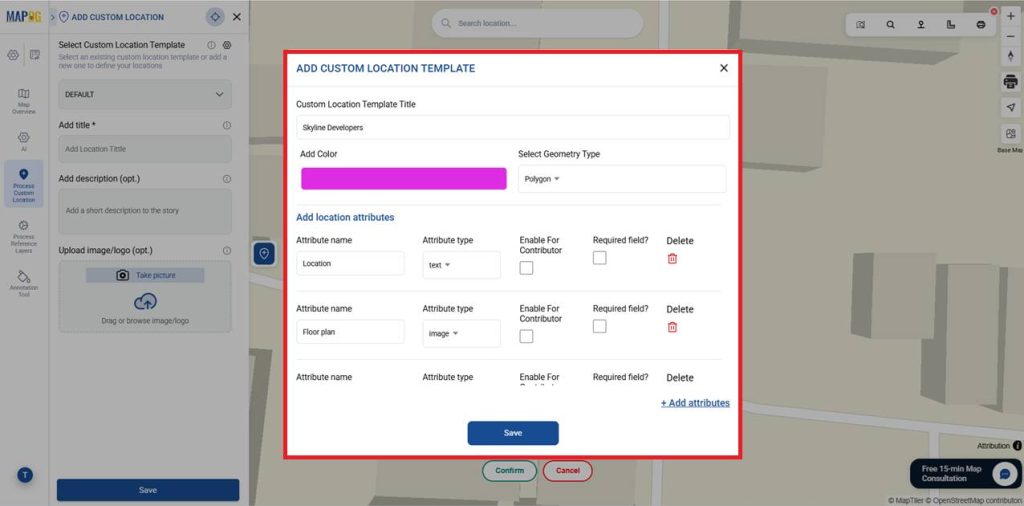
Enable for Contributor so contributors can view and fill these fields when adding locations, ensuring consistent property data.
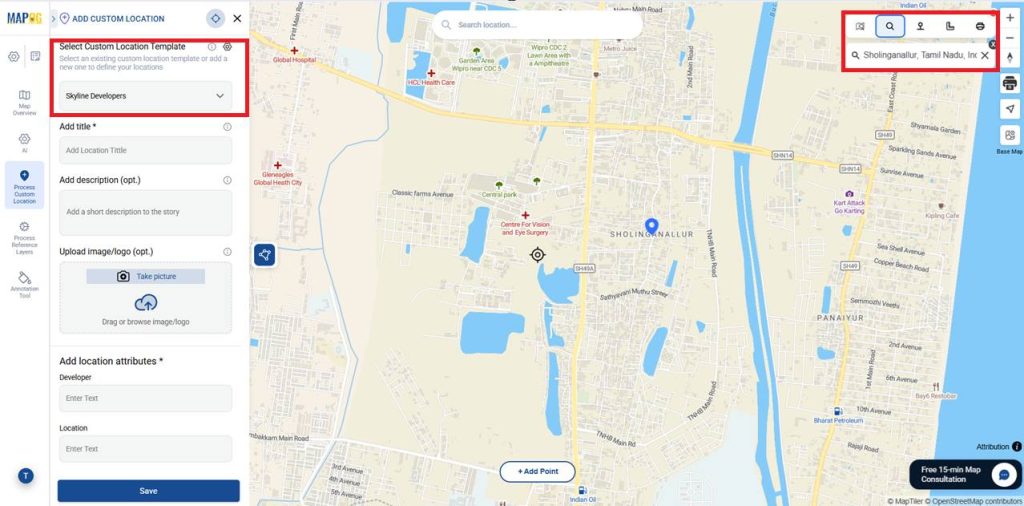
After adding attributes, click Save. Select the template under Select Custom Location Template, then use Search by location or coordinates in the top-right to map your chosen location.
Then draw the boundary using the Polygon tool by clicking Add Point at each location, and click Confirm once all points are marked.
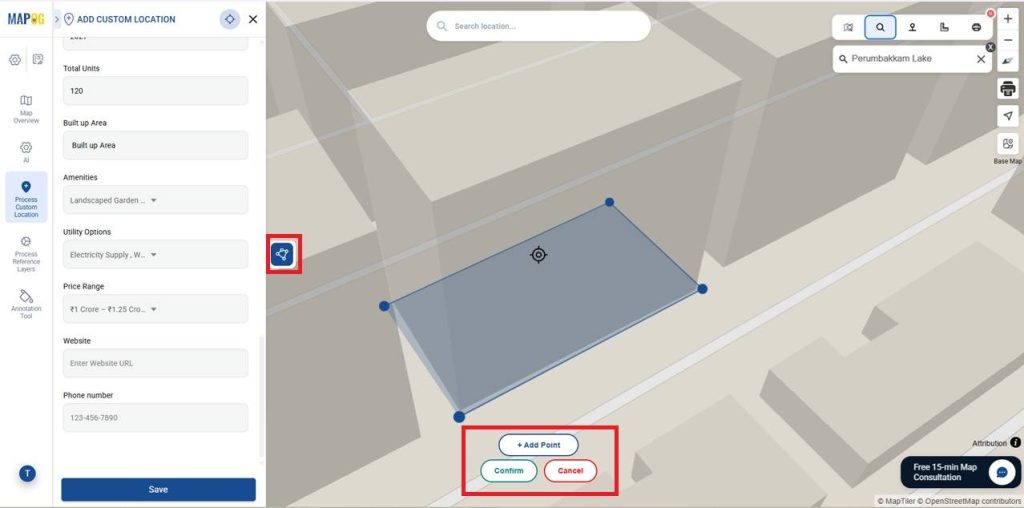
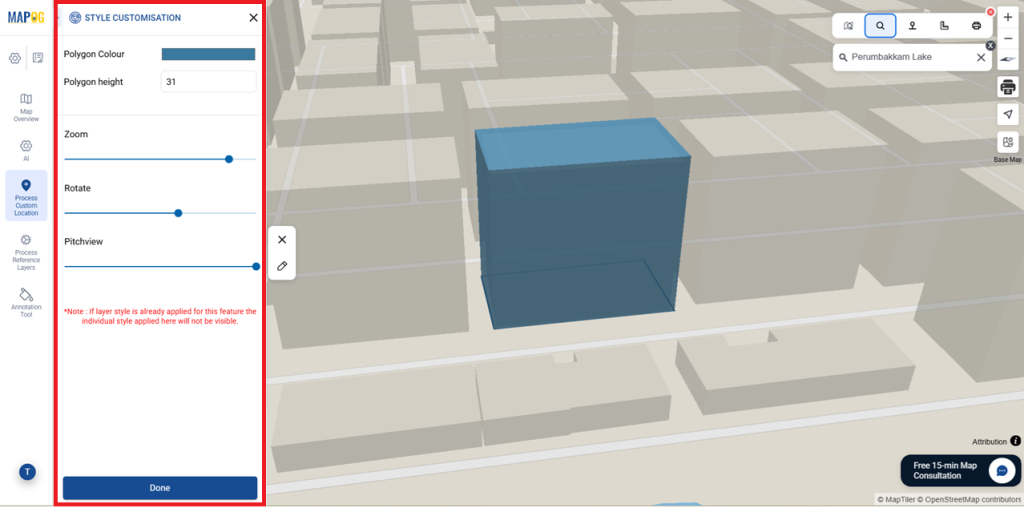
After clicking Confirm, select the Edit icon to open Style Customization. Set building color and height, adjust zoom, rotation, and pitch to control the 3D view, then click Done to improve 3D property visualization clarity.
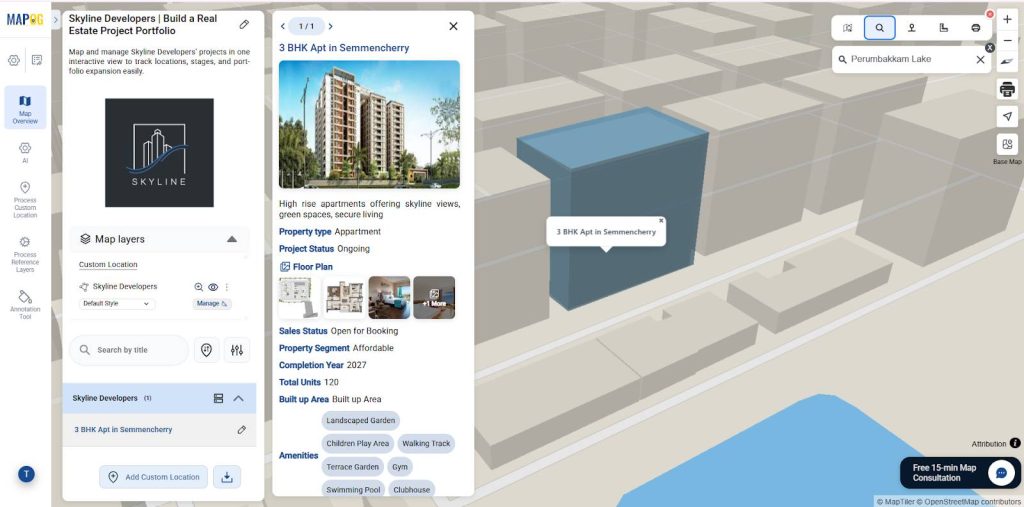
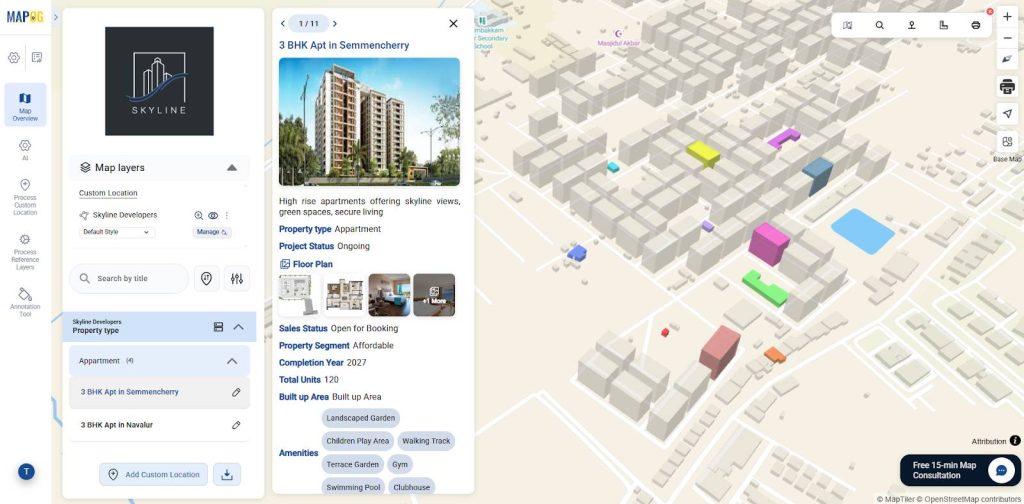
After that, add the Property Name, Project Stage, Property Type, Floor Plan, and other required attributes. You can also upload images to provide a visual preview of the property along with the listing details.
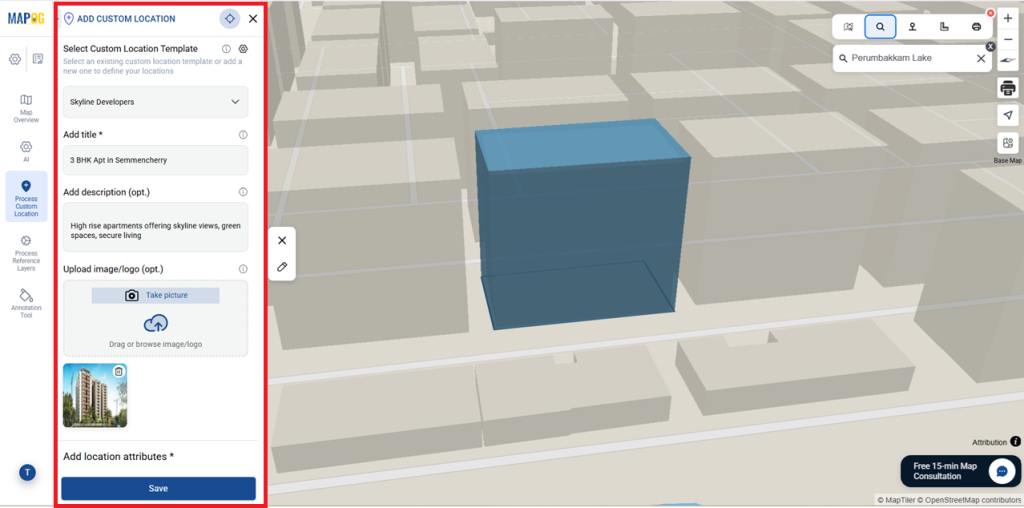
Save the location to enable interactive pop-ups that show asset details on click.
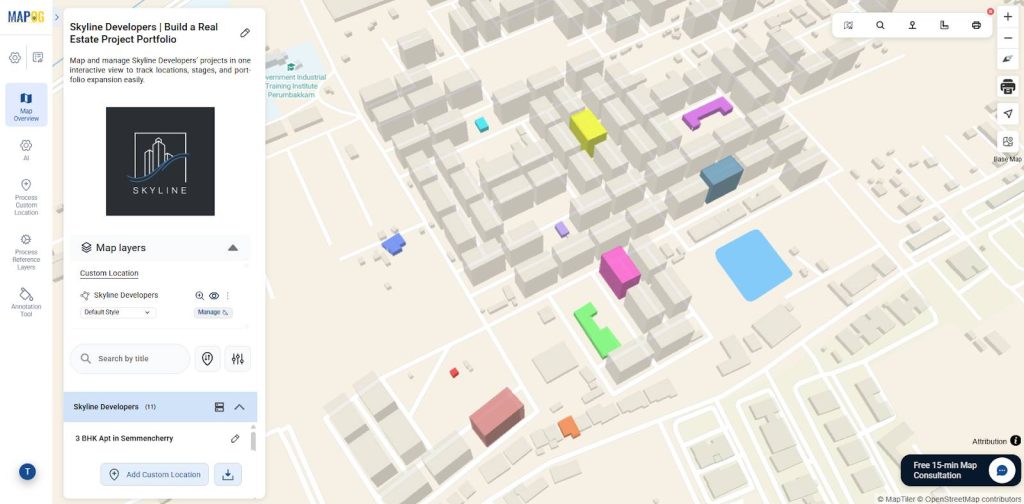
Add the remaining locations the same way, adjust rotation and pitch for better building views, and save each for accurate visualization.
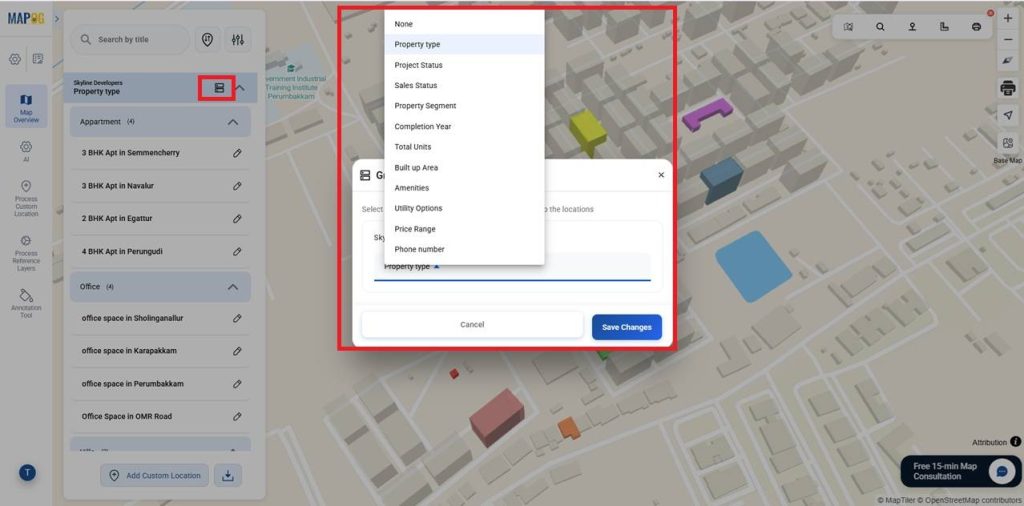
5. Group by Attributes
Using Group by Attributes, you can categorize properties by Project Stage or Property Type. Then click Save Changes to apply the grouping and view the updated categories on the map.
6. Filters and Sorting Tool
Filters help refine properties by Project Stage or Property Type. Go to the Filter tool, choose the needed criteria, and apply it. Only the selected locations will appear on the map.
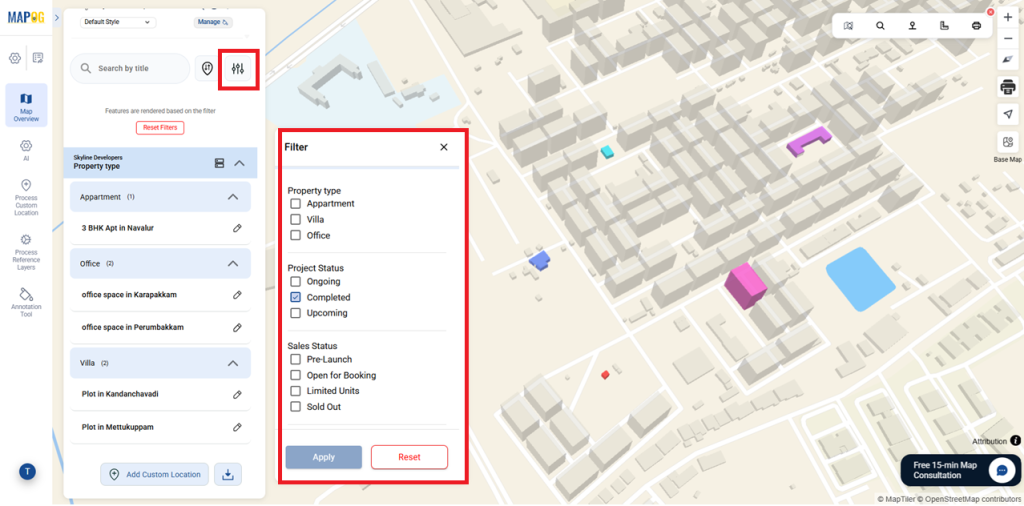
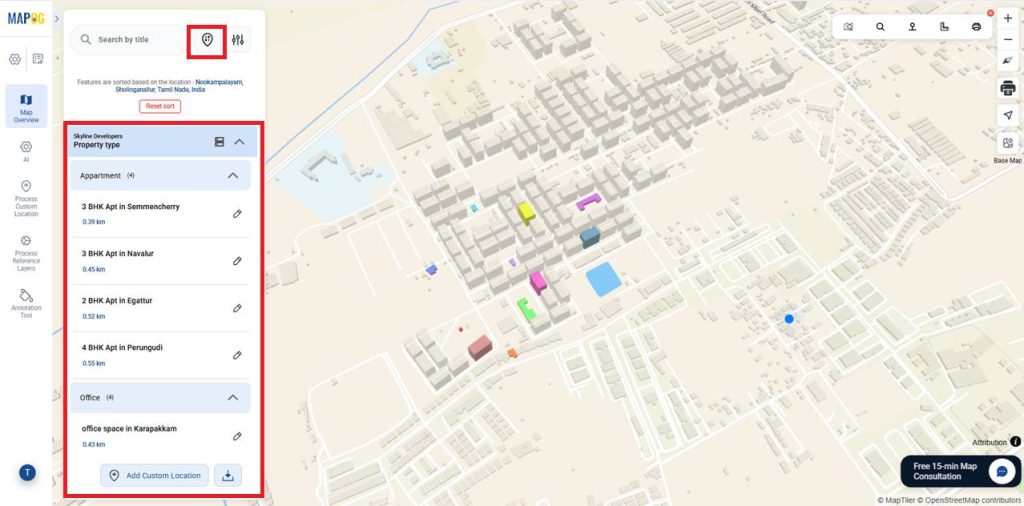
Use Sort by Distance to arrange locations by distance from the searched point, helping you quickly find and compare the nearest properties on the map.
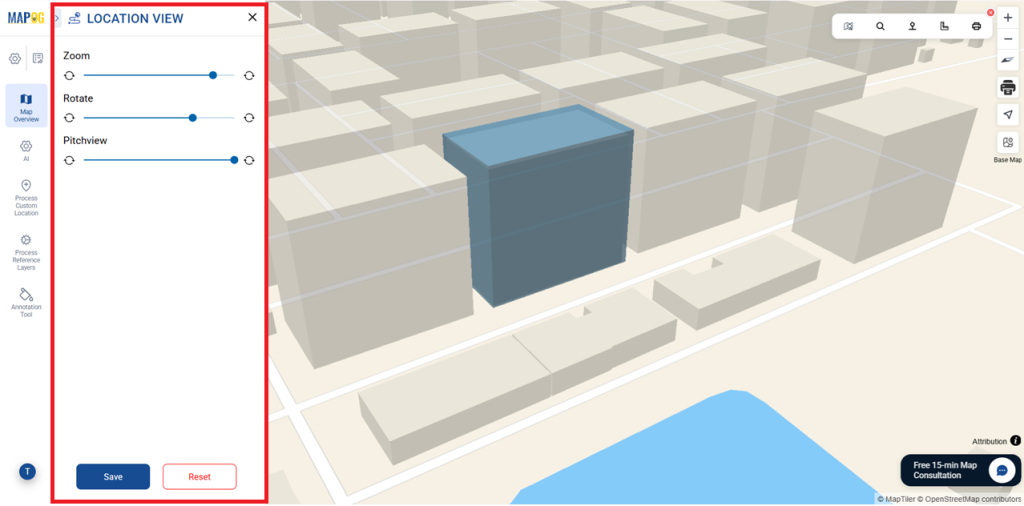
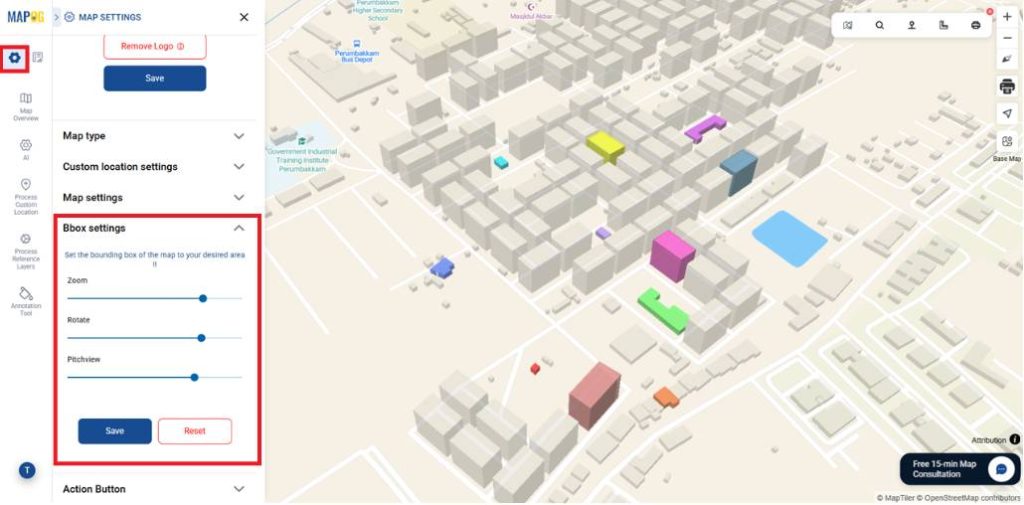
7. Setting the location view
You can edit the Zoom, Rotate, and Pitch view for each location individually by selecting the Custom Location View.
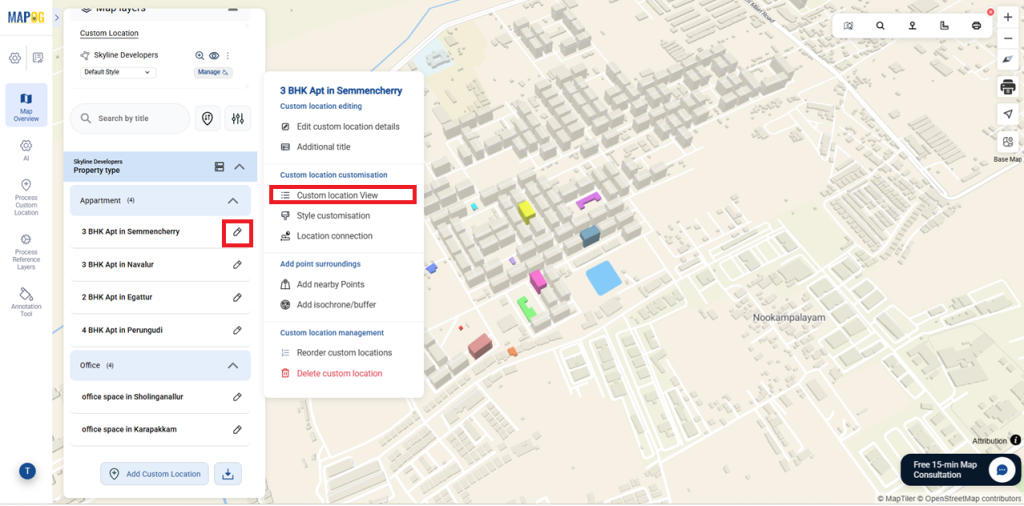
This helps highlight the building clearly and improves the 3D viewing perspective on the map.
However, Adjust Zoom, Rotate, and Pitch in Map Settings – Bbox Settings to set a clear and consistent view of the entire map with all locations.
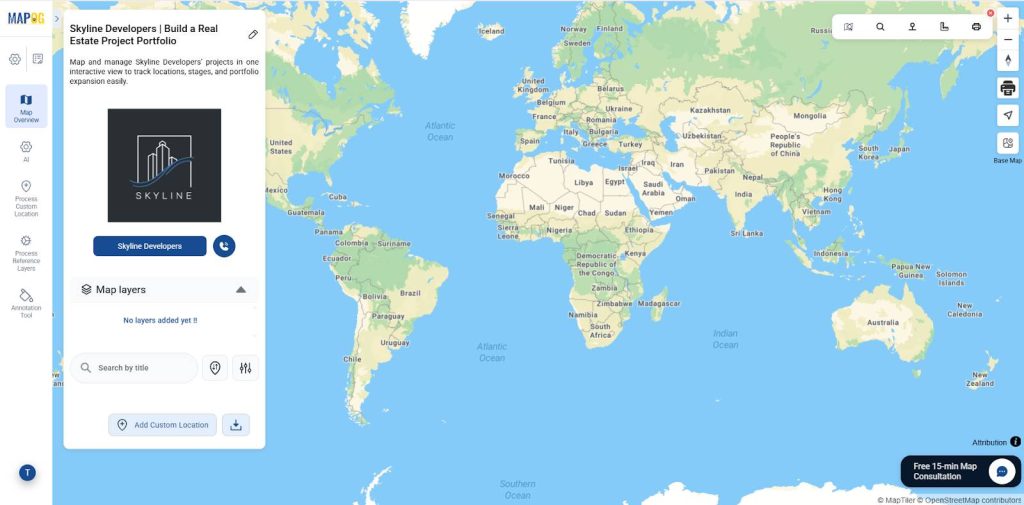
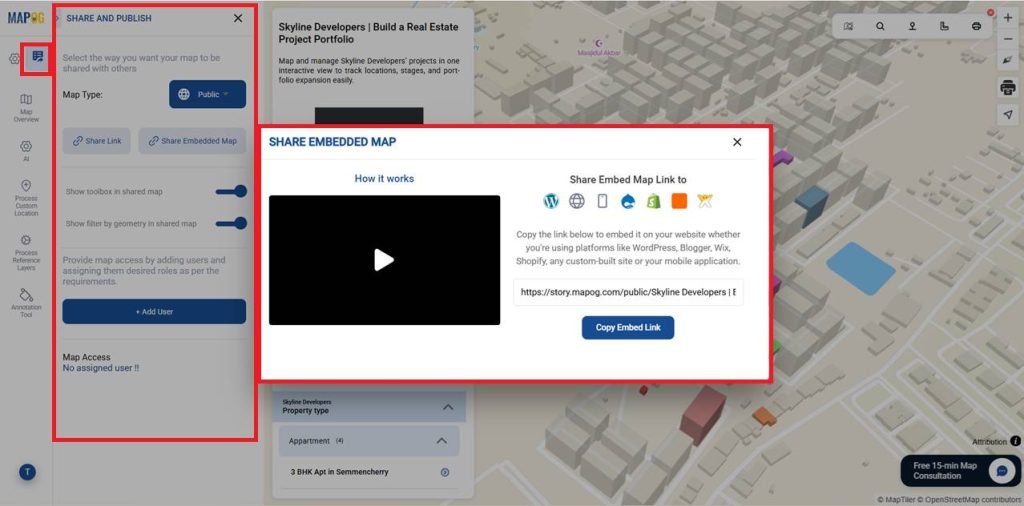
8. Publish and Share Your Map
Finally after setup, use Preview & Share to make the map public and create a shareable or embeddable link. This lets stakeholders easily access and explore the property portfolio map and its attributes.
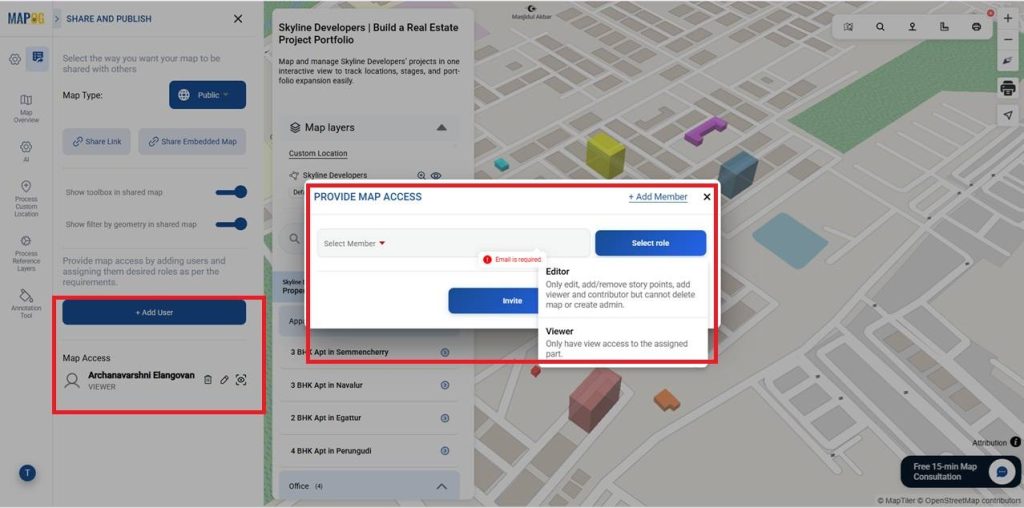
Use +Add Users to include existing users or create new ones with Add Members. Then invite them to view or edit the map based on the access permissions you assign.
Industry Use Cases and Benefits
Similarly, 3D property maps display multiple assets in one view. They help real estate, planning, and construction teams compare properties and understand layouts, locations, and nearby infrastructure quickly.
Conclusion
In conclusion, MAPOG converts complex property data into an interactive 3D visualization, allowing users to explore locations, view asset details, and make confident, data-driven decisions using a single interactive map.