Attach files, links, and images to map pins is what transforms a simple map into an interactive storytelling tool. Instead of limiting a pin to just coordinates and a title, you can enrich it with supporting documents, external references, or photographs with MAPOG. This makes maps not only visually engaging but also more useful—whether for education, research, planning, or public engagement.
Take the case of a History Map. Instead of static timelines in a textbook, each pin can hold detailed notes, PDFs, or photos—turning abstract events into immersive, spatial stories. Learners can connect places, events, and narratives in a meaningful way.
Key Features
Attach files, links, and images transforms maps into storytelling tools. Pins can hold documents, photos, and archives—turning events like Panipat, Plassey, the Dandi March, or Jallianwala Bagh into rich, interactive lessons instead of static lists.
With category filters, attached documents, and images, users can explore India’s past through multimedia storytelling. Hence, this aligns with the principle of Create Story Maps for Education: A Visual Way to Teach History, Geography — turning passive learning into active exploration.
Steps to Build Your History Map with MAPOG
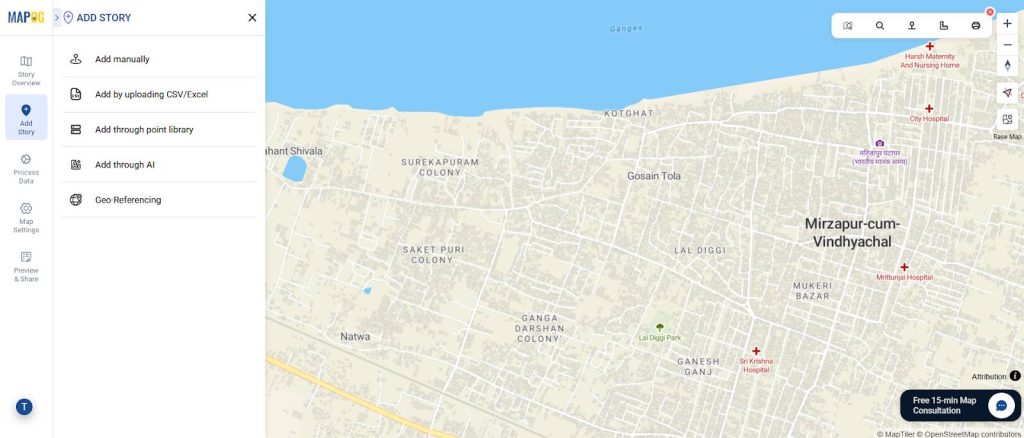
Step 1: Add Story Points
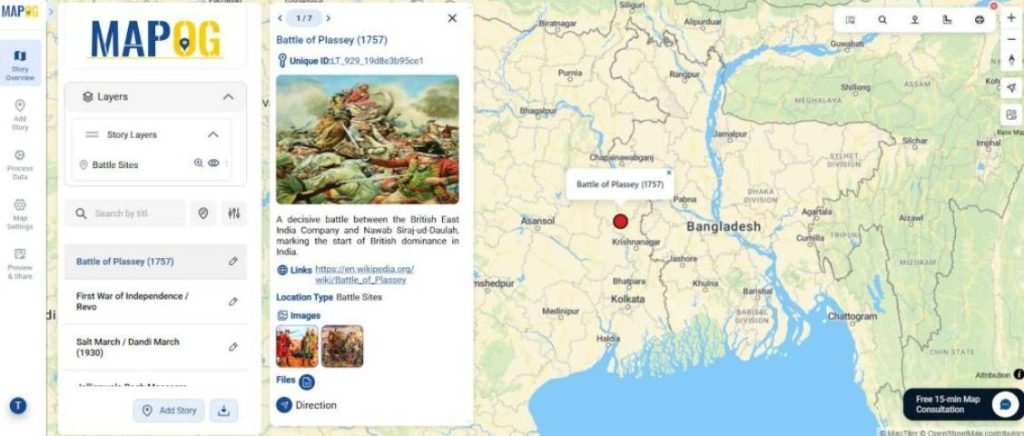
To begin mapping historical events, you first need to plot them on the map. MAPOG gives you two options: manual placement or latitude/longitude entry.
- Go to “Add Story” → “Add Manually.”
- Then, zoom into the map and click directly on the exact location where the event took place.
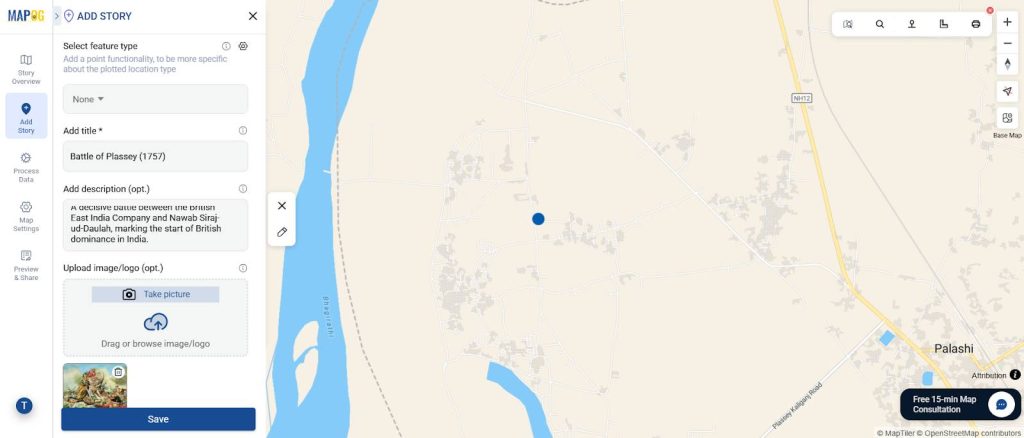
2. Fill in the Story Point Details:
Provide Title: Event name (e.g., Battle of Panipat)
Description: Add background, date, key figures, and outcome.
Files & Media: Then, upload images like sketches, maps, or monuments.
Hence, each pin becomes a mini history lesson with context, visuals, and references.
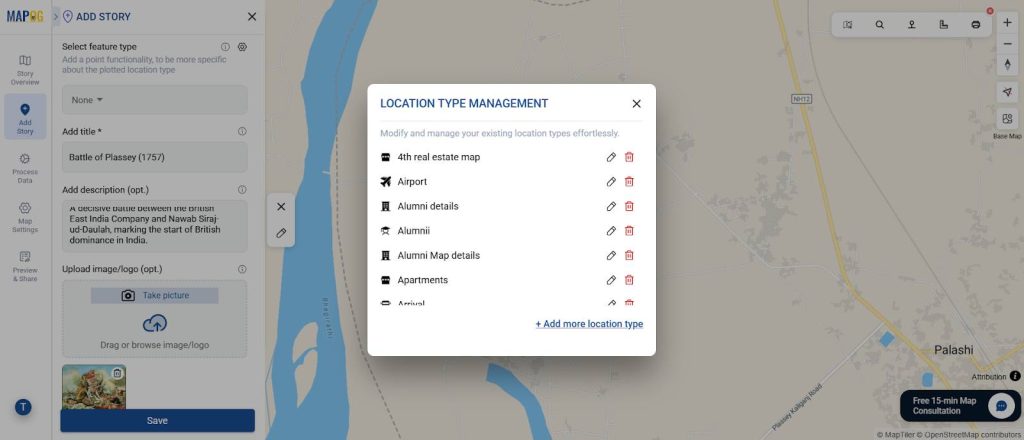
Step 2: Organize with Location Types
- In the “Select Point Type” menu, open Location Type Manager to structure your map.
- You can also add custom fields such as Event Date, Key Figures, Outcome, and Significance so every pin carries meaningful details.
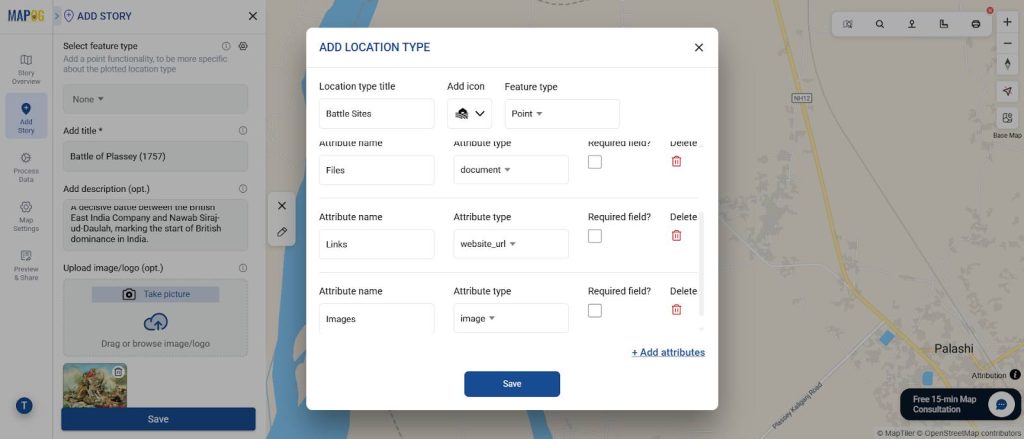
Step 3: Add Files, Links & Images
This is the core feature for history mapping:
- Choose Attributes
- Add details like Event Date, Key Figures, and Outcome to make each pin informative.
- Upload Images
- Create a new attribute called Images.
- Set the attribute type as Image.
- Then, attach important photos in JPG/PNG format for visual impact.
- Add Links
- Create a new attribute called Links.
- Set the attribute type as URL.
- Connect pins to references such as Wikipedia pages, academic articles, archival records, or documentary videos.
- Add Documents
- Create a new attribute called Docs.
- Set the attribute type as Document.
- Then, attach PDFs or Word files like detailed notes, timelines, or research papers for deeper study.
- Save & Finalize
- After adding all attributes and attaching the information, save the location type.
- Then, save the point so everything is stored properly.
Purpose: Images make the events visually engaging, while links extend the learning experience beyond the map—turning each pin into a mini history lesson.
In one line: Each popup becomes a mini history lesson, combining text, visuals, and references.
In two lines: Instead of just seeing a pin on a map, learners can click to explore documents, images, and reliable links—making history both interactive and immersive.

Industry Applications
Interactive History Maps go beyond education by attaching files, links, and images to serve multiple uses:
- Education & Research: Students and teachers combine history with geography for deeper learning.
- Museums & Heritage: Showcase monuments with multimedia-rich pins.
- Public Engagement: Governments can promote heritage trails.
- Academia: Finally, enables spatial analysis of movements, battles, and cultural shifts.
Conclusion: Smarter History Mapping
An Interactive History Map is more than pins—it’s a living archive. By attaching files, links, and images, educators can turn abstract timelines into interactive journeys across India. Hence, with MAPOG, history becomes engaging, shareable, and alive—shifting from something remembered to something experienced.