Map and Monitor Franchise Locations, scattered records hinder outlet tracking. MAPOG centralizes data into interactive maps, enhancing location visibility, monitoring, regional insights, and faster, spatially informed decision-making.
Key Concept: Map and Monitor Franchise Locations
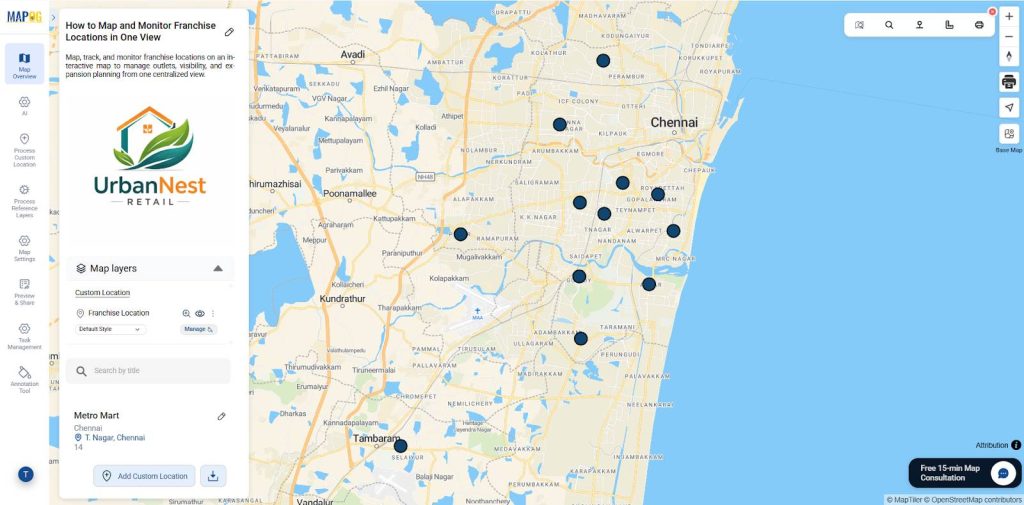
Franchise location maps help track store locations, monitor performance, manage site visits, coordinate teams, compare regional results, and support reporting. This improves visibility, planning, and faster decision-making across all franchise outlets.
However, GIS-based franchise mapping displays all outlets and their real-time status on a single map. It helps teams track performance, manage locations efficiently, analyze regional coverage, identify expansion opportunities, and maintain clear operational oversight across all franchise outlets.
Methodology: Map and Monitor Franchise Locations
1. Create a New Franchise Mapping Project
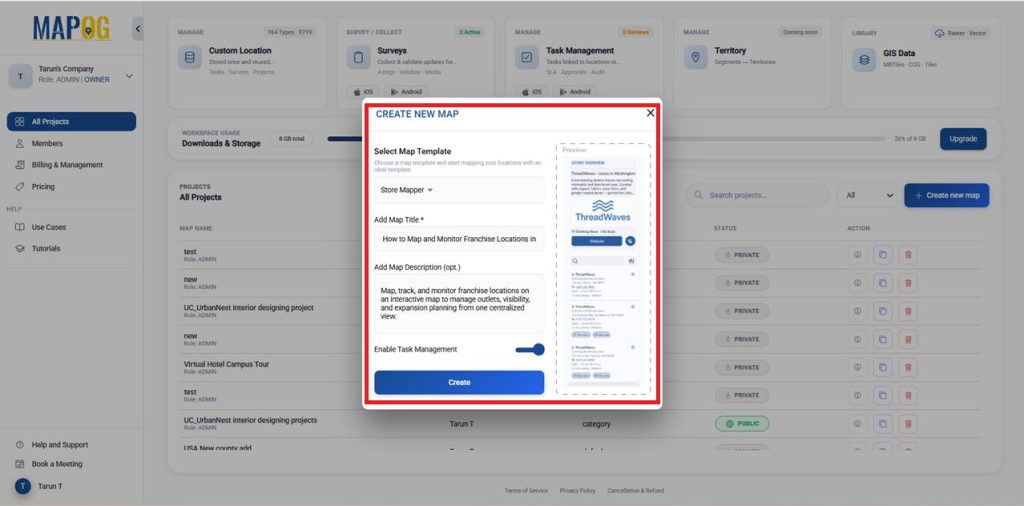
Open MAPOG, select Create New Map, choose the Store Mapper template, enter a title and short description, enable Task Management, and click Create.
2. Add your Image/Logo
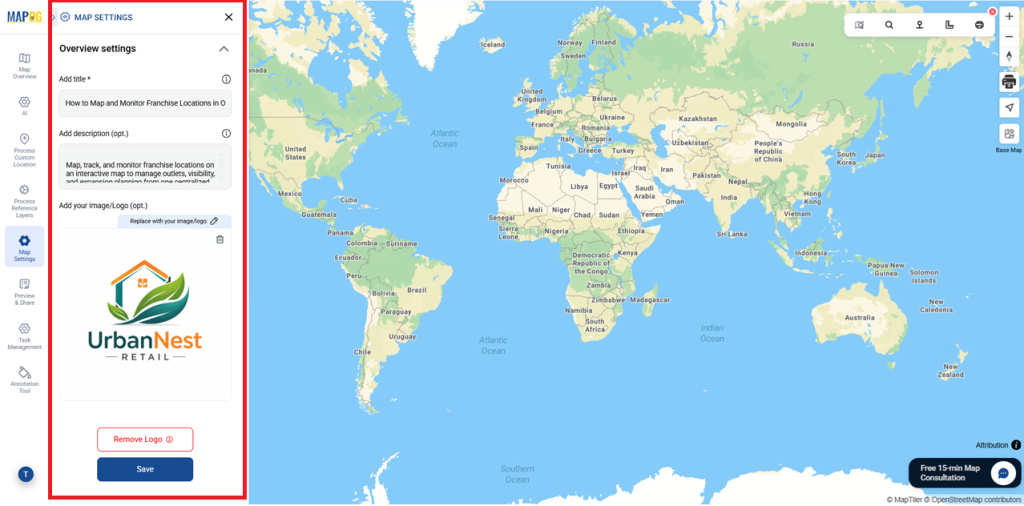
Click Replace to upload your image or logo, make the required edits, and save it as your company logo.
3. Use of Action Button
In Map Settings, select the Action Button to add details like a website link and phone number.
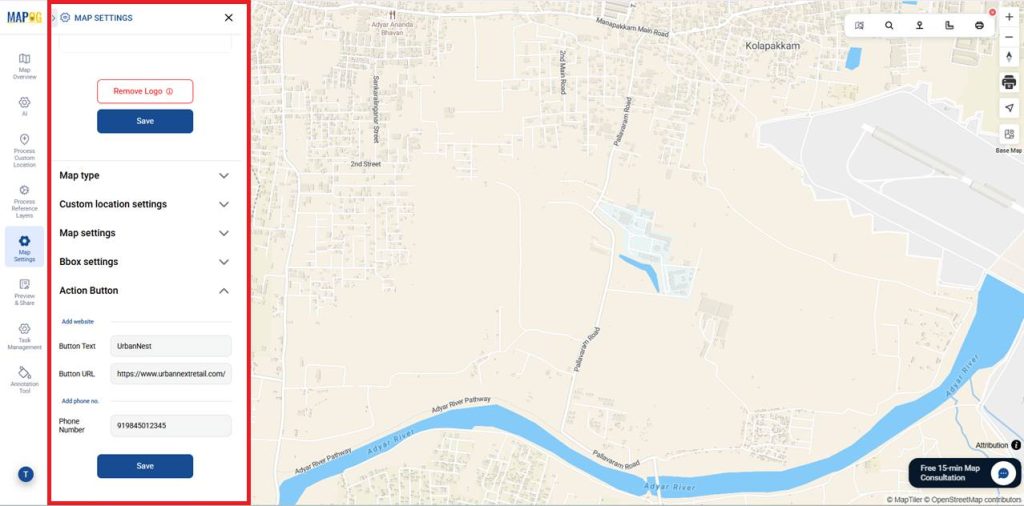
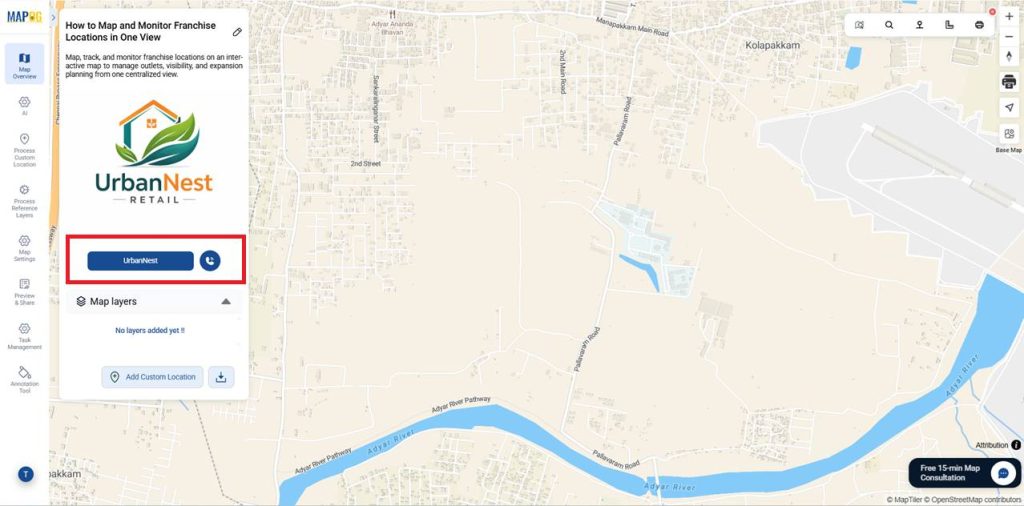
After adding the details, Save them. Selecting the button opens the website or places a call instantly.
4. Add Franchise Location Information
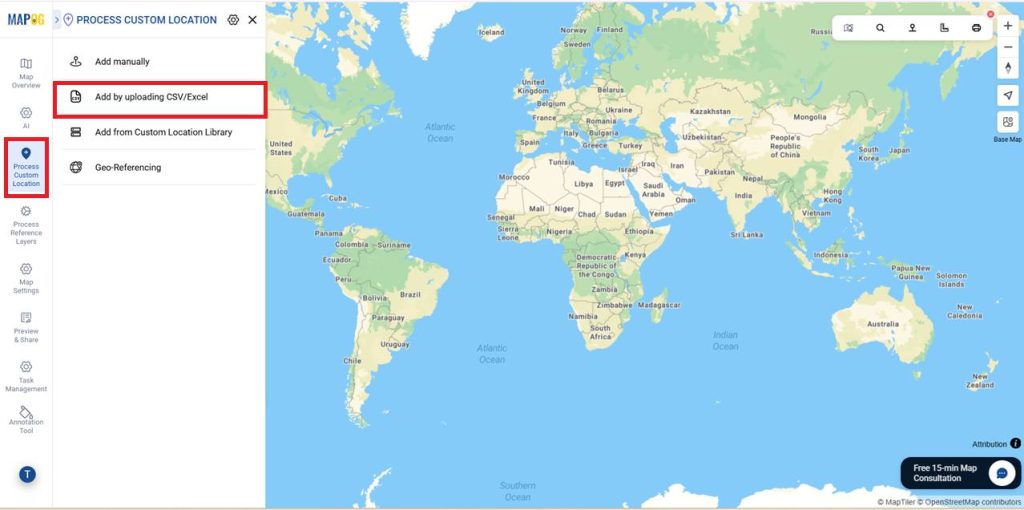
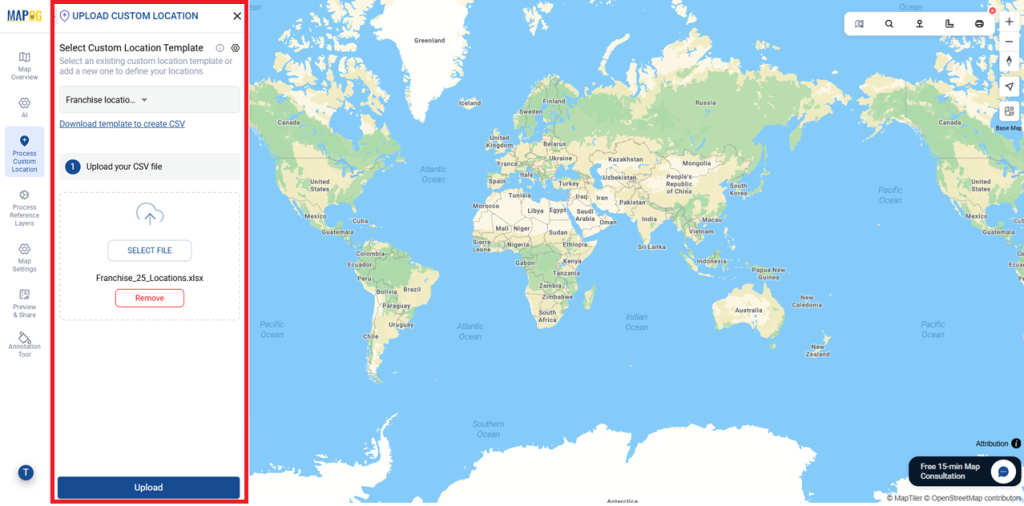
Begin by opening Process Custom Locations and select Add by uploading CSV/Excel. Upload your CSV or Excel file to import all franchise location details in one step.
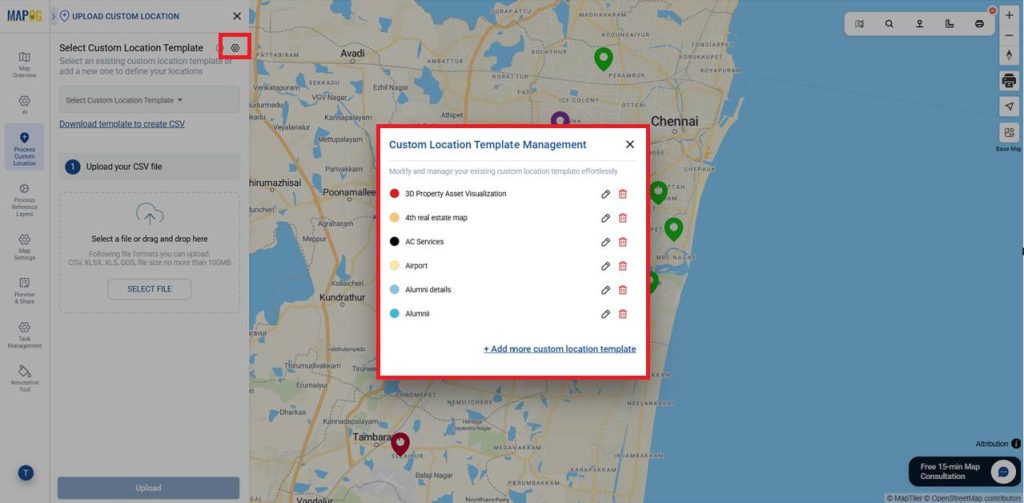
Moreover, go to the Select Custom Location Template Settings option. To create a new franchise template in Custom Location Template Management, click + Add more custom location template.
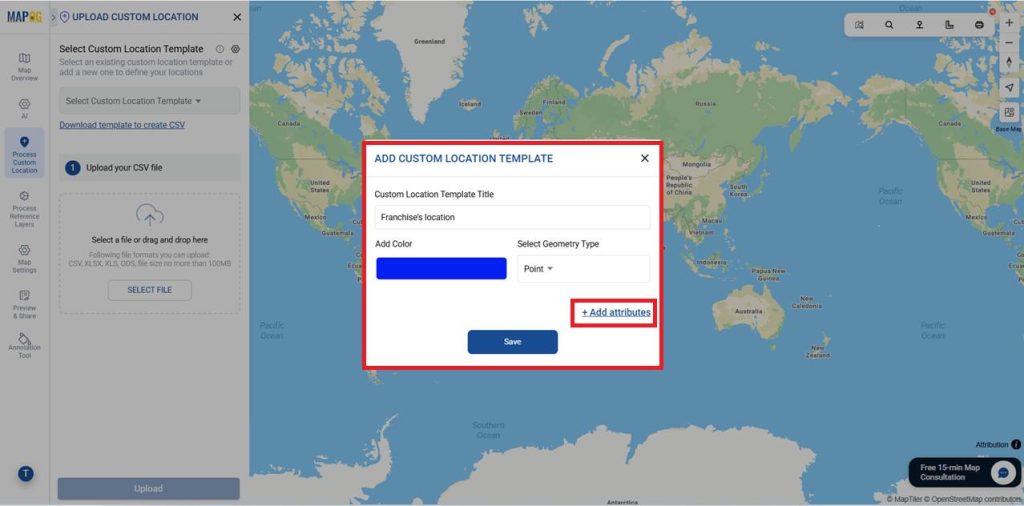
Enter a template name, pick a color, and set the geometry type to Point to mark franchise locations. Then select Add Attributes to store related franchise data.
Include attributes like Franchise Name, City, Store Type, Performance Status, Inventory Level, and more for structured data. Set each attribute type as text, select, or multiselect as required.
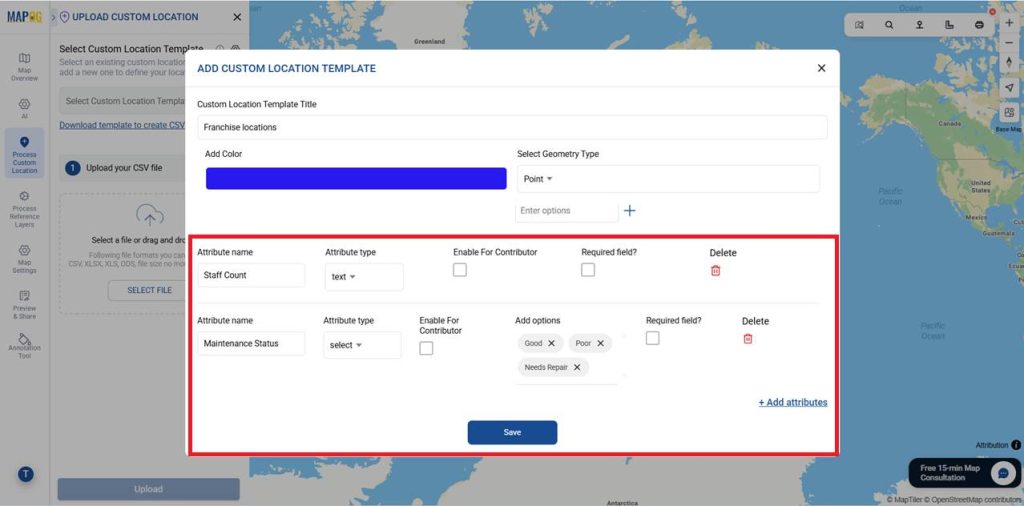
Once all attributes are added, click Save. Then choose the newly created template from Select Custom Location Template, review the attributes, and upload your CSV file using Select File.
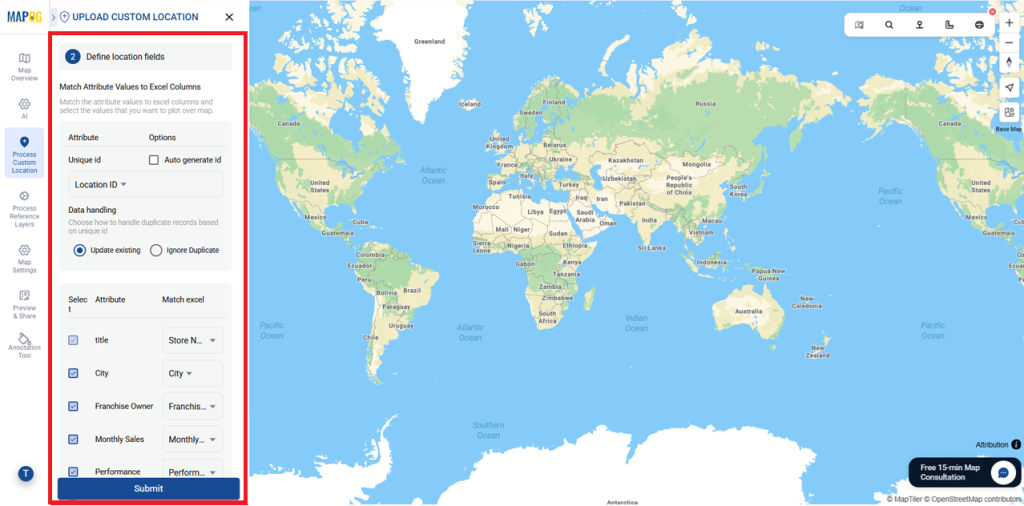
In Define Location Fields, match each attribute to its Excel column and select fields to plot on the map. Use a unique ID to sync data accurately or choose Auto-Generate ID to create one automatically.
Assign Latitude and Longitude correctly under Select Field type, then click Submit.
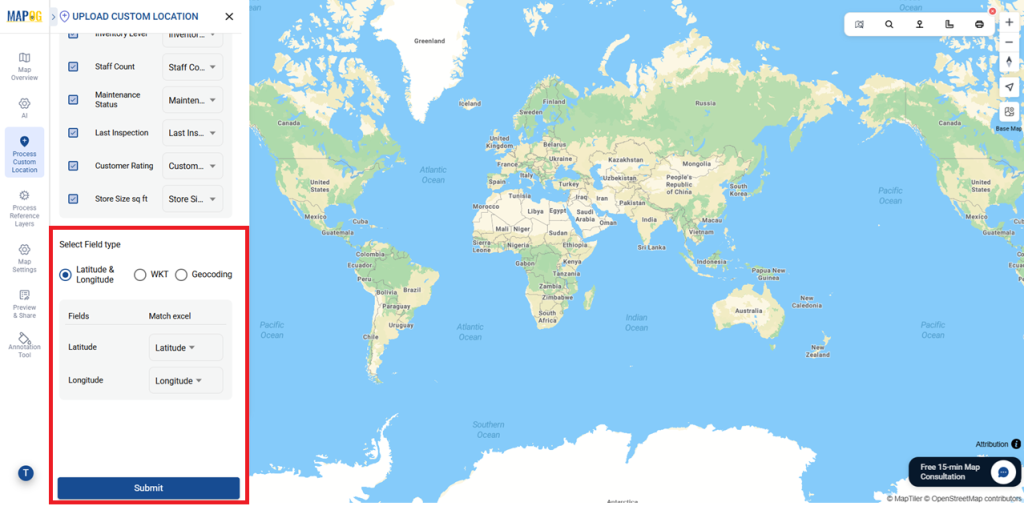
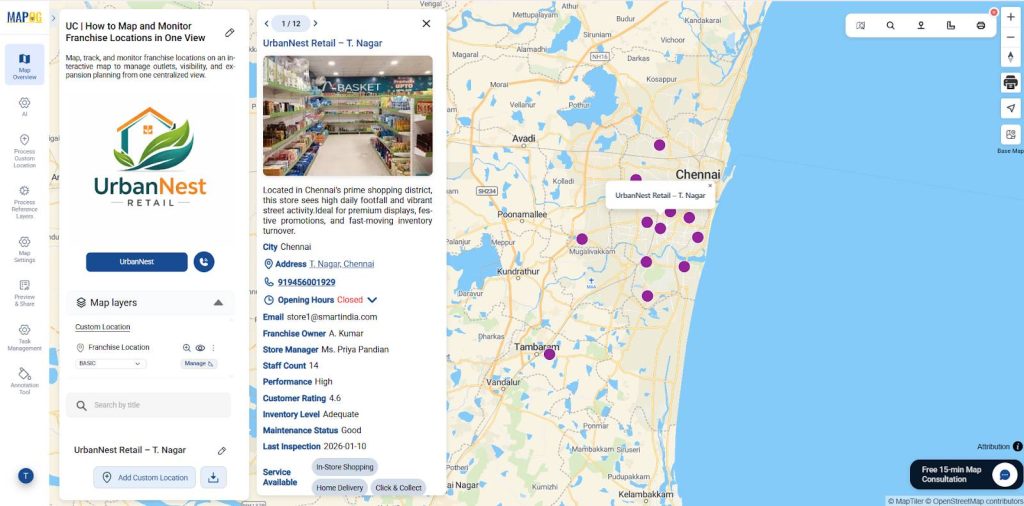
All franchise locations will now appear automatically as points on the map.
You can also upload existing images or capture photos for each franchise. Use Edit Custom Location Details to add descriptions, then save it.
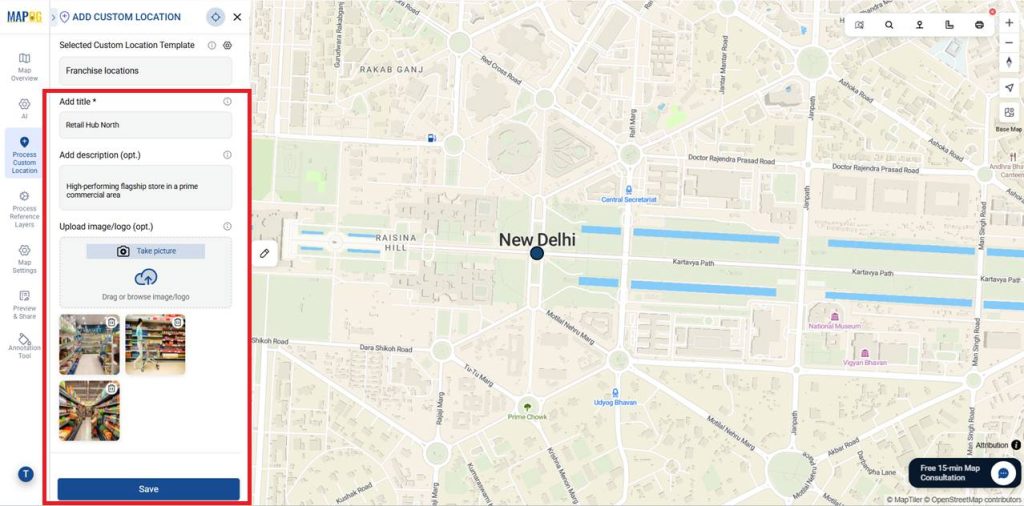
Similarly, you can upload all details for every location.
5. Task Management
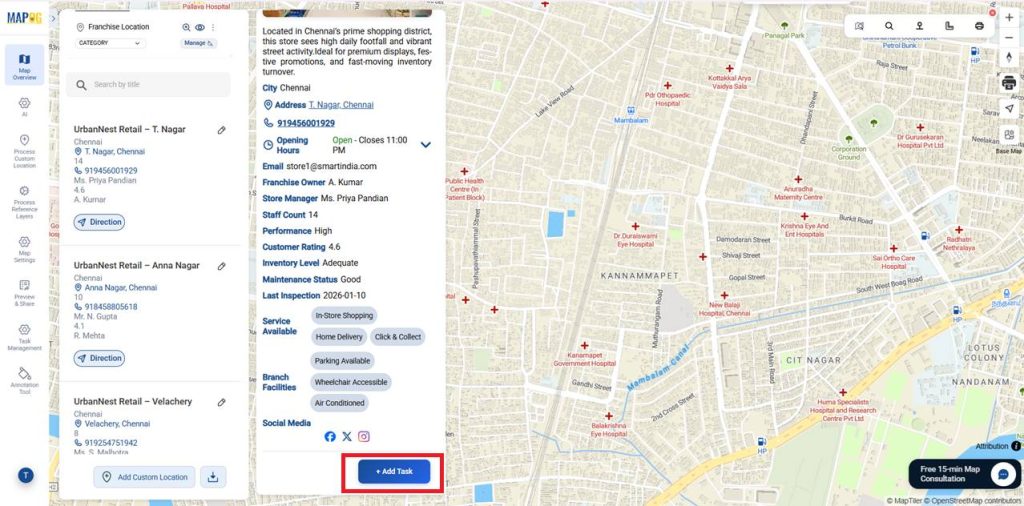
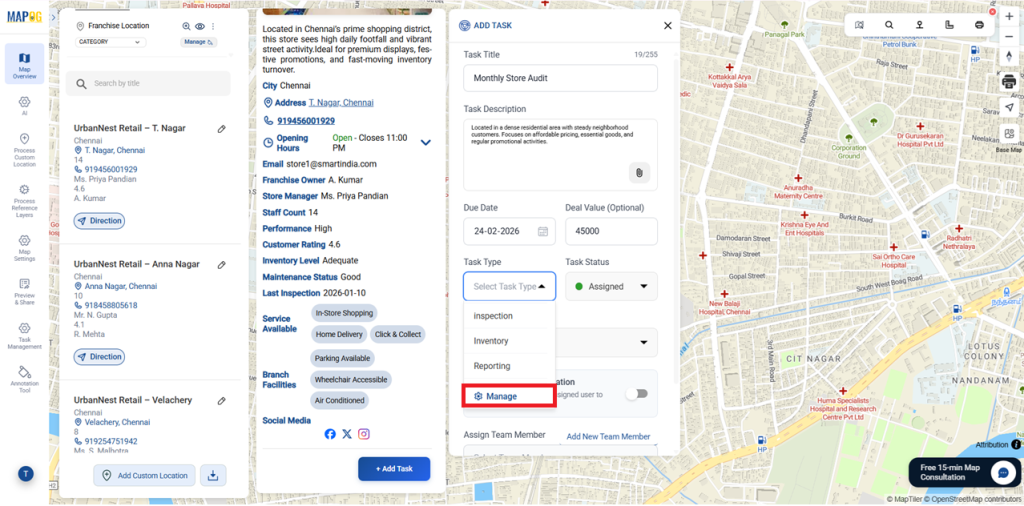
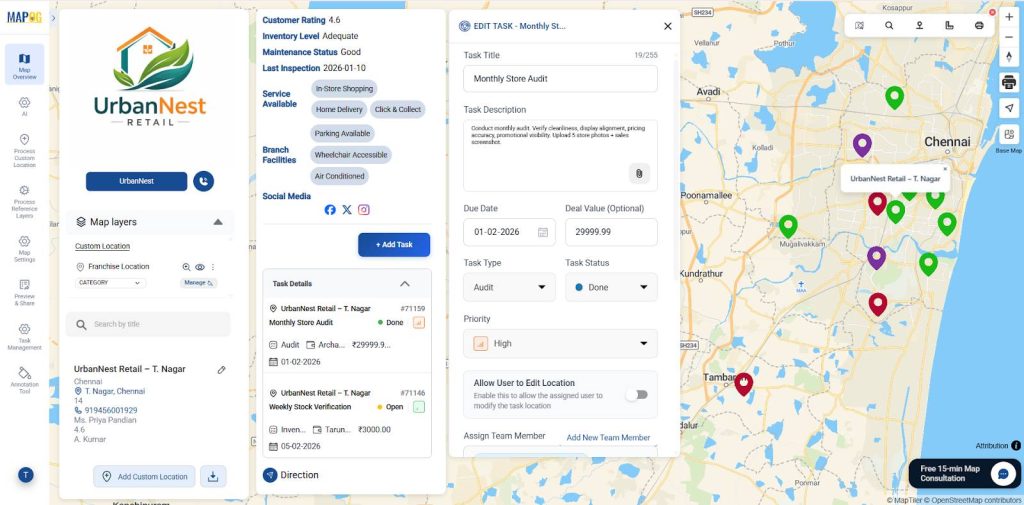
First, select the location where the task needs to be added. Then, click +Add Tasks to continue.
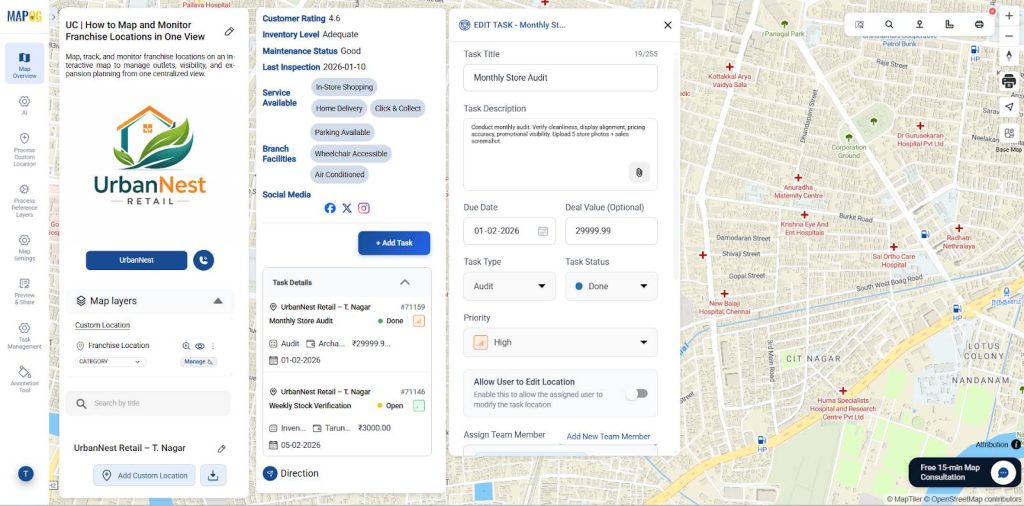
First, add the Task Title and Description. Next, set the Due Date, Deal Value, Task Status, and Priority.
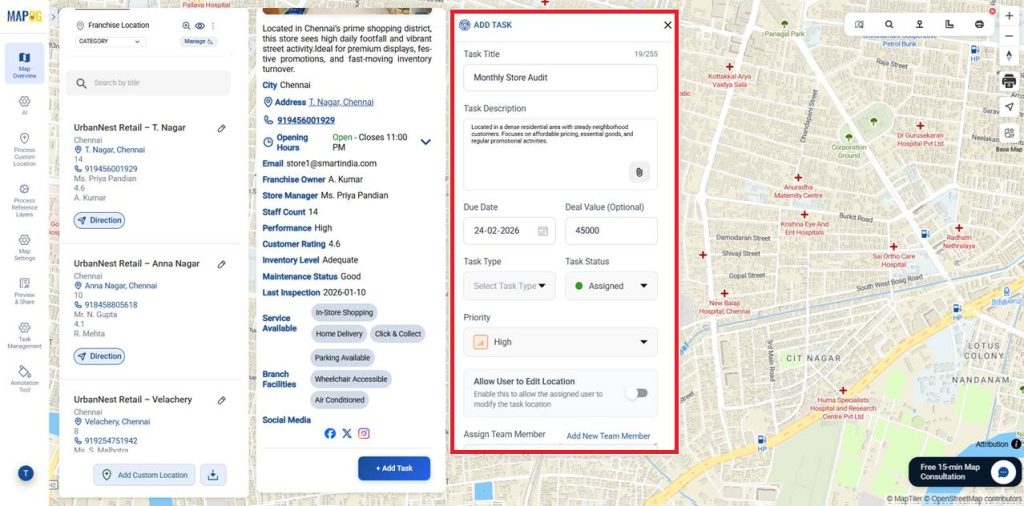
Then, select the Task Type, by selecting the existing or select the manage to add new one.
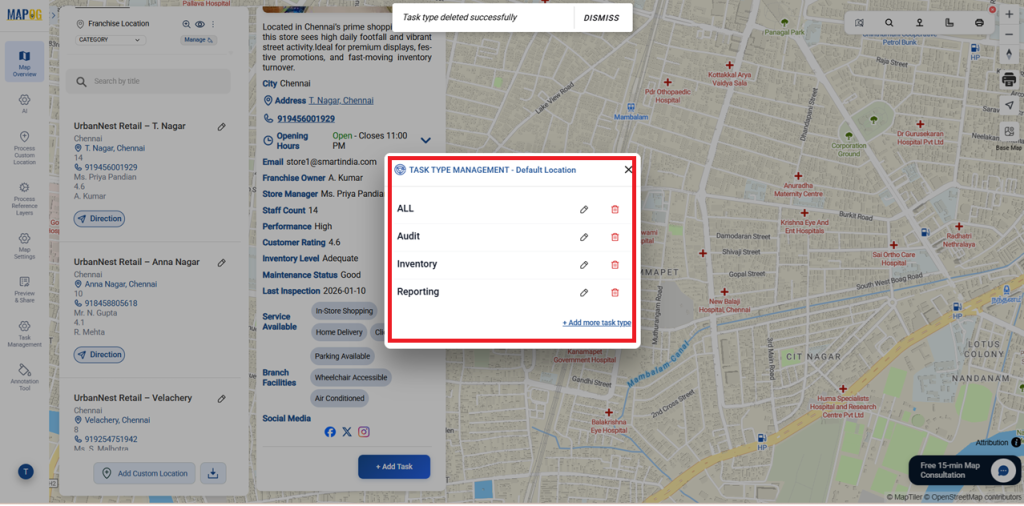
In this Task type Management select +Add more task type if required. Add a new task type and make sure to select it once it has been created.
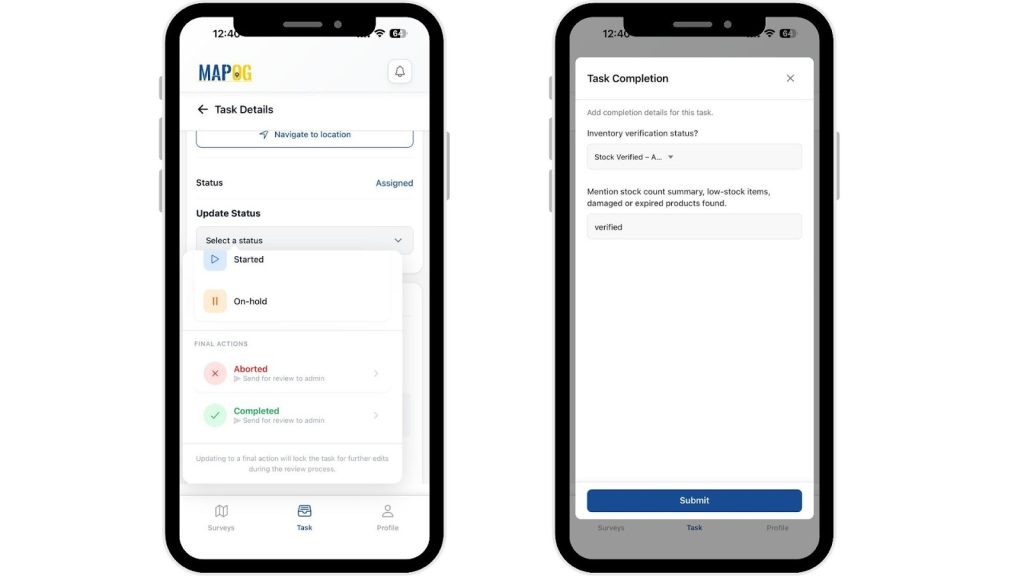
After selecting the task type and while assigning a team member, you’re redirected to the Completion Form Builder. Teams capture required details, upload proof images, and verify standards before completing the task.
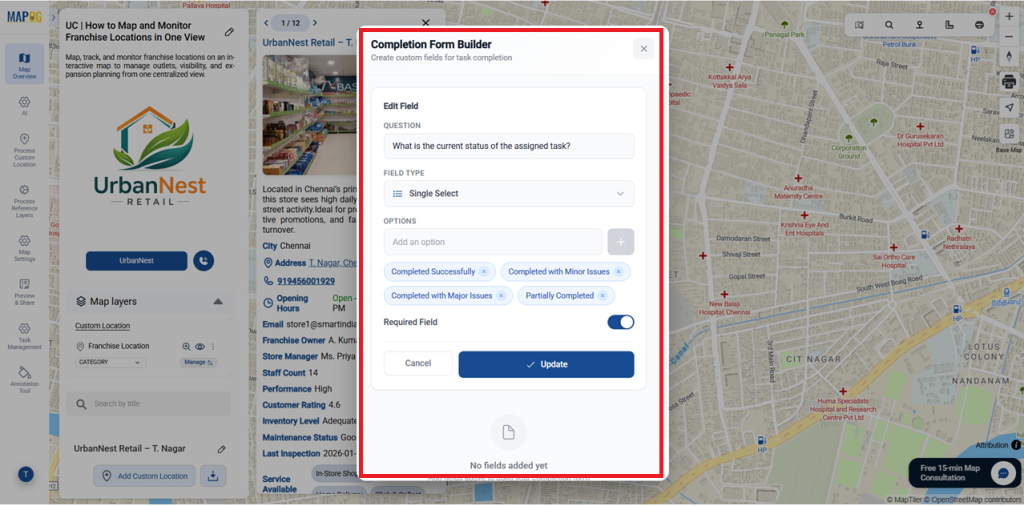
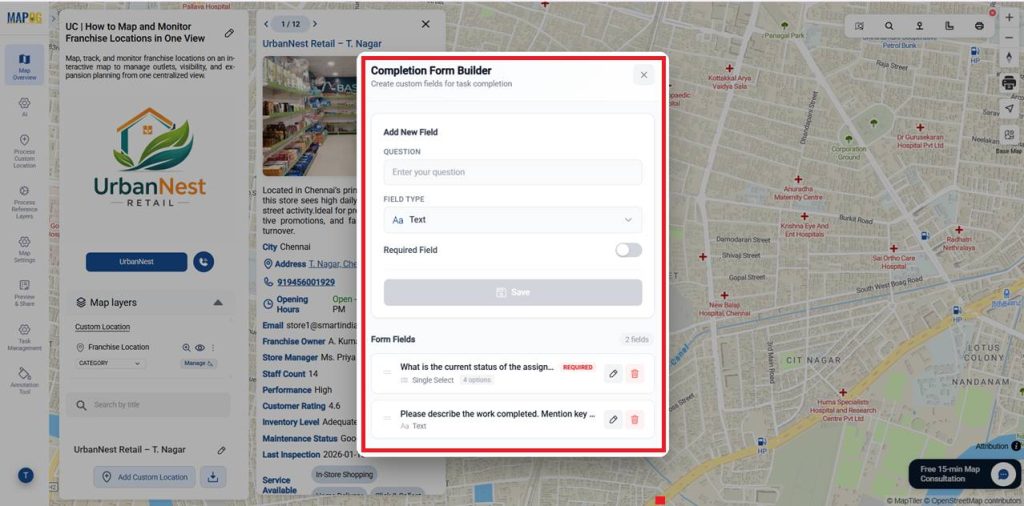
Choose field types like text, select, or image to capture responses or photos. Mark mandatory fields as Required and save the form.
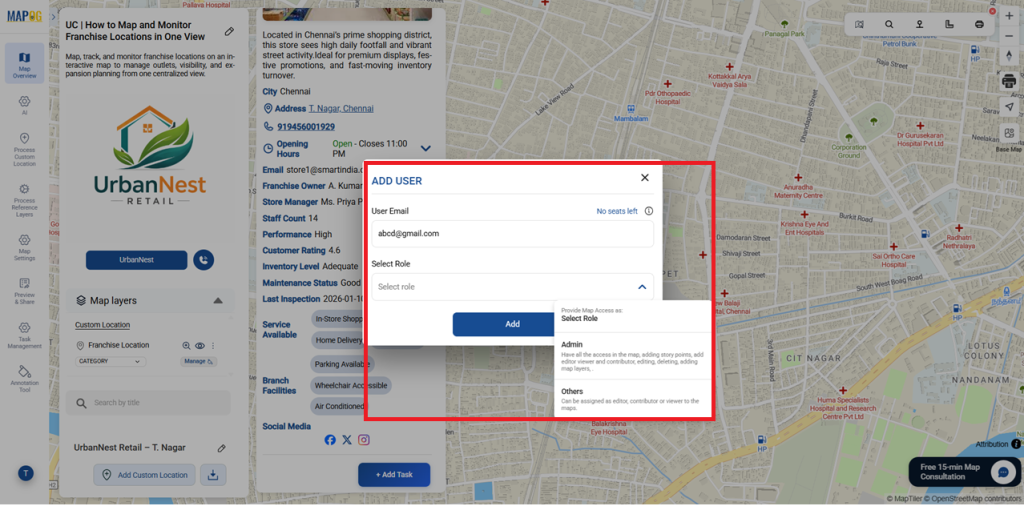
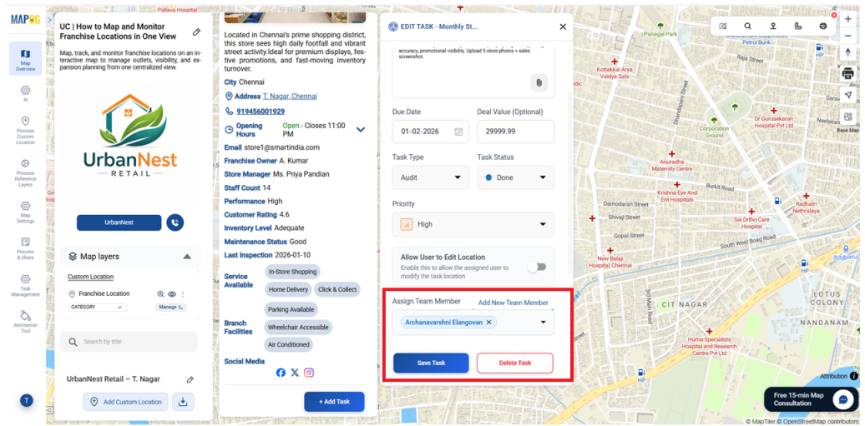
If required, you can also add new team members by selecting Add New Team Member and assigning their user email and role such as admin or others.
Assign a team member, allow location edits if required and save the task.
So, you can add multiple tasks for all locations as needed. Attach custom questions through the completion form setup to collect structured inputs and ensure consistent updates across every location.
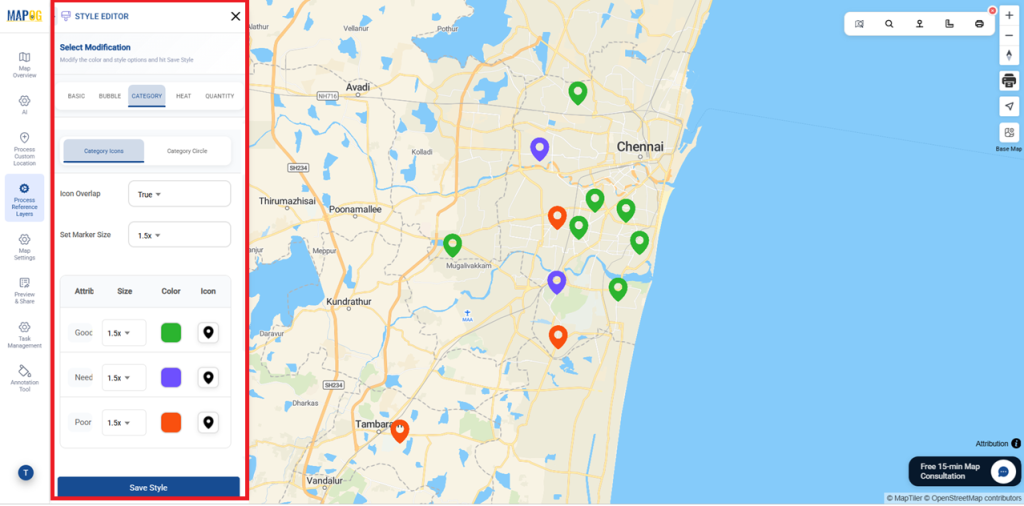
6. Styling the Layer
Go to Settings under Custom Locations and select Add Style Layer.
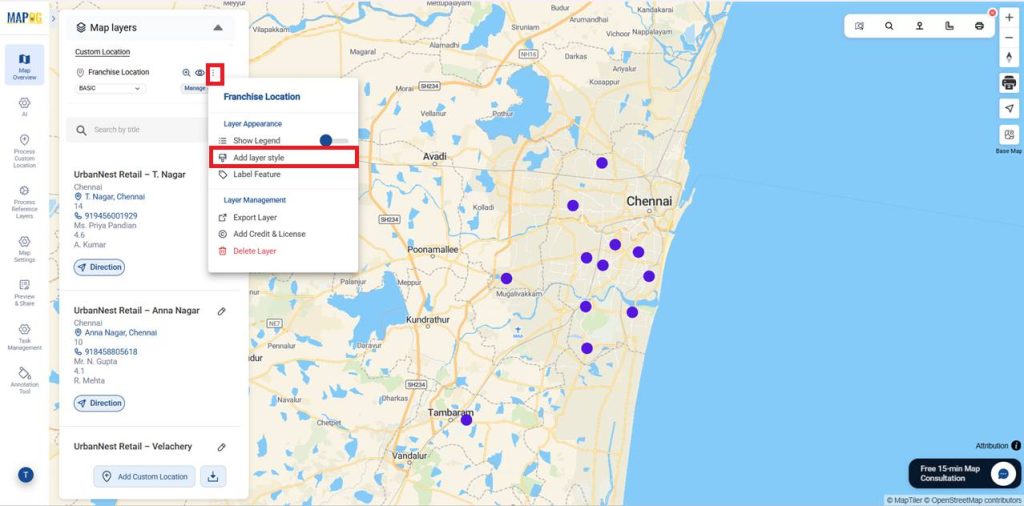
Choose Style as Category and select the uploaded Excel layer. Pick Franchise Type or Performance Status, assign icons, adjust marker size and color, then save to display styled franchise locations.
7. Task Live Status Monitoring
Assignees receive tasks instantly in the MAPOG Contributor App. They can filter tasks, view details, add comments, update status in real time, and upload before-and-after images.
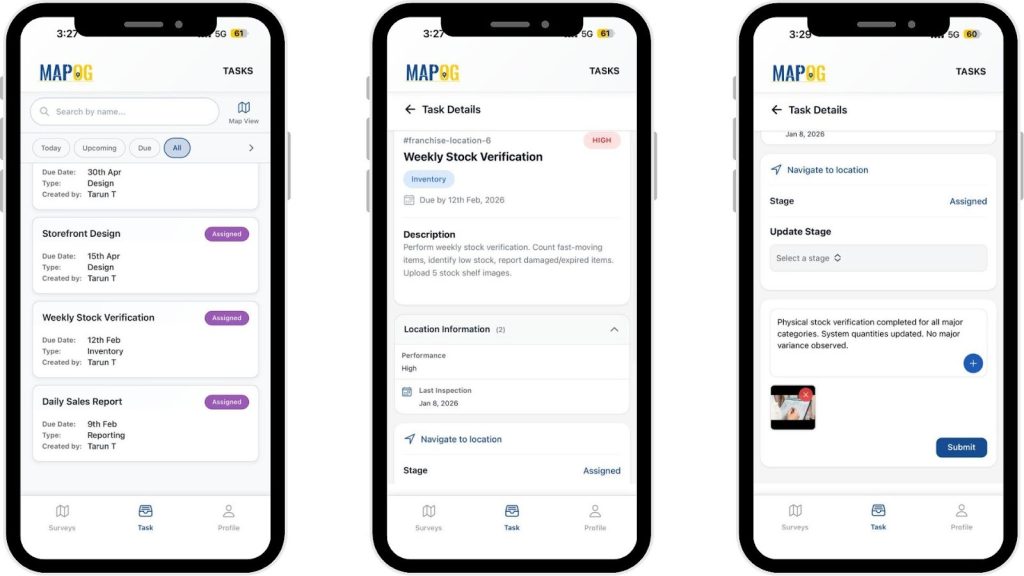
After completion, they must submit a completion form for quality checks and compliance validation before final closure.
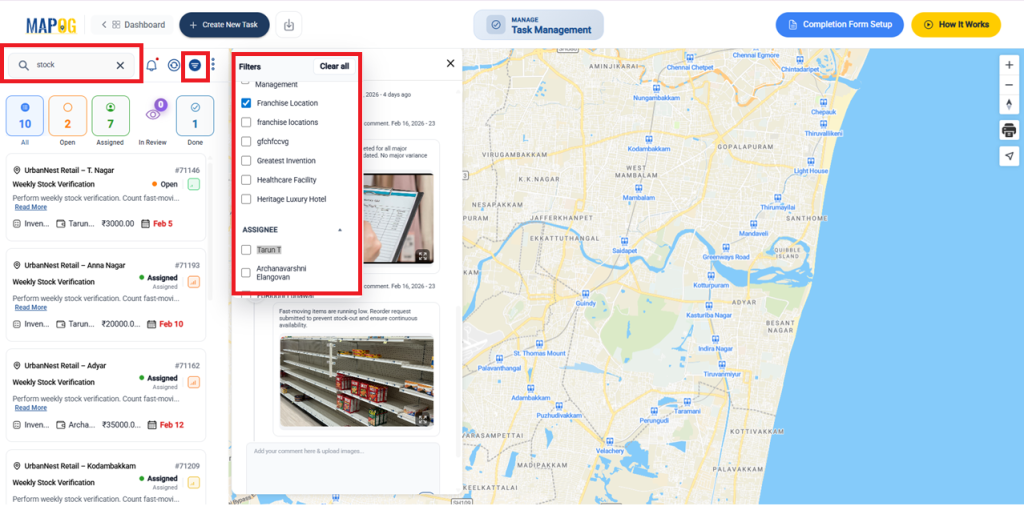
Meanwhile, progress updates appear live in the Task Management section on the map dashboard, where teams can filter tasks by status, priority, or assignee, and view comments in real time for complete tracking and visibility.
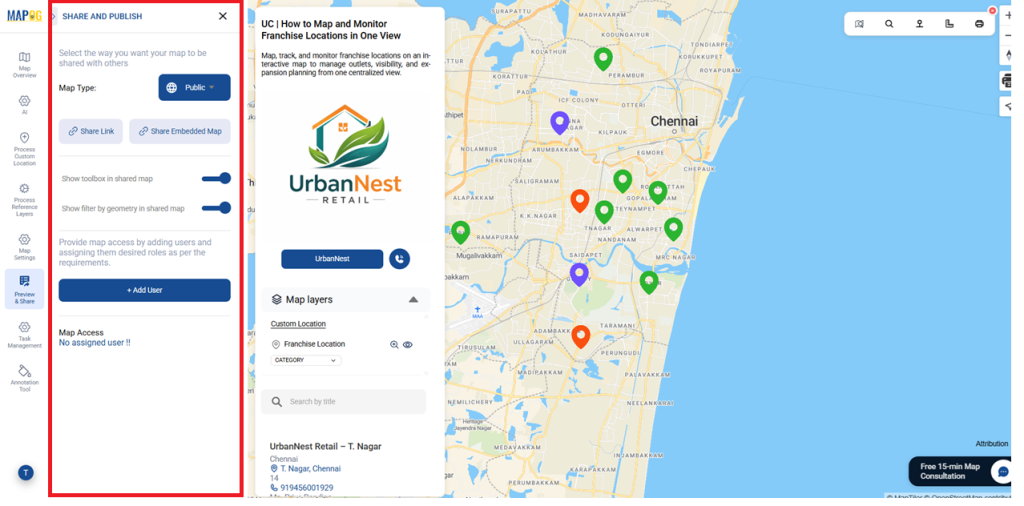
8. Publish and Share Your Map
Finally, once everything is set up, use Preview & Share to publish the map. Generate a shareable or embeddable link so teams and with add user clients can easily view the map and stay updated.
Industry Use Cases and Benefits
Similarly, franchise maps track locations, performance, site visits, team coordination, and regional results, improving visibility, planning, reporting, and faster decision-making across all outlets.
MAPOG Mobile App: Android (Play Store) and iOS (App Store)
Conclusion
In conclusion, MAPOG transforms franchise location and performance data into a single interactive map, enabling clear insights and confident, data-driven decisions from one visual platform.