Traditional spreadsheets and flat property listings hide high-value real estate assets to flat rows of data, critical spatial context making it hard to understand location impact, building scale, and asset relationships slowing decisions and increasing guesswork. MAPOG changes this by transforming real estate data into interactive 3D building maps, allowing teams to Visualize Property Assets Using 3D for instant asset comparison, clear portfolio analysis, and smarter planning, sales, and asset management through real-world visual context.
Key Concept: Visualize Property Assets Using 3D
To begin with, 3D property maps display buildings with real height and floors, rather than flat points. In addition, attributes such as ownership, usage, and availability remain linked to each structure.
Why Visualize Property Assets Using 3D?
In simple terms, it is a GIS-based method where properties appear as extruded 3D buildings using height or floor data, letting users explore assets visually instead of static tables or 2D layouts.
Methodology: Visualize Property Assets Using 3D Using MAPOG
3D mapping simplifies asset analysis, transforming complex inventories into clear workflow
Create the Property Map
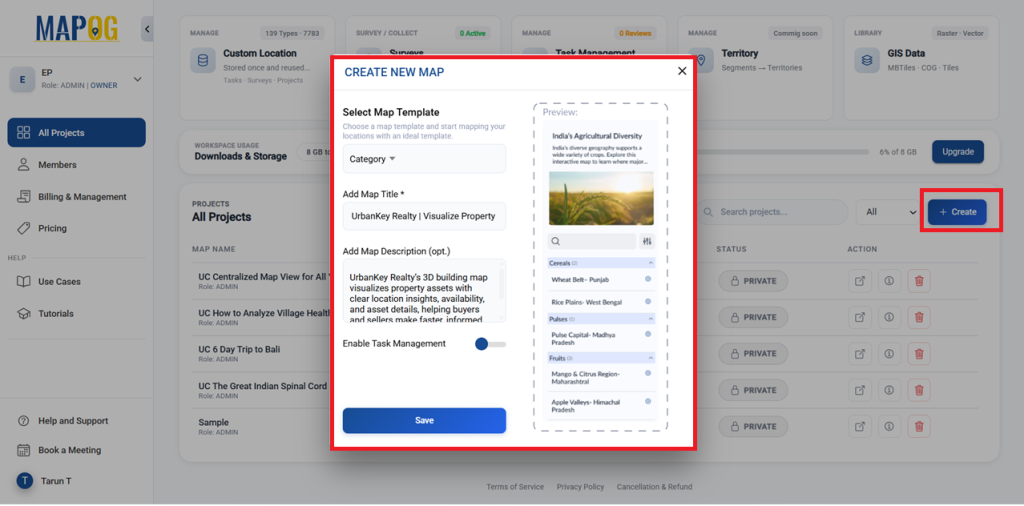
First, open MAPOG and click Create to start a new map project. Select the Category template, then add a clear and meaningful title and description.
Add Property Asset Data
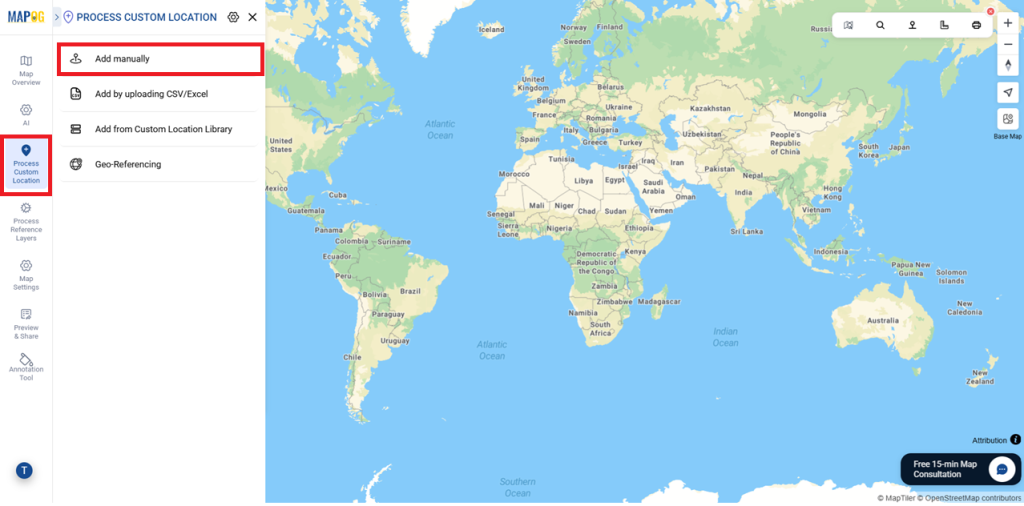
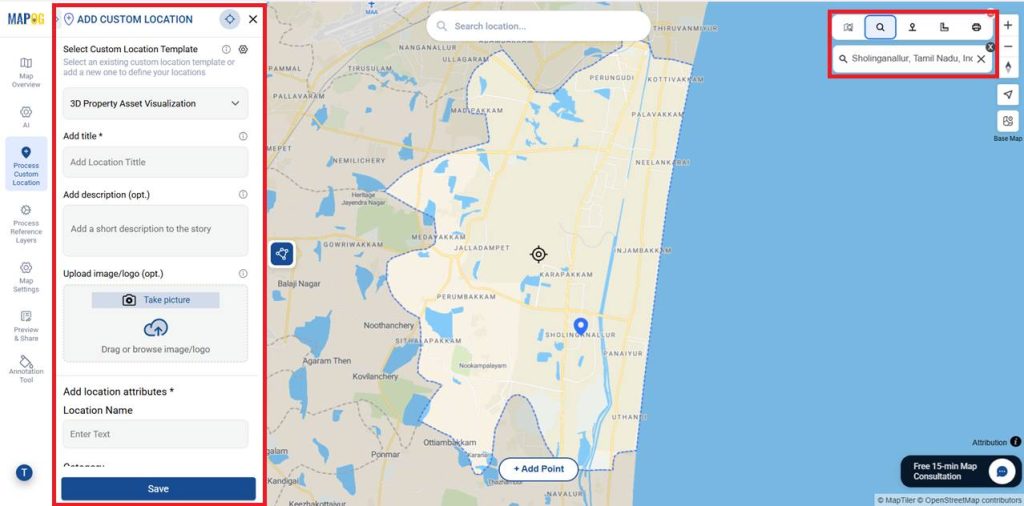
Go to Process Custom Locations and select Add Manually to add locations one by one.
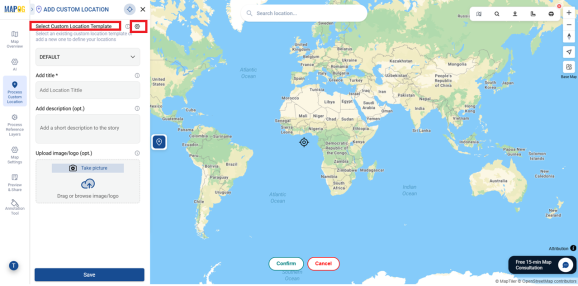
Then open Settings under Select Custom Location Template and click Add More Custom Location Template.
Enter the template title, choose a color, and set the geometry type as Polygon, which defines the building footprint and enables accurate 3D height and depth in MAPOG. Click Add Attributes to include fields like Location Name, Availability, Listing Status, and Market Demand, and set their types as Text, Select, Multiselect, or URL.
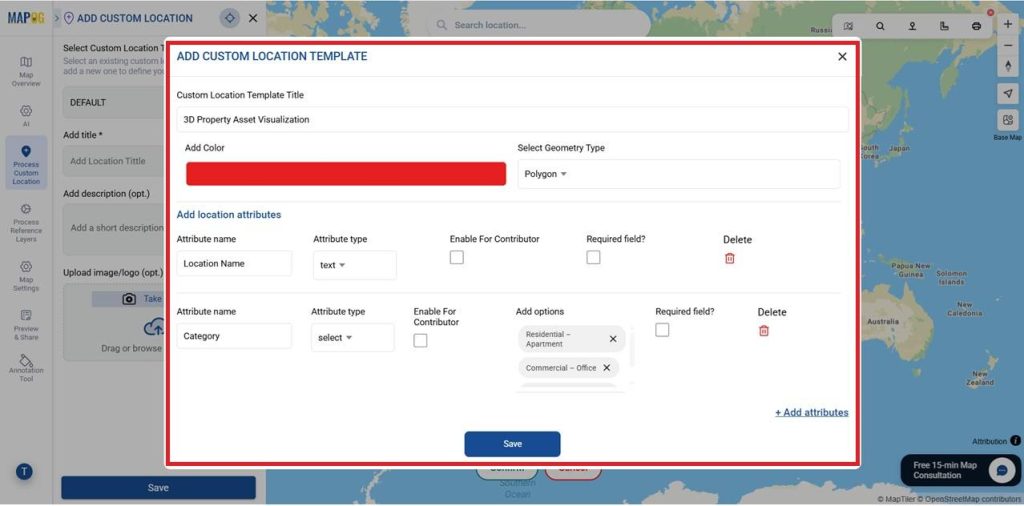
After adding all attributes, click Save. Select the created template under Select Custom Location Template, where all your attributes will appear. Finally, use the Search tool in the top-right corner to select the location you want to map.
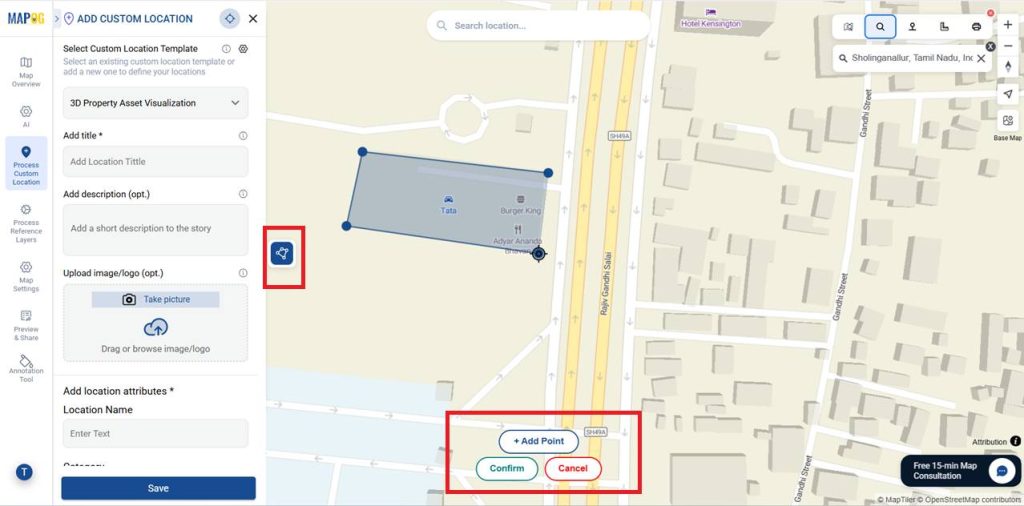
You can also select locations using latitude and longitude from the toolbar. Then draw the map boundary manually using the polygon tool. To add a point, place the cursor at the exact location and click Add Point. Once all points are added, click Confirm.
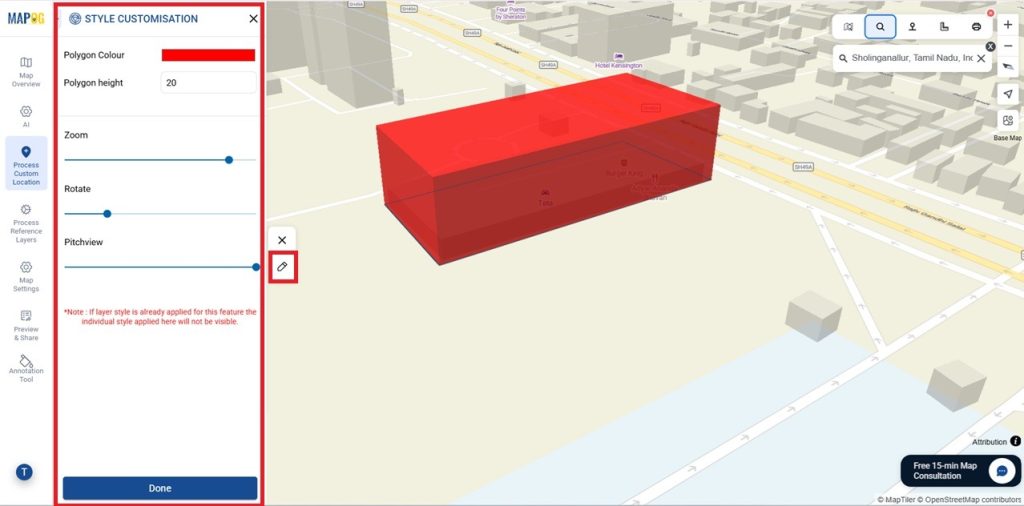
After clicking Confirm, select the Edit icon to open the Style Customization dialog. Set the building color and height, then adjust the zoom, rotation, and pitch to control how the building appears when clicked, and select Done.
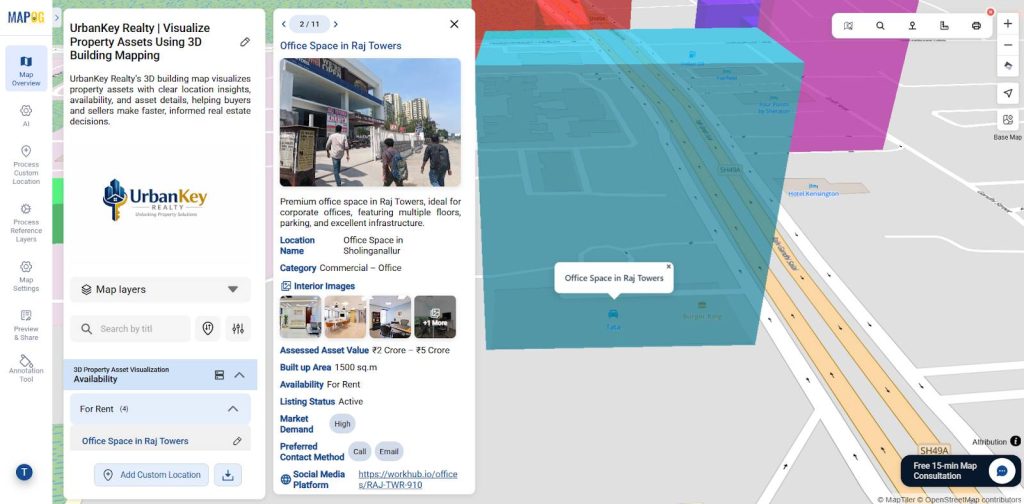
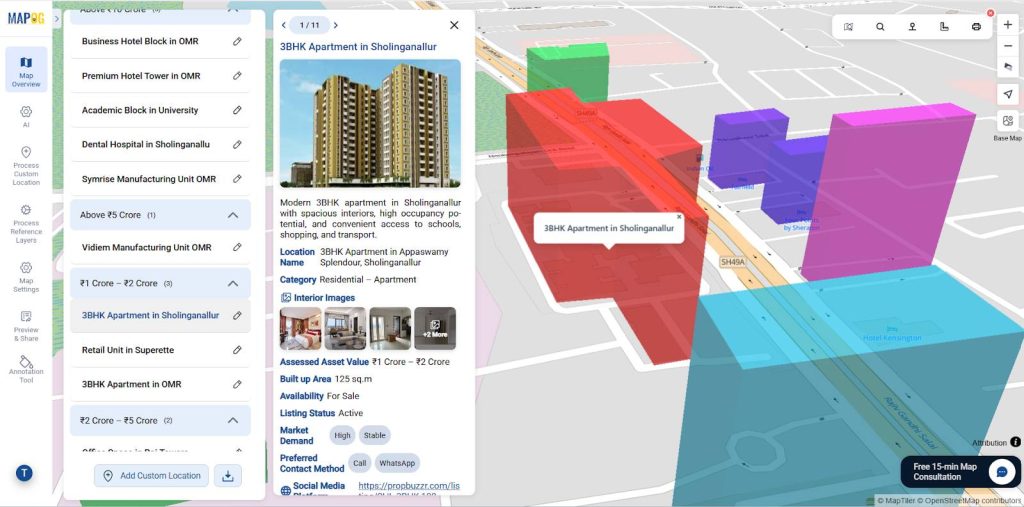
After that, you can add the title, description, image, interior images, category, and all other required attributes as shown.
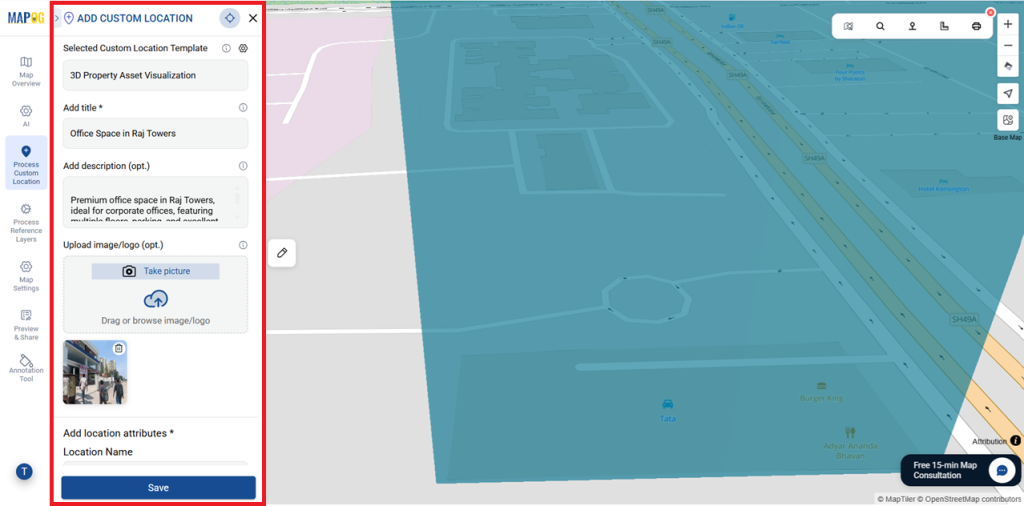
Then save the location to enable interactive pop-ups that display asset details on click. Add all remaining locations the same way, adjusting rotation and pitch for better building views, and save each one for accurate visualization.
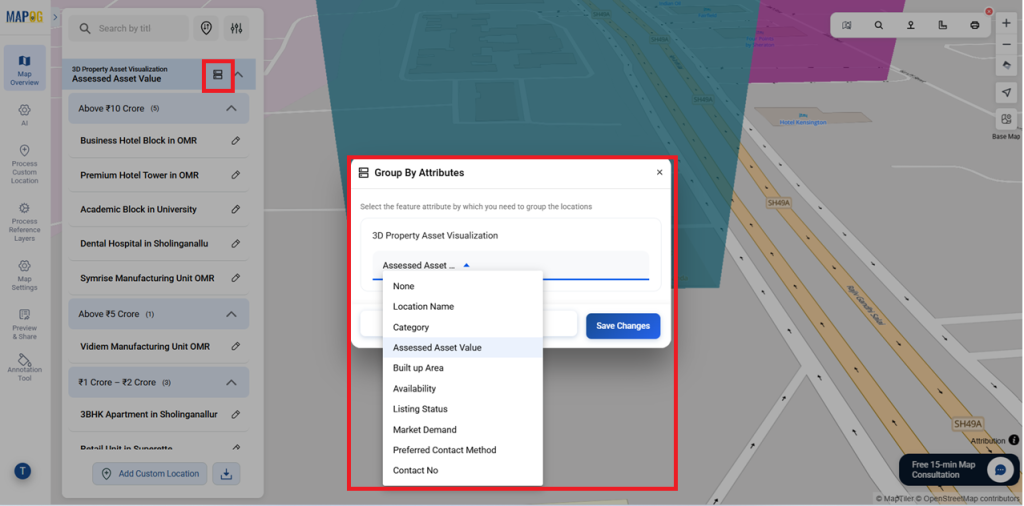
Group by Attributes
Using Group by Attributes, you can categorize buildings by availability, asset value, or market demand. Click Save Changes to apply and view the updated categories on the map.
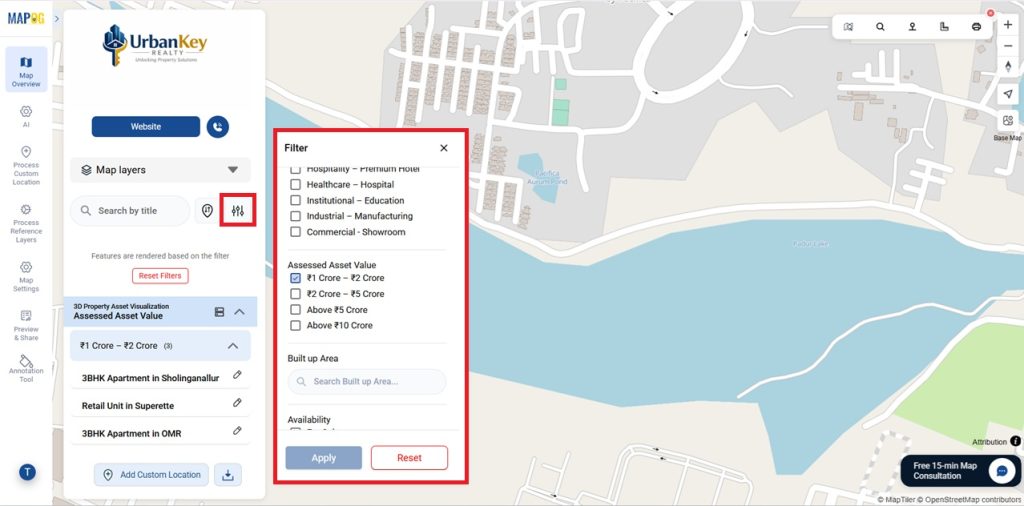
Filters and Sorting Tool
Filters and sorting quickly refine properties by availability, value, demand, or price.Go to the filter tool and select the required criteria based on your needs.
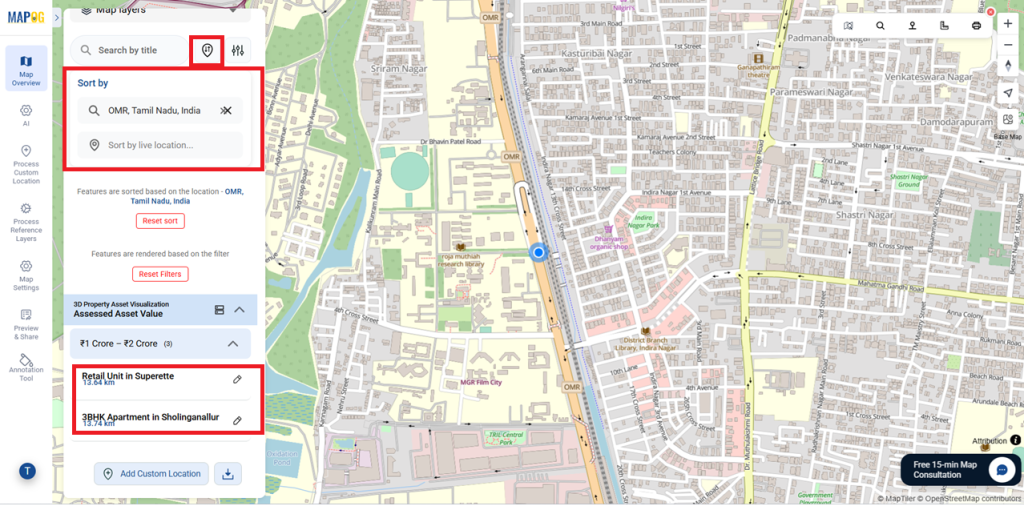
Use Sort to organize locations by name or live distance shown below under each location, combining both for precise results.
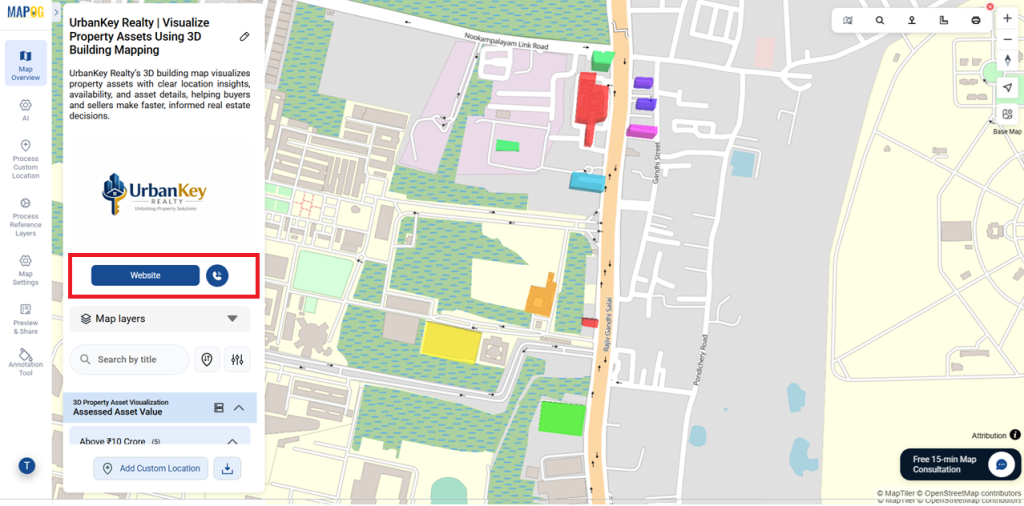
Use of Action Button
Go to Map Setting and select Action Button in which you can add the website and Phone number.
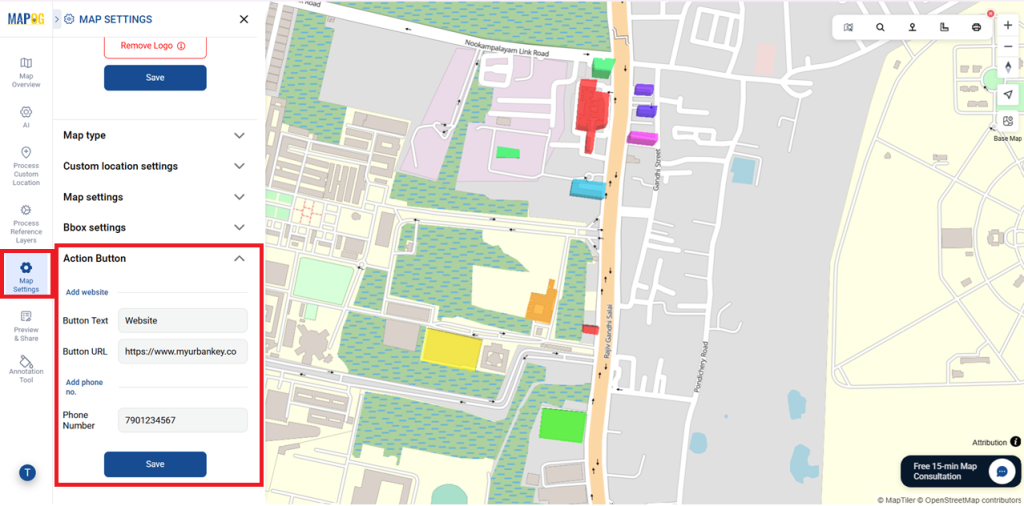
After adding the details, simply save them. Once selected, it will directly redirect you to the website and also allow you to place a call instantly.
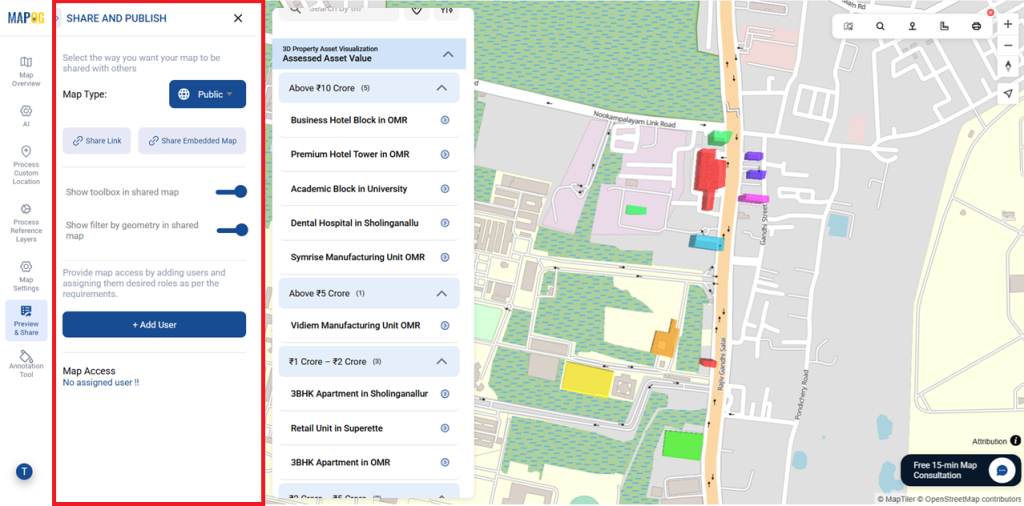
Publish and Share Your Map
After completing, use the Preview & Share option to make the map public and generate a shareable or embeddable link, allowing insights to be easily accessed and shared with stakeholders.
Industry Use Cases and Benefits
Likewise 3D property maps enable quick asset assessment, comparison, portfolio review, better presentations, and faster decision-making.
Conclusion
In conclusion, using MAPOG transforms complex property data into an interactive and decision-ready format.Enables confident, data-driven decisions using a single interactive 3D map.